Gold Short-Term Technical Analysis Guide (November 4th)!!!Gold is showing a converging pattern on the 1-hour chart, with moving averages clearly intertwined and failing to establish a strong directional trend. Gold is currently facing resistance around the 4000 level and hasn't shown a strong upward breakout. If gold breaks through and holds above 4000, then the 4020-4030 resistance zone should be monitored during the US session. Overall, gold is expected to remain in a range-bound market.
Goldtradeidea
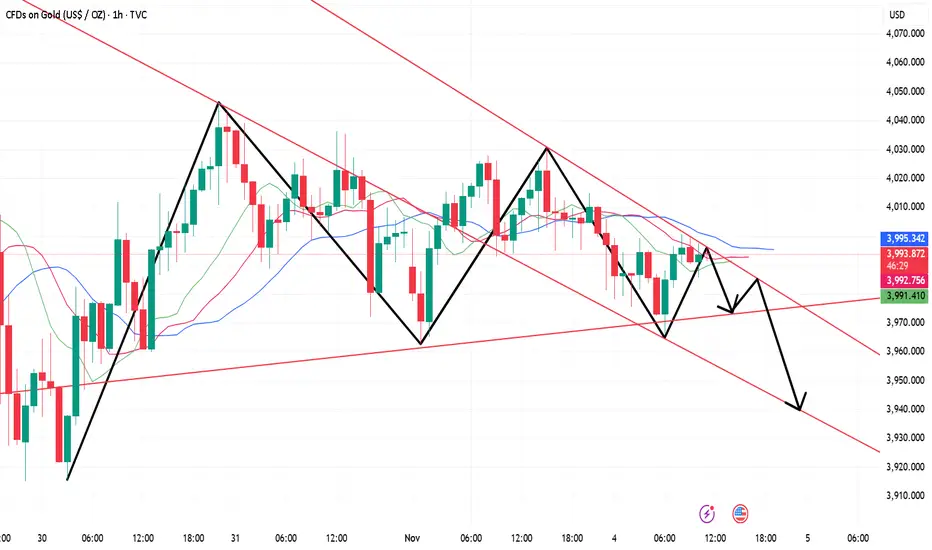
Gold prices dipped and rebounded; watch for 3980.Gold prices traded within a range today, with bullish and bearish forces relatively evenly balanced.
In Asian trading, gold opened lower and quickly dipped, hitting a daily low of $3962 before rebounding. As of pre-market trading, gold is currently trading around $4000. Looking at the hourly chart, the Bollinger Bands are narrowing, and gold is trading below the middle band, exhibiting typical range-bound trading characteristics.
During the US session, watch for resistance at $4030. A break above this level could present a buying opportunity on a pullback, with a target of the $4050 area. If prices fall again, watch for support around $3980. In short, the market remains range-bound; avoid chasing highs or lows.

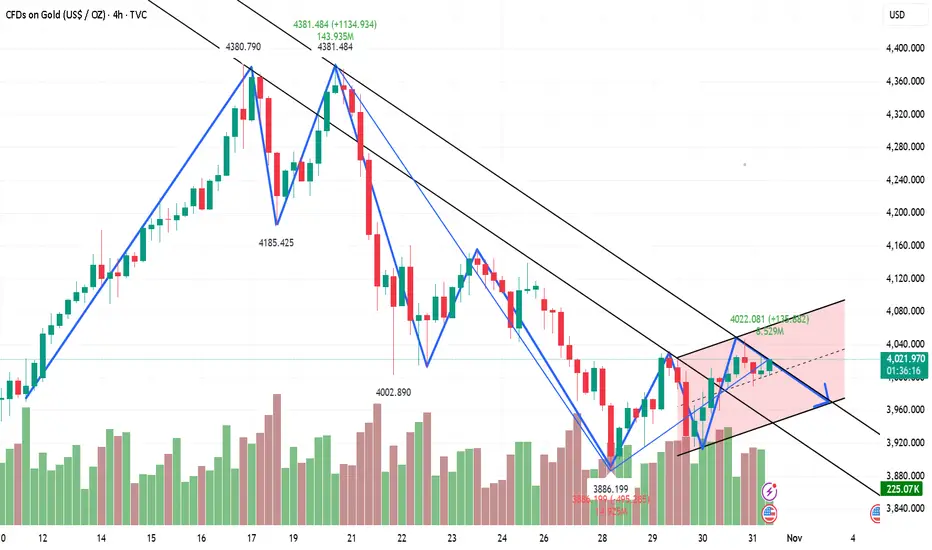
Gold prices fluctuated upwards on November 3rd, but bulls faced From the 4-hour chart, the current resistance level to watch is 4030-35, with a key resistance level at 4047-55. The short-term support level is 3965-70. The recommended strategy is to primarily sell on rallies, avoiding chasing the market and patiently waiting for key entry points. Specific trading strategies will be provided during trading hours; please pay close attention.
Gold Trading Strategy:
1. Sell gold on rallies to 4030-35, add to the short position on rallies to 4047-55, stop loss at 4069, target 3960-3965, hold if it breaks through.

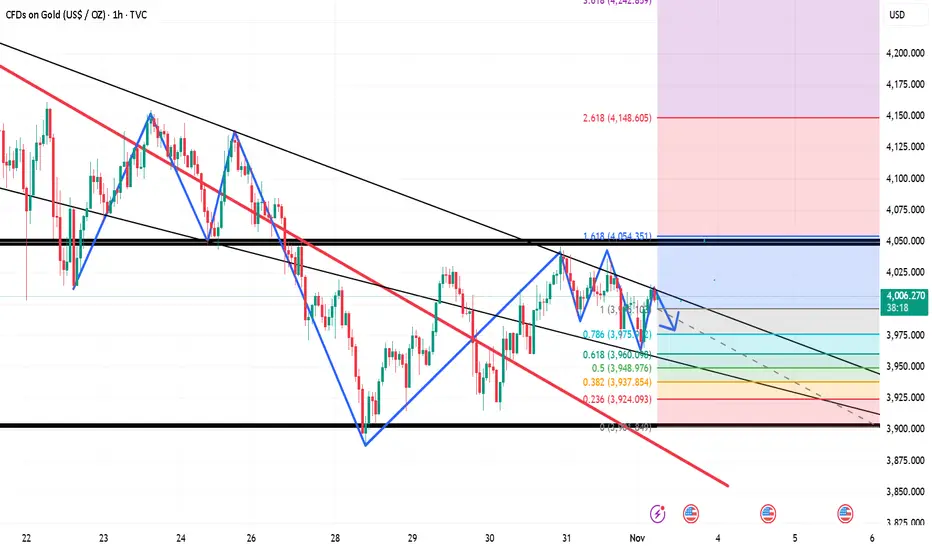
Gold Intraday Short-Term Analysis and Trading Strategies (NovembGold is currently oscillating between the 61.8% and 78.6% Fibonacci retracement levels (3945-4136), but trading volume remains weak. A further rise followed by a fall back to the 50% Fibonacci retracement level of 3811 cannot be ruled out. Stronger support lies nearby, at the 89-day moving average of 3753. This means the short-term correction is not yet over. Today, the key resistance level to watch is 4060-70, with a smaller resistance level at 4020.
Intraday Short-Term Trading Strategy:
Primarily sell on rallies, with buying on dips as a secondary strategy. Support levels to watch are 3979, 3936, and 3882.
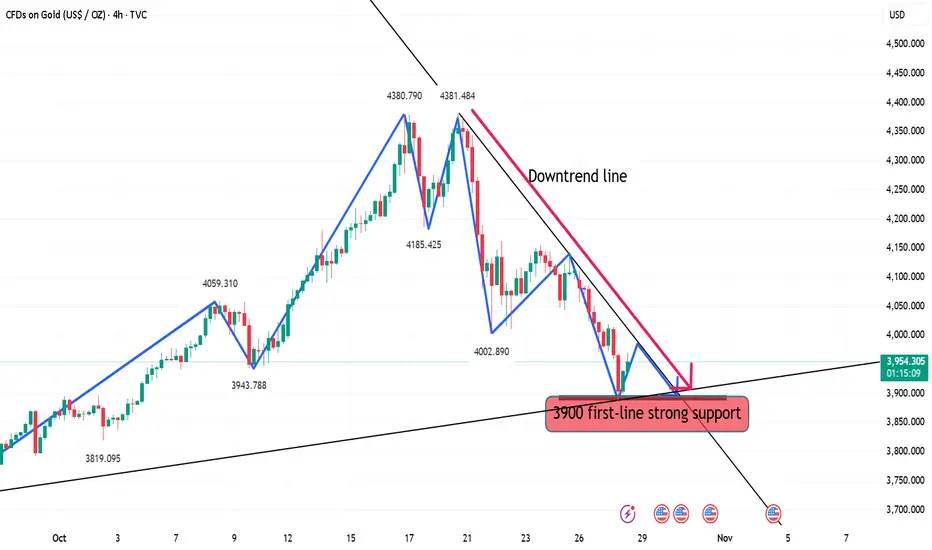
October 31st Gold Intraday Short-Term Trading Guide!!!Gold prices retreated from around 4044-46 during the day, hitting a low of 3988 in the morning. Currently, it's oscillating within the 4000-4126 range. Today is the weekly and monthly close, potentially triggering a significant price movement. From a trend perspective, short-term gains remain limited. A further dip to 4000 is possible amidst the consolidation. A break below 3986/3960 could lead to a move towards 3920-3900. The recommended strategy is to sell on rallies, but be aware of the risks.
US Session Trading Strategy:
Sell near 40120-25, stop loss at 4035, target 4000-3990, continue to look for further downside if the price breaks through.
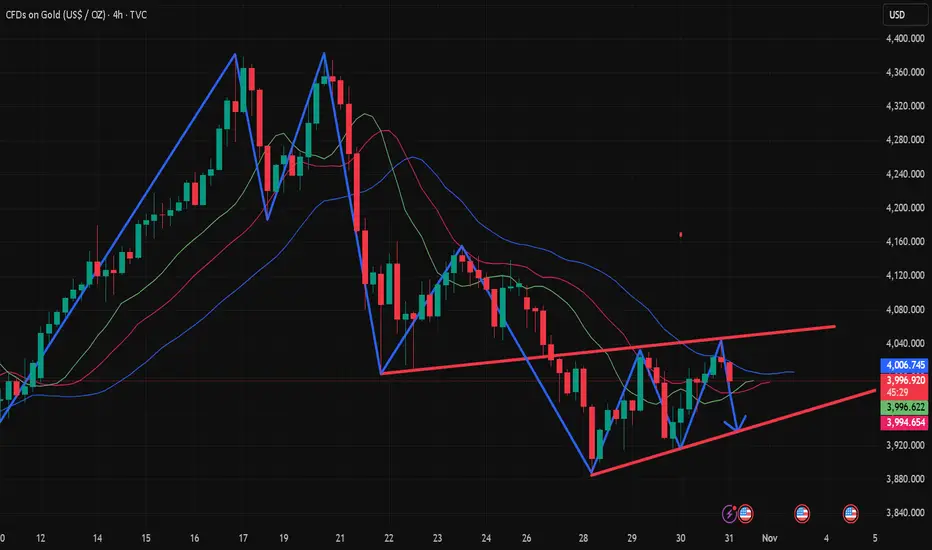
October 31st, Golden Week Holiday, Monthly Closing DateFrom the 4-hour chart, the current short-term resistance level to watch is 4030-35, with a key resistance level at 4047-55. Short-term support is at 3965-70. For overnight trading, focus on range trading; avoid chasing the market and wait patiently for key entry points. Specific trading strategies will be provided during trading hours, so please pay close attention.
Gold Trading Strategy:
1. Sell gold at 4030-35, add to the short position at 4047-55, stop loss at 4069, target 3970-3965.
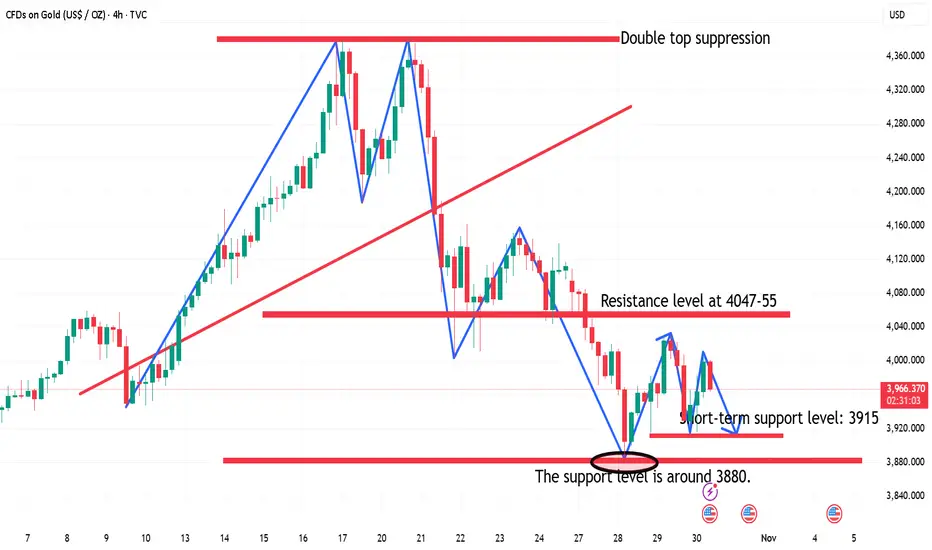
US session short-term trading strategy guidance at 10:30!From a 4-hour chart perspective, the current short-term resistance level to watch is 3978-85, with a key resistance level at 4047-55. Short-term support is at 3915-20. Trading should focus on range trading; avoid chasing the market and patiently wait for key entry points.
Gold Trading Strategy:
1. Sell gold at 3978-3985, stop loss at 4009, target 3880-3895, hold if it breaks through;
2. Buy gold at 3915-20, stop loss at 3896, target 3977-85, hold if it breaks through.
‘10.29 Buy first below 3900 and then sell!Technical Analysis:
The first resistance area above is 3960-70. Maintain a short position below this level. If the market unexpectedly breaks higher, focus on the 3995-4005 area, which remains bearish. If the market weakens, the 3945-50 area, previously the starting point for the rally, has become a source of pressure after breaking below it today.
Key support areas below are the 20-day moving average (SMA) at 3865-70 and the 50% level at 3840-45.
Trading strategy: Maintain a short position on rebounds.
Participate in the 3960-70 area, targeting a new low. After a new low, consider entering long positions based on the 20-day moving average and the 50% level.
Gold finds support in the short term, target is 3950Gold has found support at 3886. A short-term rebound is expected around 3950-55. At this level, you can switch to short positions, with a focus on 3965. If it breaks through 3973 and breaks above the support level in the Asian session, abandon your short position and switch to a full long position. In the short term, we're looking for a rebound around 3950-55. Here, you can short, but be mindful of the risk.
October 28th Gold US Trading Strategy:
1. Buy around 3900-3910, stop loss at 3886, take profit at 3940-50.
2. Short around 3950, stop loss at 3965, take profit at 3910.

10.28 Gold continues to fall to 3970For the day, we will focus on the support at 3970. If it falls below, the price will continue to fall to 3950-3900-3850. In the short term, we will focus on the 4020 line and the resistance near 4060. After breaking through 4020, the price will continue to rebound and test the 4050-4060 line. However, the main strategy for the day is still to go short.
Strategy:
Go short near 4006-4010, defend 4021, and target 3970-3940-3900-3850
The second short position above is near 4054-4060, and the target position remains unchanged.
As for the long position below, it is at 3895 and 3870.

Gold shorts are coming, rebound under pressure and short sellGold hit resistance twice today and broke new lows again. Currently, the market is fluctuating at a low level, with resistance levels decreasing and the lows falling. The overall trend remains weak. Previous support at 4047-55 has become resistance. Focus on the downside: last week's lows of 4000-4004. The 4000 level will be the first barrier for bears to break through. Key resistance from above remains around the 4047-55 level we identified earlier.
Technical Analysis:
From the 4-hour market trend, short-term resistance at 4047-55 is currently under pressure. Gold is struggling to break through this resistance. Trading strategies should prioritize shorting on rebounds. In the intermediate range, be cautious and watchful, and wait patiently for key entry points.

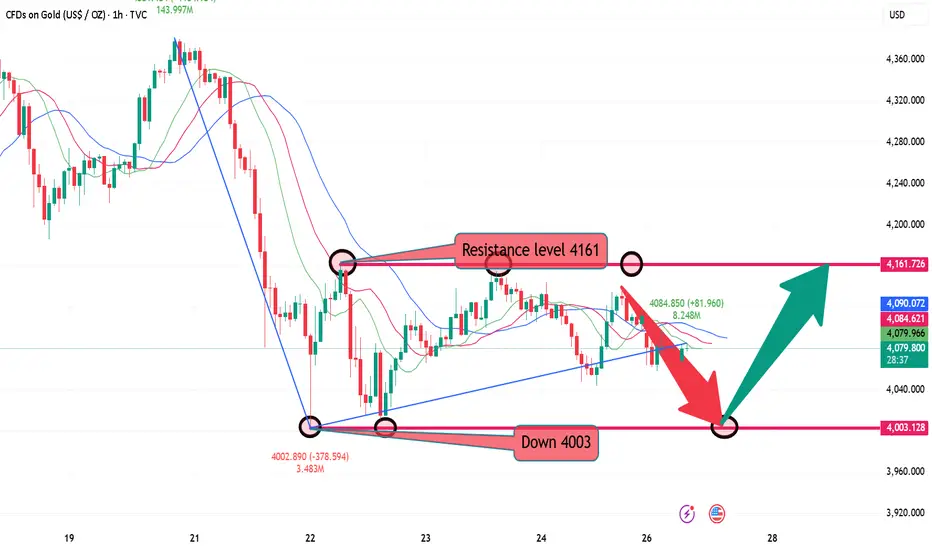
Gold continues to maintain the oscillation range of 03-60Gold's potential correction from its highs lies between 4003 and 4161, with room for a significant correction of 160 pips. Gold plummeted during today's Asian and European trading sessions, leaving a clear resistance level. We should focus on the minor resistance level of 4097. If it fails to hold above, bears will continue their decline and seek deeper support. Shorts should avoid candlestick charts near 4003. A break below the bottom of the oscillation this week could lead to a deeper correction for bears.
Resistance levels are 4097 and 4035, while support levels are 4065 and 4045. The dividing line between strength and weakness is 4097.
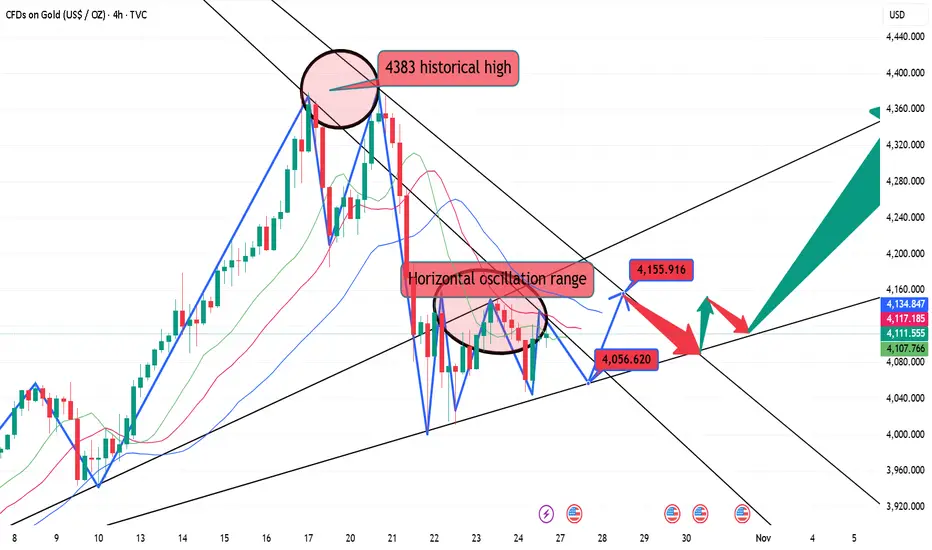
Gold daily K-line stopped falling, and the slow bull correction On Friday, the market corrected for 2 hours, finding support near 4045 on the lower 2-hour band, before retracing upwards. Next week, tomorrow, the 3-hour correction will gradually begin. Currently, the 3-hour BOLL is moving sideways, further oscillating within the range. Once the 3-hour correction concludes, the 4-, 6-, 8-, and 12-hour bands will begin to correct. Ultimately, the next bullish and bearish trend will unfold during this 4- to 12-hour correction.
On Monday, we'll initially focus on the 3-hour BOLL band range. Currently, the range is between 4155 and 4050. Within this range, the market will continue to fluctuate, with buy low and sell high being the primary strategy. Therefore, a buy low, sell high strategy within the 4155-=4050 range should be sufficient.
Technical Analysis:
1: The 3-hour correction is evident, with the BOLL range moving sideways, within the 4050-4155 range. Buy low, sell high is a viable strategy within this range.
2: The 4-hour Stochastic and MACD lines are both blunting, indicating a temporary sideways trend. The central axis of pressure is near 4145 .
3: In the daily K-line chart, the Stochastic is blunting and moving downward, signaling a bearish bias. The MACD is initially forming a death cross and moving downward, signaling a bearish bias. However, the central axis of the daily K-line is holding support, currently moving up to around 4085, followed by support around 4000.
Overall, the technical outlook suggests a range-bound trend within the 3-hour chart, followed by a gradual upward trend within the 4-hour chart, followed by a volatile upward trend within the daily K-line. This is the corresponding signal of the current market; but the specific approach is mainly to wait and see and respond as needed!
10.24 US market technical analysis!!!Gold hourly level: It stabilized and rebounded at 4105 overnight, and fell again in Asian session today, only rebounded from a double bottom at 4105 to 4144, and the price re-stood on the 66-day key moving average, because the Japanese and US sessions suppressed this moving average and fluctuated downward all the way; then after the positive line closed and broke through it, it was thought that if it held 4105, it could continue an upward trend. As a result, it consolidated for several hours and broke below 4100 in the afternoon, triggering a wave of decline, and hit the trend line of 4044 at the lowest, and got a certain rebound effect. After breaking through 4100, we will see the bullish trend, and the key support lies at 4150-4160.
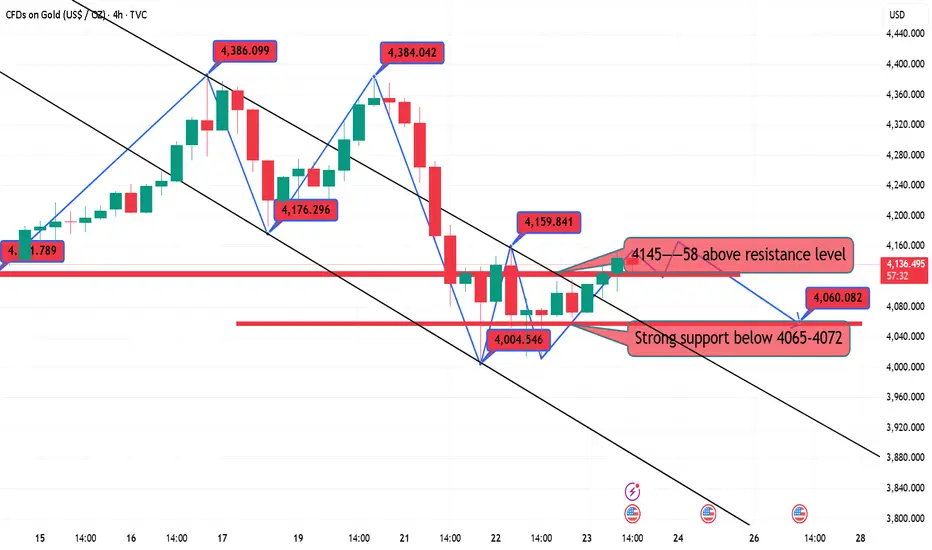
10.24 Gold US Trading Strategy, Bulls Bottom Out and Rebound as Looking at the 4-hour market trend, the current short-term resistance level at 4142-50 is being monitored on the upside, while the short-term support level at 4065-4070 is being monitored on the downside. Gold is under pressure and difficult to break through. For trading, the primary strategy is to go long on pullbacks. In the middle, be cautious and follow orders carefully, patiently waiting for key entry points. I will provide detailed trading strategies during the trading session, so please stay tuned.
Gold Trading Strategy:
1. If gold rebounds and doesn't break through the 4145-52 level, go short. Set a stop-loss at 4160, and target the 4015-4000 level. Hold if it breaks through!
2. If gold retraces to the 4085-93 level, go long. Set a stop-loss at 4073, and target the 4130-35 level. Hold if it breaks through!
Gold goes on a roller coaster ride. Continue to short below 4100Looking back at the price of gold since the beginning of the year, it has risen by over 50%, with an increase of over 25% in just two months. Those who bought in early on have made a killing, and at the first sign of trouble, they naturally want to sell to lock in profits. This concentrated sell-off can easily trigger panic. Leveraged margin calls exacerbate volatility: The recent surge has attracted many investors to leverage their positions. If prices fall rapidly, these leveraged positions will be forced to close, amplifying the decline like dominoes.
Returning to the one-hour gold chart, US gold will continue to fluctuate between 4100 and 4020. The current trend is volatile and weak, so adopt a high-sell strategy! Go short on a dip to 4080, with an eye on the 4000 area below!
Specific Strategy
Sell gold below 4100, stop loss at 4110, target 4000.

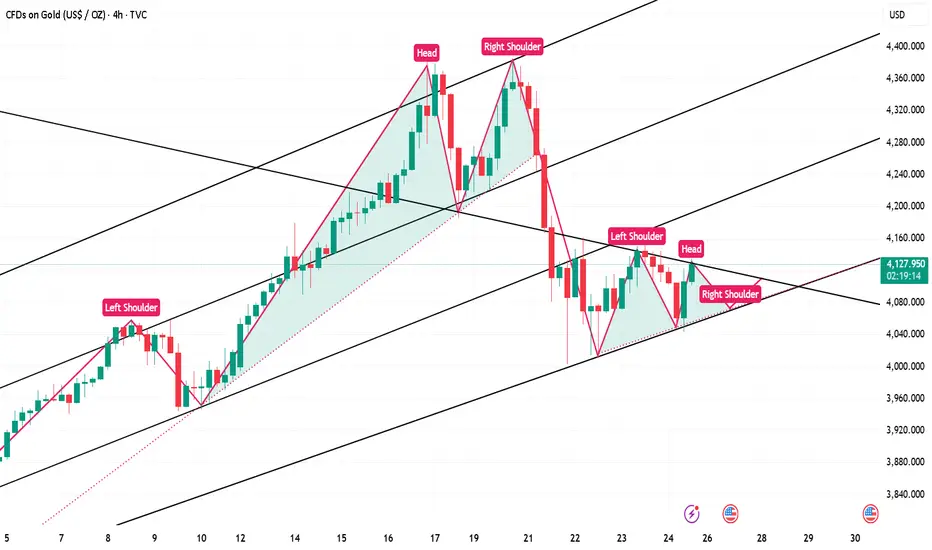
10.22 Gold rebounds and continues to be shortGold's 4-hour moving average has formed a death cross, signaling a downward bearish trend. Gold still has downward momentum. Despite today's rebound in the US market, it continued to decline rapidly. This suggests the bullish rally is weakening. Gold rebounded to around 4085 before turning downward. While gold remains under pressure at 4085, it's still a good time to continue shorting.
Gold has formed a short-term bearish double top, and the bullish rebound has failed to re-stabilize the neckline of the double top. Gold remains a bearish market, and rebounds continue to offer opportunities for short sellers.

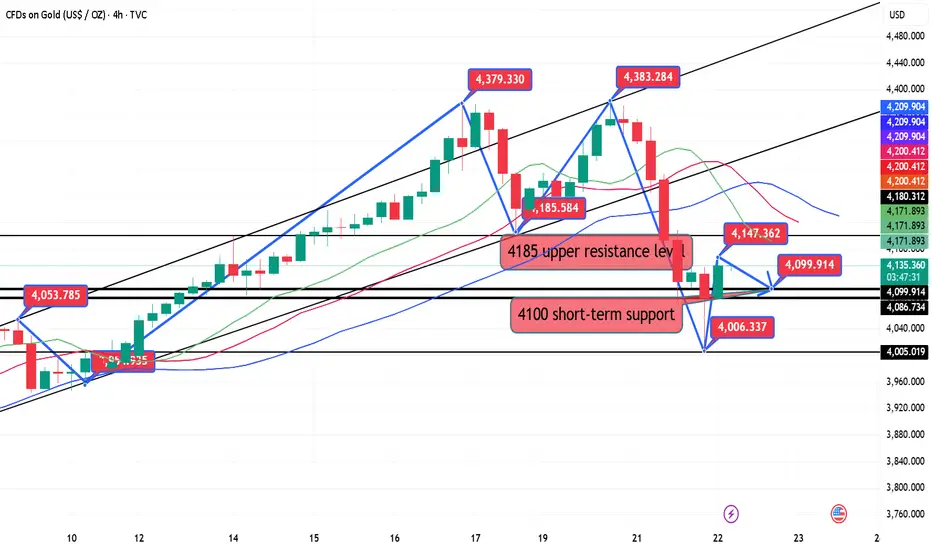
10.22 Gold continues to correctAfter forming a double top early Tuesday morning, gold has been experiencing resistance during Tuesday's Asian session, signaling a potential Waterloo. As of Wednesday's Asian session, gold hit a low of 4004 before rebounding above 4100, a bullish consolidation. Gold is currently trading in a range-bound environment. We continue to monitor the 4147-50 resistance level, which also marked the resistance level at midnight Tuesday. Gold prices retreated after hitting this resistance level several times last night. During the day, we will monitor the upward resistance level. If gold fails to break through, we will maintain a volatile trading strategy. We will prioritize shorting within this resistance level.
From the 4-hour chart, we are currently focusing on the 4147-4150 resistance level for the upside, while the -4085-4100 support level is expected to remain. If bulls fail to break through, gold will likely continue its range-bound correction. Trading strategies should prioritize trading within this range. In the intermediate range, we should be cautious about buying orders and wait patiently for key entry points. I'll provide detailed trading strategies during the trading session, so please stay tuned.
Gold Trading Strategy:
1. Short gold with a light position at 4147-4150, stop loss at 4156, target at 4085-4100. Hold if it breaks through!
2. Go long gold at 4085-4095, stop loss at 4078, target at 4145-50. Hold if it breaks through!
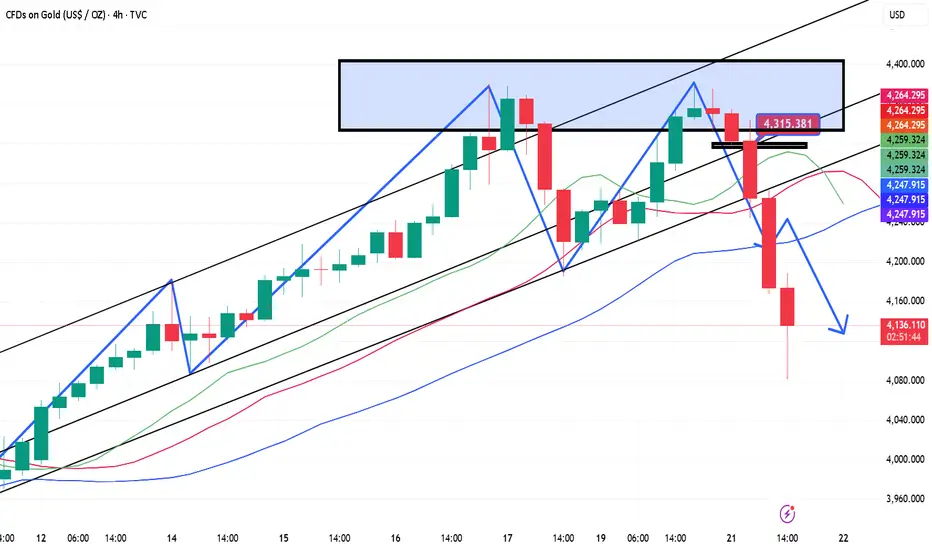
10.21 Gold Intraday Short-Term Trading GuideGold currently has a clear double top on its 4-hour chart, with Friday's low of 4186 acting as the neckline. If it falls below 4186, a double top will form, and the downward trend will accelerate. In the short term, it is likely to move further towards the 4100-4080 area. If it does not break through 4186, the market will rebound again.
10.21 Gold correction continues to riseTechnical Analysis
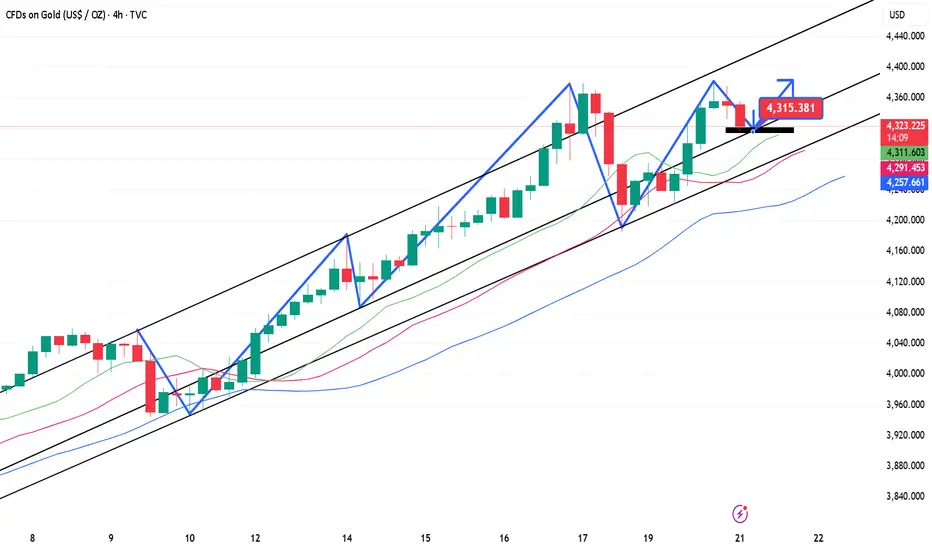
The 4-hour MACD formed a death cross with shrinking volume, converging and flattening, indicating current volatility. The 4-hour candlestick chart also closed at a high level with a small Yin-Yang candlestick. The question now remains whether the candlestick chart will rise directly or retrace to the middle line near 4292. A direct rise would not fall below the morning's low of 4332.
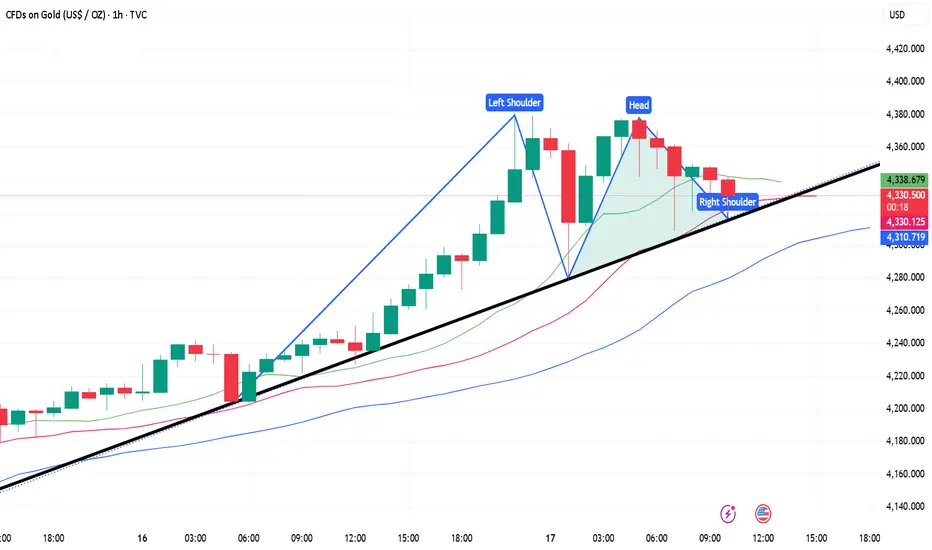
The hourly chart began to fluctuate and decline after trading sideways this morning. Currently, attention is focused on support near 4332. The hourly MACD formed a golden cross with shrinking volume, and the STO indicator corrected downward, indicating a potential decline in the hourly chart. Current support on the hourly chart lies around 4332-4327 and 4302.
In summary:
The daily chart suggests today's decline is not over, and will likely reach at least 4300. The question now remains whether the 4-hour chart will fluctuate at a high level or rise directly. A direct rise would likely lead to a continued rise to around 4420, while consolidation at a high level would likely lead to a decline. Therefore, a short position around 4372-4377 is feasible. As for long orders, they need to be placed near 4267-4275, and the first long order can be placed near 4296-97.
Strategy:
Short near 4368-70, defend 4382, target 4335-4300-4270
Long near 4296-97 below, defend 4290, target 4330
Long near 4268-72 intraday, defend 4262, target 4300-4330-4370, etc.
Breaking above 4382 will directly lead to the 4410-4420-4480 line, so if it breaks above 4382 and then falls back to 4370, go long.
Like
10.17 Gold Short-Term Operation Technical Guide!!!Recently, as the expectation of the Federal Reserve's interest rate cut has become more and more intense, and there is an expectation of an increase, the loose atmosphere, coupled with the expectation of inflation and the impact of the economic and trade turmoil, gold has once again become the darling of the market. Every day, it witnesses new highs in history, and the trend has become more and more crazy. There is no top in sight, and it is also impossible to say when a dive will come. Today, the Asian session hit a high near 4378 and then fell back quickly to touch around 4278, a range of US$100, and then quickly rebounded to above 4370 again. Subsequently, the European session jumped back and forth. Today, Friday, we need to be wary of the possible profit-taking trend in the market. In terms of operation, the rebound depends on shorting at 4360/70, and pay attention to the gains and losses of 4300. If it falls below 4300, we will see adjustments. Otherwise, we will continue to see bullish fluctuations if it falls back.
Trap Alert: Gold’s Pullback Could Fuel the Next Bounce!Gold continues to retreat in the short term, currently testing the strength of support at 4300. From the current technical perspective, although gold has repeatedly come under pressure at the 4370-4380 area, forming a multiple top structure in the short term, limiting upside potential in the short term, as gold continues to decline, the current resistance area has shifted down to 4235-4245.
Although gold is retreating under pressure, the overall bullish trend remains strong until it breaks below this key area. The current support structure after the top-bottom conversion lies in the 4290-4280 area. If gold cannot fall below this area during the pullback, then gold still has the potential to rebound to the 4230-4240 area. Therefore, even if we see gold prices continue to retreat, we should not rush to short gold during this pullback.
Instead, consider short-term trading:
We can continue to try to go long on gold with the 4290-4280 area as support. Of course, for short-term trading, the rebound target can be aimed at the 4320-4330 area!

Relentless Rally:Gold Won’t Rest Until 4500!?The 4300 series chapter has begun as expected, with gold continuing its strong upward trend, currently reaching a high near 4381. However, it is clear that after encountering resistance in the 4370-4380 area three times, gold has shown clear signs of a pullback. This could lead to the formation of a triple top structure in the short term, suppressing gold prices in the short term.
However, relatively speaking, as gold continues to rise, testing the 4280 area during the pullback before rebounding again, technical support has shifted to the 4320-4310 area. Furthermore, the validation of the pullback and the current strong upward trend will strengthen the support in this area to a certain extent, thus supporting gold's rebound.
Therefore, for the current short-term trade:
1. First, try to continue shorting gold with resistance at 4370-4380, targeting a pullback to the 4350-4340 area.
2. Once gold retraces to the 4320-4310 area, consider going long on gold, targeting the 4340-4350 area.
