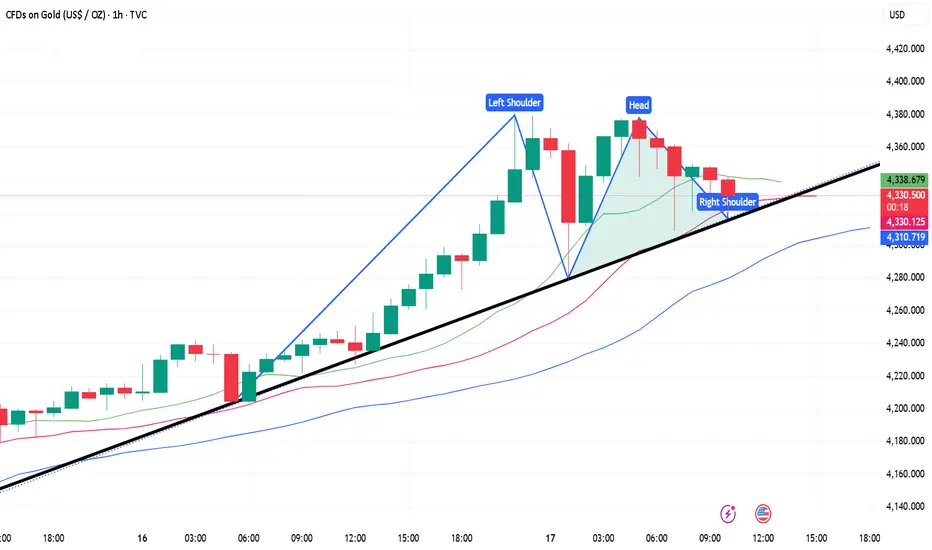
10.17 Gold Short-Term Operation Technical Guide!!!Recently, as the expectation of the Federal Reserve's interest rate cut has become more and more intense, and there is an expectation of an increase, the loose atmosphere, coupled with the expectation of inflation and the impact of the economic and trade turmoil, gold has once again become the darling of the market. Every day, it witnesses new highs in history, and the trend has become more and more crazy. There is no top in sight, and it is also impossible to say when a dive will come. Today, the Asian session hit a high near 4378 and then fell back quickly to touch around 4278, a range of US$100, and then quickly rebounded to above 4370 again. Subsequently, the European session jumped back and forth. Today, Friday, we need to be wary of the possible profit-taking trend in the market. In terms of operation, the rebound depends on shorting at 4360/70, and pay attention to the gains and losses of 4300. If it falls below 4300, we will see adjustments. Otherwise, we will continue to see bullish fluctuations if it falls back.
Goldtrader
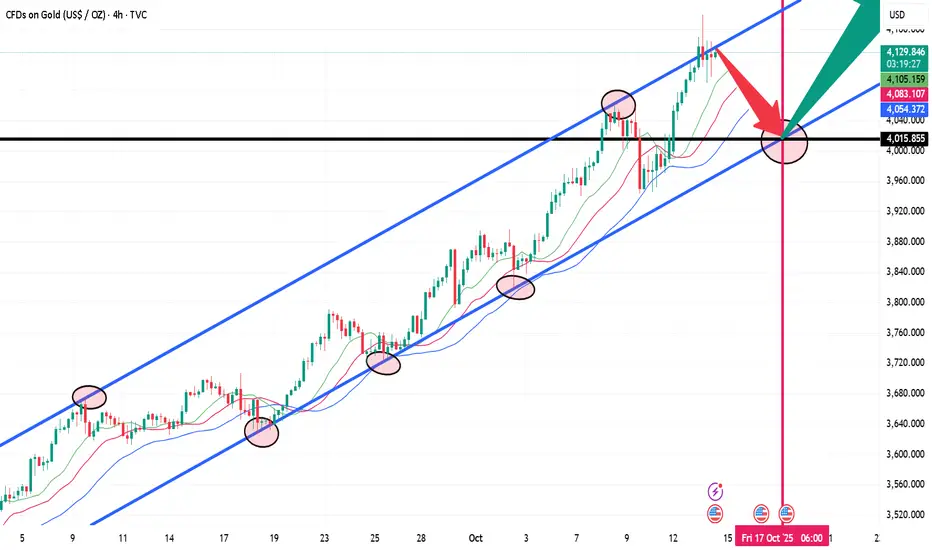
Gold traders - White House to speak on China shortlyGold’s impressive rally has been powered by a mix of rate-cut expectations, political risk, central bank buying, and dollar weakness.
Gold traders’ focus this week has been on the escalating U.S.–China trade tensions though.
Markets are standing by for a statement from the White House, expected within the hour.
We’ll post updates here once the White House statement is released and markets begin to react.

Gold breaks $4,100 as JPMorgan’s Dimon hints at $10K potentialJP Morgan CEO Jamie Dimon , speaking at Fortune’s Most Powerful Women conference in Washington, said there is “some logic” in holding gold even at its current record high price. He acknowledged that in the current macro environment, gold “could easily go to $5,000 or $10,000 .”
Gold reached record highs above 4,100 per ounce the past week. Dimon also cautioned that asset valuations appear “kind of high across almost everything at this point,”.

10.14Gold bulls continue to exert their strength!!!Gold is currently stabilizing after a broad range-bound consolidation on the 4-hour chart. It experienced an unexpected intraday plunge, but the momentum has been minimal. A rapid intraday rise followed by a sustained decline could present an opportunity for a short position. The price has rebounded after retracing to previous support levels, and the K-line charts are still trading above the short-term moving average, suggesting a relatively strong trend in the short term. There are currently no significant technical patterns on the hourly chart. On the smaller timeframes, pressure is building on the short-term moving average, maintaining a weak trend. There may be some room for correction in the short term. Focus on the support level around 4005 in the short term.
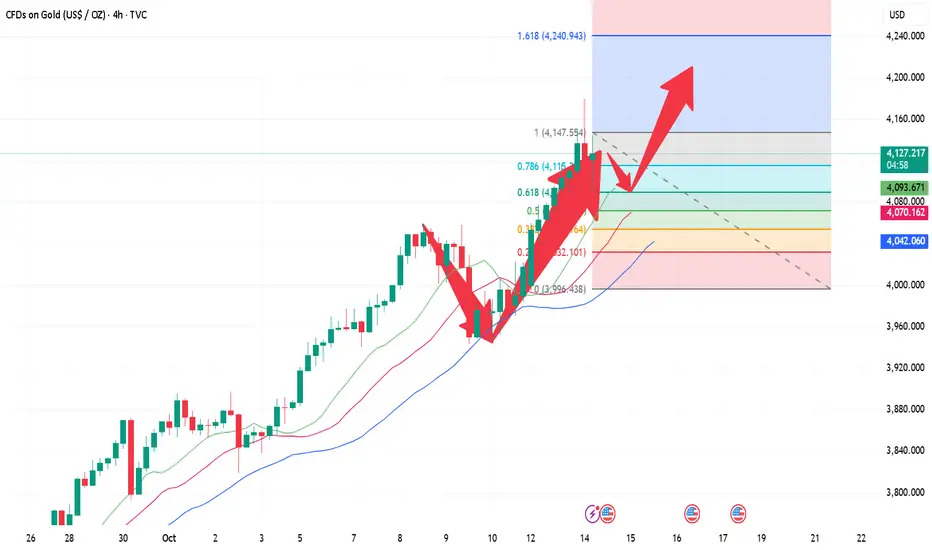
10.14 Tariffs and interest rate cut expectations resonate!Judging from the current 4-hour chart:
4100 is essentially the current hurdle for gold.
It's also the most important support level today.
Gold opened today in the 4100-4110 range. Although it recently retreated to around 4090, the real-world price still closed above 4110.
If we analyze the trend from last week's low of 3950 to the current 4180 level, we can see that the 618 support level is precisely around 4090.
4090 also happens to be the low point of the recent retracement.
According to wave theory, if the retracement does not exceed 618, new highs are inevitable. If it breaks through 4180 again, the next target may be around 4230.
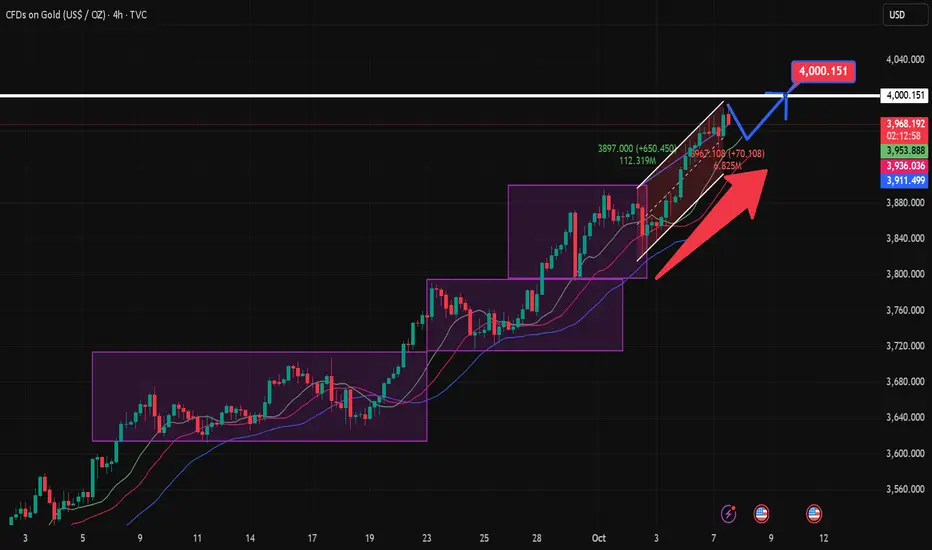
Gold will continue to rise at the end of the week!!!Gold is currently consolidating at a high level on the daily chart, nearly forming an engulfing pattern at a high level, making today's daily close crucial. On the 4-hour chart, prices are currently fluctuating at a low level, finding support around 3950. On the hourly chart, after continuous fluctuations, the technical pattern is gradually adjusting. The short-term moving average is gradually diverging upward, and the K-line chart is slowly crossing the short-term moving average. The short-term trend is gradually strengthening, suggesting further upside potential. Keep an eye on the resistance zone around 4010.
Trade Recommendation: Buy around 3975-6, with a stop-loss at 3966.
GOLD: Sell Limit — a sell position on gold in T15 with R/R: 1/4Hello guys,
This is a sell limit on gold with a risk/reward ratio of 1:4. If the market doesn’t open with an unwanted big gap due to news, you can enter the position.
Once reward level 1 is reached, you can move to risk-free. The maximum risk on this trade is 1% of the account.

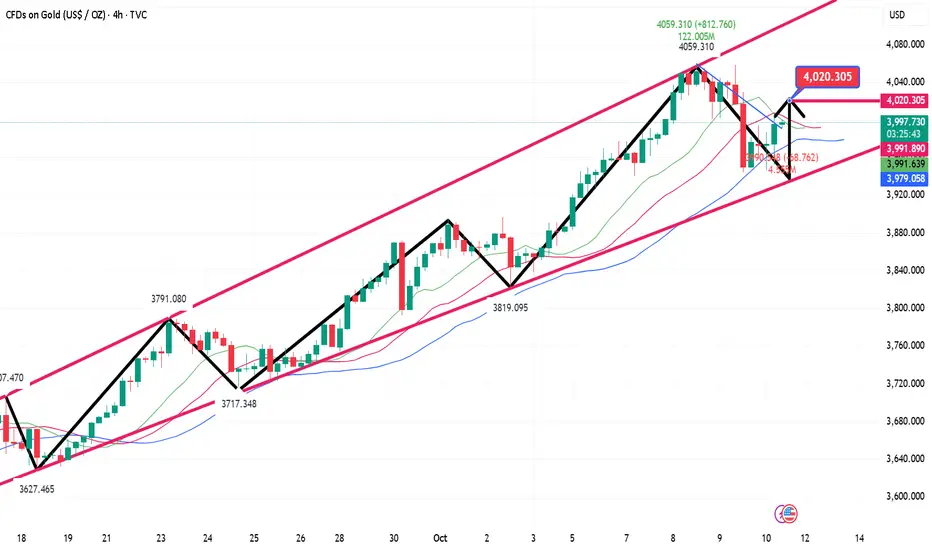
10.9 Gold Short-term Intraday Operation Guide!!!Technical Analysis:
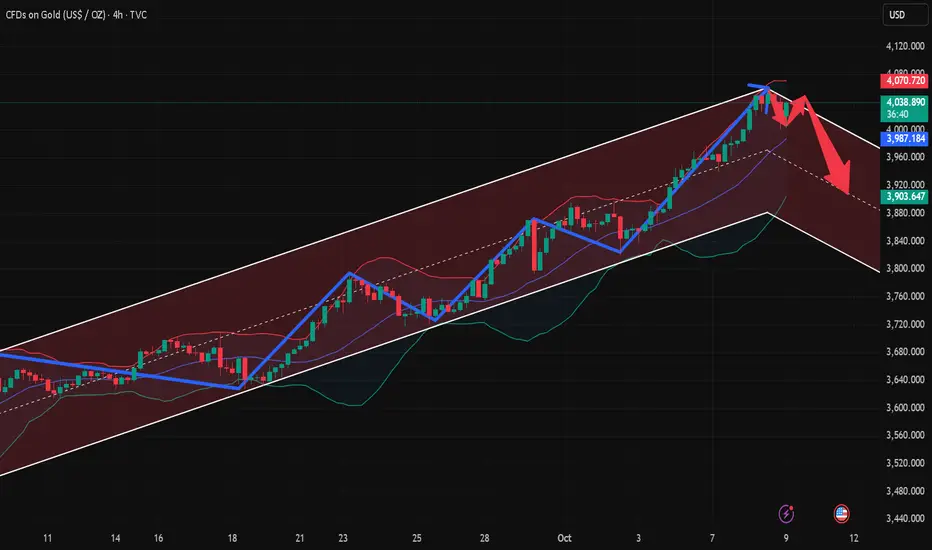
The 4-hour chart shows support at the middle line and near the MA30 moving average, corresponding to 3986 and 3947, respectively. The Bollinger Bands have also begun to narrow, indicating a volatile, compressed, and retest pattern in the 4-hour chart. Focus is currently on the upward pressure of 4032, near the MA5 moving average.
The 3-hour chart saw a rapid drop to 4001 this morning before bottoming out near 4008 and rebounding to 4036. The MACD formed a dead cross with high volume, and the STO indicator is trading at a low level, indicating weak 4-hour volatility. The high point of the morning rebound, the middle line of the hourly chart, has become the current resistance point at 4036. Meanwhile, support between 3999 and 4000 is a key focus today.
On the daily chart, focus on yesterday's highs and lows, 4059, and 3984. For the daily chart to rise, it must not fall below yesterday's lows but must break above yesterday's highs. However, considering the current volatile decline in the 4-hour chart, it is obvious that it will be difficult to go up in the morning session, so 4032 and 4050-59 become today's shorting points; and for the time being, we will focus on the morning low of 4001 and yesterday's low of 3984.
Gold is rising as expected, with the US market eyeing 4000!!!After gold retreated to around 3940, it began to rally. The strategy for the future remains to buy on dips. Short-term long positions near 3942 can be reduced, with a target of 3980 still in sight. Be mindful of the risks. Short-term investors can consider buying around 3954, with a stop-loss at 3946, and targeting a range between 3980 and 4000. Be mindful of the risks.
October 7th US Gold Trading: For those holding positions near 3942, reduce positions and hold with a profit and loss at 3946. Target resistance near 3980, and a breakout to 4000.
Short-term investors can consider buying further near 3954, with a stop-loss at 3946 and a profit target of 3980-4000. Be mindful of the risks.
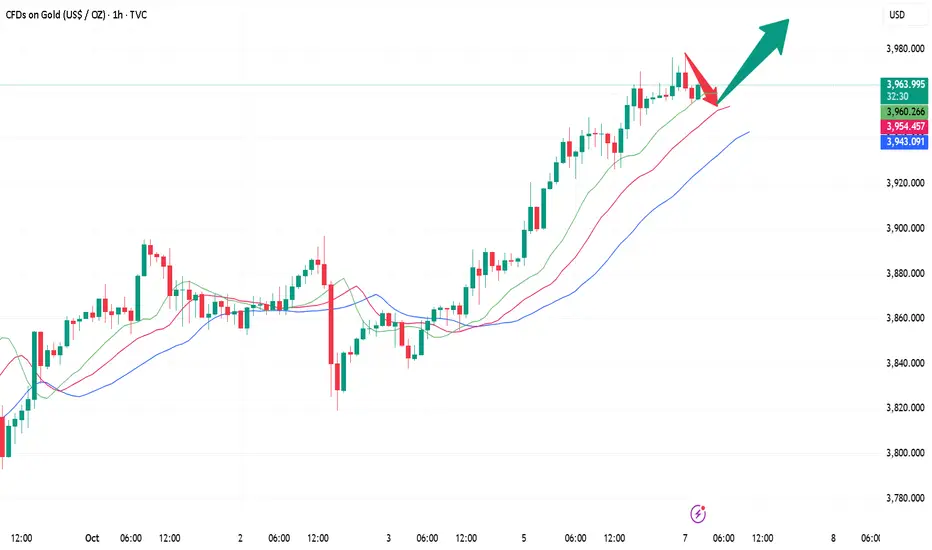
10.7 Gold Intraday Short-Term Operation Guide!!!Gold typically enters a correction phase on Tuesday after a strong rally on Monday. Maintain a bullish outlook for the day, with the primary support area being the 3955-60 range (which encompasses the early morning low, opening price, and high trading volume). Bulls are expected to mount a counterattack here. Today's market will not simply replicate Monday's unilateral surge, but will likely exhibit a pattern of "high-level fluctuations, false breakouts, and subsequent declines, followed by a test of the bottom and subsequent upward movement." Trading strategies should be abandoned in favor of buying at the bottom of the market fluctuations.
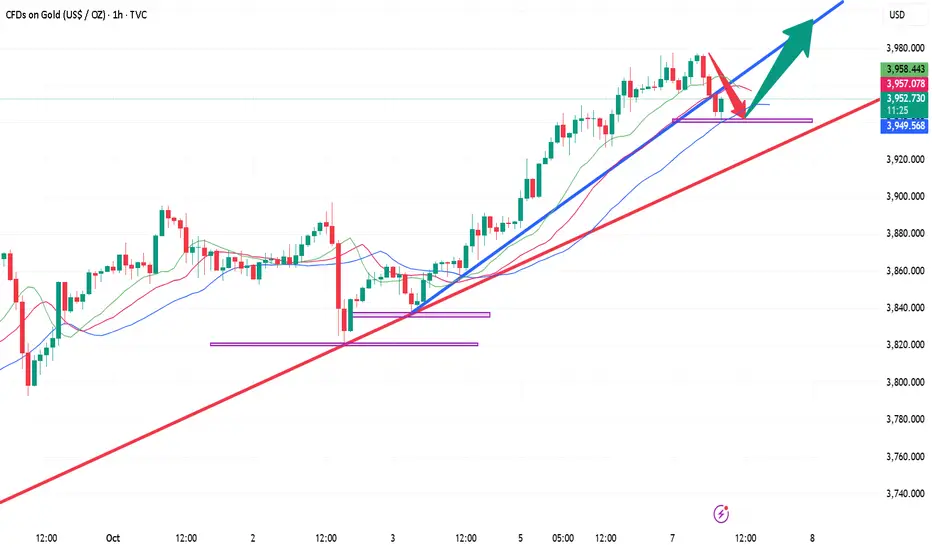
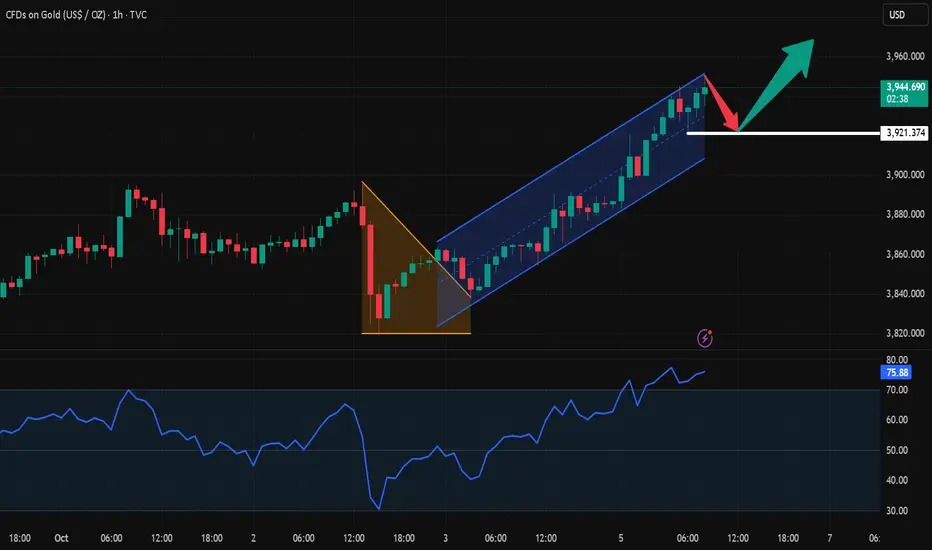
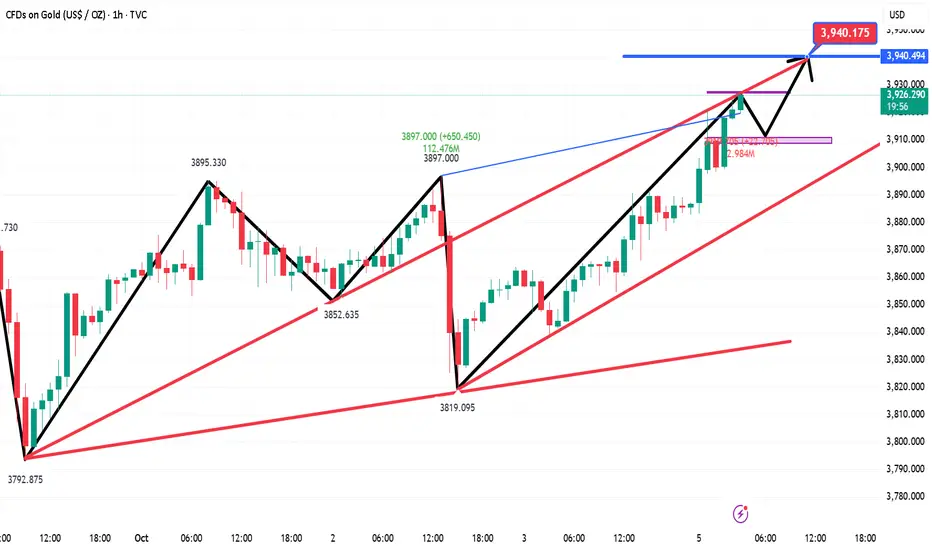
10.7 Gold has no ceiling!!!The one-hour pattern of gold, the golden cross of the moving average continues to radiate upward, maintaining strong bullish momentum. Pay attention to the short-term support below 3930-3920, which was the springboard for gold to accelerate yesterday. The upper resistance level should focus on the 3980 line. Every time the gold price reaches a new high, it will fall back to accumulate power. Just remember not to chase highs. For intraday operations, we can continue to maintain low-long participation!
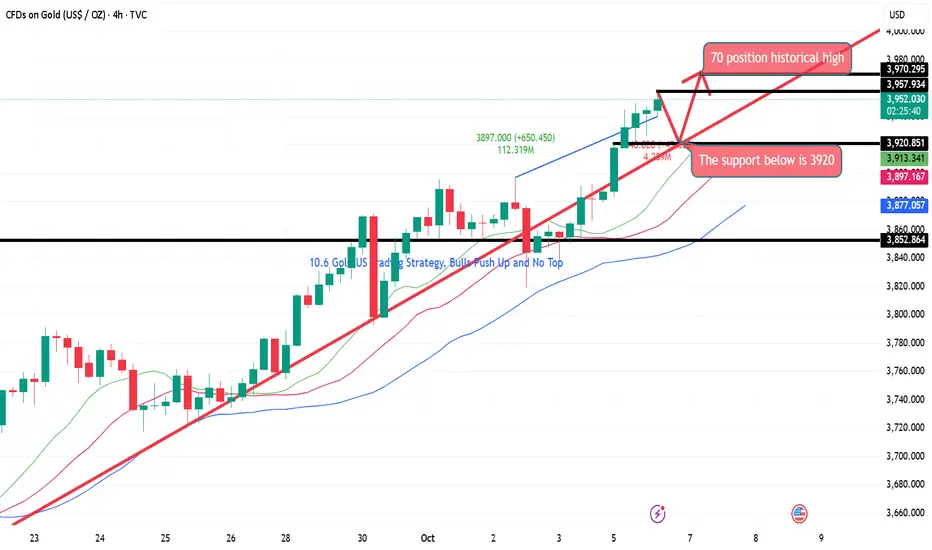
10.6 Gold US Trading Strategy, Bulls Push Up and No TopLooking at the 4-hour market trend, we are watching for short-term support at 3920, with a focus on the 3895-3900 support level. The bulls are rising strongly and there is no end in sight. Trading strategies should focus on buying on pullbacks. For intermediate positions, we should be cautious in chasing orders and patiently wait for key entry points. I will provide detailed trading strategies during the trading session, so please pay attention.
10.6 Gold's callback is small and it may continue to riseAfter breaking through a previous resistance zone on the 4-hour chart, gold is continuing its upward trend along its short-term moving average. Intraday pullbacks have been mild and sustained, and there are still no signs of a peak in the short term. On the hourly chart, after a surge, gold is maintaining a high-level correction, but recent high-level corrections have ultimately evolved into secondary gains, and today's pullbacks were not significant. On the short-term chart, the candlestick chart is gradually coming under pressure, maintaining a weak trend along the short-term moving average. Some short-term correction is possible. If the correction in the US market is not significant, it may even rebound to the current price after a minor correction. Further upward movement is expected after the open!!!
10.6 Gold European Short-term Technical Analysis!!!Gold has been rising for several consecutive weeks, breaking through the upper Bollinger Band on the weekly chart, and the RSI has reached the overbought zone, suggesting further upward movement. Friday saw a small bullish close, and today's Asian session saw further gains. The daily RSI has again reached the overbought zone, and the 4-hour chart is above the upward trend line, breaking through the ascending triangle.
Trade Recommendation: BUY: 3920 Target: 3940 3950
10.6 Gold falls back and continues to go longGold prices are currently moving out of a narrow range of highs on the daily chart. The K-line chart continues to maintain a relatively stable upward trend along the short-term moving average. Watch for any pullbacks on the daily chart to confirm a secondary upward trend. Focus on the support zone around 3900 in the short term. On the 4-hour chart, the price broke through the previous resistance zone, and the short-term moving average began to diverge upward, indicating a relatively strong short-term trend. On the hourly chart, the intraday pullbacks were neither strong nor prolonged, and the K-line chart continues to maintain a relatively strong trend along the short-term moving average. Some divergence is showing on the short-term chart, so watch for short-term adjustments.
Trading Strategy:
BUY: 3910 TP1:3925 TP2:3940
SELL: 3940 TP1:3910 TP2:3900
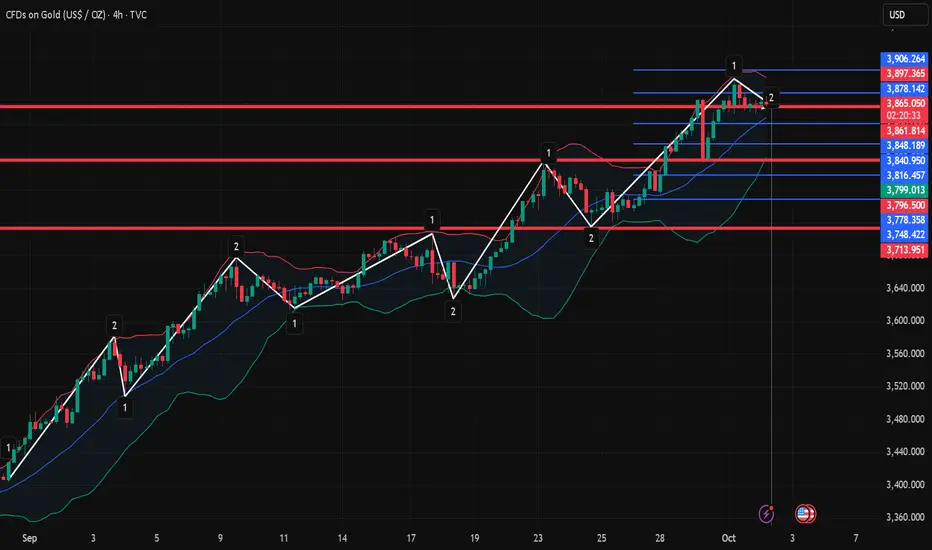
10.2 Gold fluctuates at a high level!!!Market Analysis:
① The daily MACD is forming a golden cross at a high level with high volume and volatility, and the STO indicator is overbought, indicating a high-priced trend. A candlestick chart with a hanging line after consecutive long-term bullish candlesticks indicates high-priced volatility, with the risk of a pullback. This is unless another long-term bullish candlestick pattern breaks yesterday's hanging line.
Therefore, today's upside focus is on yesterday's high of 3895. A break above this level could push the price towards the 4000 mark.
Current daily support lies near the MA5 and MA10 moving averages, corresponding to support levels of 3837 and 3787. However, the MA10 moving average has no chance of success, so the main focus for the day is support at 3837. This means the intraday range remains between 3837 and 3895.
② The 4-hour MACD is forming a high-level death cross, and the STO indicator's fast line is showing an upward curve, indicating a volatile trend in the 4-hour chart. Short-term support in the 4-hour chart lies near the middle line at 3844, but this is expected to gradually move up to around 3850 over time. We observe that the three Bollinger Bands on the 4-hour chart are currently narrowing, indicating range-bound fluctuations. The upper band is currently holding pressure at 3901, but it will likely move down to around 3890-95 over time.
③ On the hourly chart, the three Bollinger Bands are also narrowing, with the lower band and the MA60 moving average currently supporting the 3852-54 level. If the price falls below 3852, a downward trend is likely.
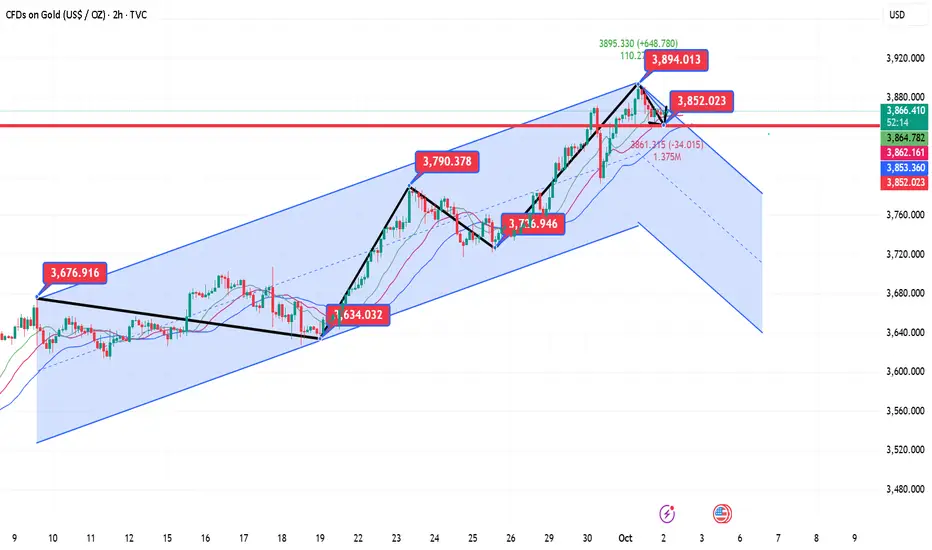
9.2 Gold Short-Term Technical Analysis Guide!!!Gold prices naturally retreated after hitting a new high on Wednesday, but the candlestick chart remains oscillating upward (with higher lows). If prices fall below the midline of the trend channel at 3869, the market is likely to shift towards the 3850-35 range. Currently, gold prices are showing this trend. Conservative investors can consider entering the market based on whether the 3834/35 support levels are broken (a rebound could reach as high as 50; if it falls below, the market is bearish and could reach 3810).
Reference support levels: 3849, 3834, and 3794.
Reference resistance levels: 3880, 3903, and 3917.
Can gold smash through $4,000 this month?Gold is edging closer to the psychological $4,000 mark after reaching as high as $3,890 per ounce.
The rally has been fuelled by two main drivers: an unexpected drop in US private employment and the start of the federal government shutdown. With the shutdown delaying key releases such as this week’s nonfarm payrolls and this month’s CPI, the Federal Reserve may be forced to decide policy at its October 29 meeting without critical data, increasing the chances they leave rates unchanged.
Technically, gold’s trend remains constructive. Strong demand zones potentially sit near $3,760 and $3,720, while the next key resistance is the $4,000 psychological level. A sustained daily close above $4,000 would open the way toward Fibonacci extension targets at $4,025 and $4,101. On the downside, a break below $3,760 could trigger a deeper pullback toward $3,680.

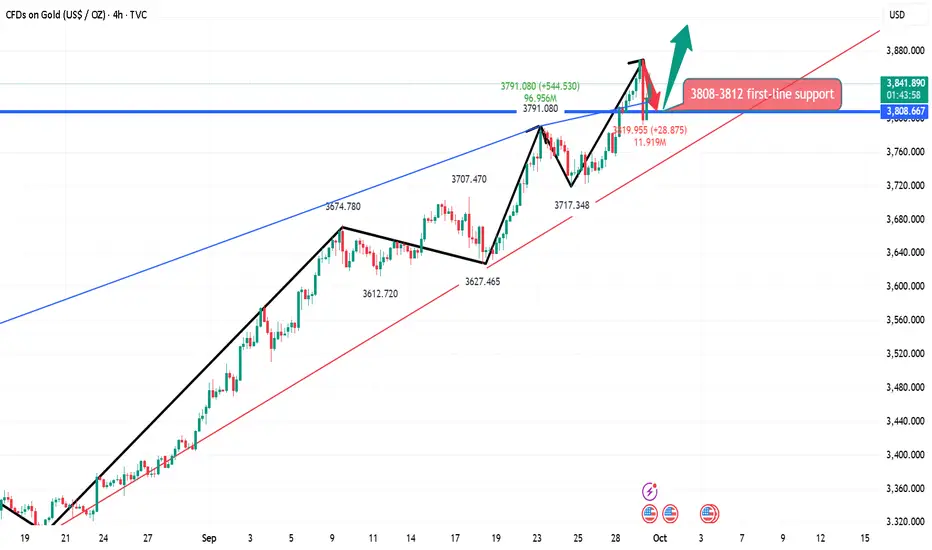
10.1 Gold US Trading StrategyJudging from the 4-hour market trend, the bulls closed with a positive sign and fluctuated at a high level. The short-term support below is 3814-25, and the important support is 3800-08. The bulls are rising strongly and there is no top. The operation is mainly to go long on pullbacks. In the middle position, watch more and do less, be cautious in chasing orders, and wait patiently for key points to enter the market.
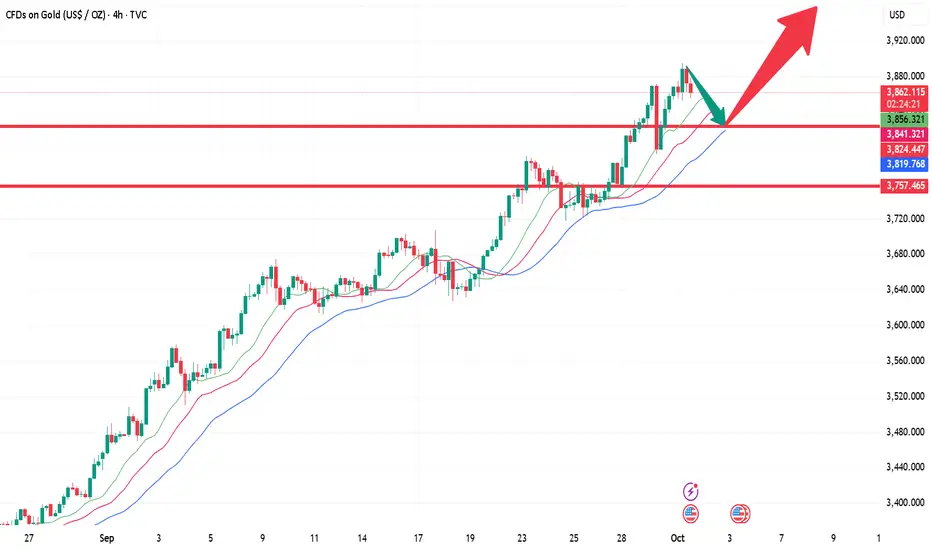
Gold fell as expected, and subsequent pullbacks led to long posiBased on the 4-hour analysis, support is focused on the 3800-95 level. The bulls are rising strongly and there's no end in sight. Trading strategies should primarily focus on buying on pullbacks. In the intermediate range, be cautious and wait for key entry points. I'll provide detailed trading strategies during the trading session, so please stay tuned.
Gold Trading Strategies:
1. Buy gold at the 3800-05 level, and add to your long position on pullbacks to the 3785-90 level. Set a stop loss at 3778 and target the 3845-3850 level.
Perfectly grasp the golden trading opportunity?Last Thursday and Friday, gold continued its range-sweeping pattern as expected. The market fluctuated too quickly, and hesitation basically meant missing out. However, frequent trading can also be a burden. We ambushed both the bulls and the bears in advance and reaped good profits.
For today's market, first of all, the gold daily chart combination is a typical "big sun front resistance line" pattern, which is an obvious lure to buy. As long as it does not break through the previous high of 3707, then today we tend to continue to be bearish. From a technical point of view, the high-level continuous negative adjustment state is obvious, and the rebound momentum is gradually weakening. The long upper shadow line of the daily line shows that the upper selling pressure is heavy, and the short-term bullish power is insufficient. The upper track of the Bollinger band in the 4-hour cycle is repeatedly under pressure, the MACD momentum column continues to shrink, and the fast and slow lines show signs of forming a dead cross, indicating that the rise is weak.
On the news front, the Fed's expected interest rate cut has been realized, and the realization of positive news has weakened the momentum for gold to rise further. The subsequent market focus will be on "whether there will be another interest rate cut and the extent of the cut." Uncertainty makes funds more inclined to take profits at high levels. At the same time, the US dollar index stabilized and rebounded, and US Treasury yields stopped falling, which continued to suppress gold.
At the level of funds and market sentiment, long positions are already at a high level, with limited room for growth. Institutions are more likely to overvalue and undervalue at high levels, and it is difficult for gold to maintain a sustained upward trend under the volatile pattern.
Therefore, in terms of operation, it is recommended to look for short opportunities below the previous high of 3707 today, especially above 3685, where short orders can be arranged in batches, positions can be strictly controlled, and stop-loss space can be enlarged to cope with fluctuations. The short-term target will first look at the 3670-3660 area. If it breaks down strongly, it will further look down to the 3650-3635 area.

GOLD (XAUUSD): Support & Resistance Analysis for Next Week
Here is my latest structure analysis for Gold.
Resistance 1: 3641 - 3674 area
Resistance 2: 3696 - 3704 area
Support 1: 3612 - 3626 area
Support 2: 3559 - 3580 area
Support 3: 3510 - 3521 area
Support 4: 3489 - 3500 area
Consider these structures for pullback/breakout trading.
❤️Please, support my work with like, thank you!❤️
I am part of Trade Nation's Influencer program and receive a monthly fee for using their TradingView charts in my analysis.

XAUUSD3 week continue long on gold after breaking 3500 , it took 3 month around , are we looking for 4000 coming within this month? is gold short or keep up trend.? i am sure everyone have this question in mind.
i have drawed line to understand what could happend as it is an analysis base on education, every price need to be confirmed after breakout and retested with rejection,,, and it take time to predict the direction of the market.
i had a great 3 week. how about you leave your thoughts in the comment.
