5 Must-Know Tips for Trading Gold. XAUUSD Must Know Secrets
After more than 9 years of Gold trading, I decided to reveal 5 essential trading tips , that will save you a lot of money, time and effort.
Of course, these trading recommendations won't make you rich, but they will certainly help you to avoid a lot of losing trades.
Whether you are new to Gold trading or an experienced trader, these insights will dramatically improve your trading.
Don't trade gold with a small account
I always repeat to my students that in gold trading, the risk per trade should not exceed 1% of a trading account.
It means that if your trades close with stop loss, you should lose maximum 1% of your deposit.
For the majority of the day trading and swing strategies, you will require at least 2000$ deposit to risk 1% per trade. Trading with a smaller account size, it will be challenging to follow this risk management principle of not exceeding 1%
Here is a day trade on Gold.
With a stop loss of 619 pips and a trading account of 10000$,
a lot size for this trade will be 0.02.
If the trade closes on stop loss, total risk will be 100$ or 1% of a trading account.
With a 100$ account, trading with a minimal lot 0.01, your potential risk will be 50$ or half of your trading account.
Check spreads
Spread may dramatically fluctuate on Gold.
High spreads can make it difficult for day traders to catch small price movements, reducing the profit potential of their trades.
Wide spreads can lead to slippage , where day traders may end up buying at a higher price and selling at a lower price than expected, increasing the risk of losses.
Gold has the lowest spreads during London and New York sessions,
while trading the Asian session is not recommended.
Personally, I don't trade Gold if the spread exceeds 100 pips.
In the picture above, you can see a current spread on Gold.
It is 30 pips. It is a relatively low spread, so we can trade.
Don't trade on US holidays
When US banks are closed, liquidity drops substantially on Gold.
It leads to increased spreads and higher probabilities of manipulations,
reduced volatility and very slow market.
For that reason, it is better not to trade Gold during US holidays.
You can easily find the calendar of US banking holidays on Google.
Simply take a break during these trading days.
Don't trade ahead of important US news
US news may dramatically affect Gold prices.
Such events as FOMC or FED Interest rate decision may trigger a high volatility and very impulsive movements.
My recommendations to you is to stay away from trading Gold one hour ahead of the important news releases.
You can find important US news in the economic calendar .
Just sort out the calendar in a way that it would display only significant news and pay attention to them.
Above, you can see the important US news for the coming days in the economic calendar.
Do not open multiple orders
Here is what many Gold traders do wrong:
once they place an order, instead of patiently waiting for a stop loss or take profit being reached, they start opening more orders.
Please, open one single trade per your prediction.
Open a new trade if only you see a new trading setup or your initial trade is already risk-free with a stop loss move to entry level.
Here is the example, a newbie trader decides to buy Gold and opens a long positions.
The market moves in the projected direction, and a trader opens one more trade.
The one can open even dozens of positions like that.
However, the problem is that the market can always suddenly reverse and all these trades will be closed in a loss.
It can lead to a substantial account drawdown.
Open a one single trading position instead.
I truly believe that these trading tips will help you improve your gold trading. Carefully embed these rules in your trading plan and watch how your trading performance improves.
❤️Please, support my work with like, thank you!❤️
I am part of Trade Nation's Influencer program and receive a monthly fee for using their TradingView charts in my analysis.
Goldtradingbasics

How to Analyze Daily Time Frame on Gold. 5 Important Things
There are 5 important things that you should analyze on Gold on a daily time frame to accurately predict long term, midterm and short term movements.
In this article, I will share with you a step-by-step guide for daily time frame analysis that you can apply on Gold or any other financial instrument.
1 - Identify the market trend
When you analyze a daily time frame, you should identify long term, midterm and short term market trends.
Long-term trend is based on the analysis of one year long price action.
In the example above, Gold is trading in a long term bullish trend because the price keeps setting new higher high and new higher lows during the year.
Midterm trend is based on the analysis of a price action for the last 4–5 months.
Above, we can clearly see that a mid-term trend is bullish because again, the price sets new higher highs and higher lows over time.
Short-term trend is based on the analysis of price movements for the last 2 months.
Short-term price action is also bullish on Gold, with a clear sequence of higher highs and higher lows.
According to the trend analysis, long-term, mid-term and short-term trends are bullish.
2 - Identify the directional bias
The directional bias defines a highly probable future direction on the market.
In our example, we can anticipate that Gold will keep growing among all the dimensions: long-term, mid-term and short-term.
3 - Execute structure analysis
Identify important historic horizontal and vertical structures.
That will be the points from where you should look for trading opportunities.
When you analyze key levels, identify the structures that are lying close to the current price levels.
Make sure that all the structures that you spotted were respected by the market in the past.
4 - Look for price action patterns
Price action patterns are the language of the market.
Proper identification of the patters will help you correctly understand the intentions of the market participants.
You can see that a bearish breakout of a rising channel triggered a correctional movement on the market.
Gold started to fall steadily within a bullish flag pattern and after it tested a key support, the price violated the resistance of the flag.
5 - Analyze candlesticks
Candlestick patterns can provide extra clues and confirmations.
You can see that the market formed multiple rejections from key support, an inside bar formation and bullish engulfing candle.
Violation of the inside bar to the upside with a strong bullish candle is an important bullish signal.
Combining trend analysis, structure analysis, price action and candlestick analysis, and you can make predictions and look for trading opportunities.
You can also make your analysis even more sophisticated, for example, analyzing fundamental analysis or applying technical indicators.
❤️Please, support my work with like, thank you!❤️
I am part of Trade Nation's Influencer program and receive a monthly fee for using their TradingView charts in my analysis.
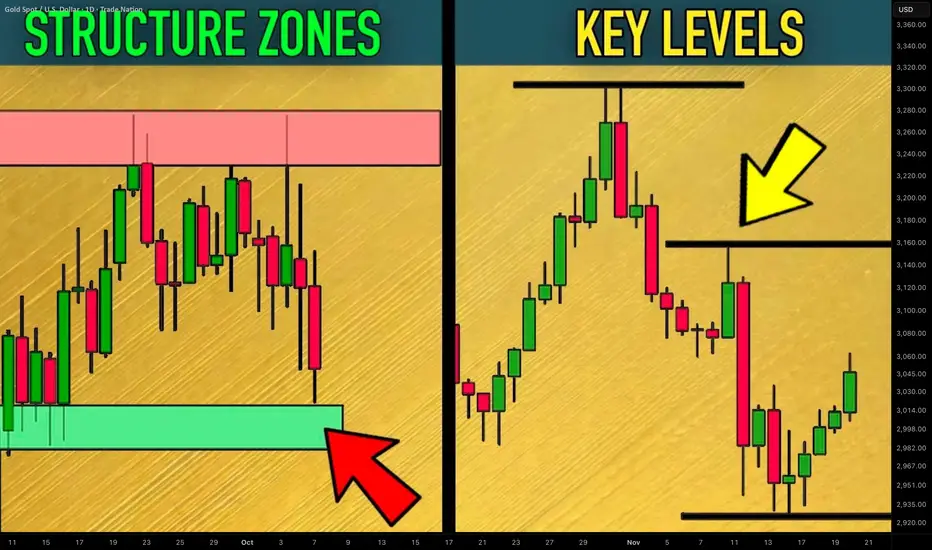
How to Find Key Levels and Support/Resistance Zones Gold XAUUSD
Key levels and support/resistance zones are 2 essential concepts for profitable trading Gold.
In this article, I will share with you a simple and a proven way to find levels and supply/demand clusters on XAUUSD chart.
I will provide a complete guide with examples.
Always start levels/zones analysis on Gold with key levels identification.
Simply put, a key level is a completion point of a strong bullish or bearish movement.
It is the highest high of a bullish wave and the lowest low of a bearish wave.
Let's take a price action on Gold for the last month and let's try to identify key levels.
Analyzing peeks and bottoms of significant price movements, I managed to quickly find a bunch of important key levels.
The ones that are below current spot prices will be called key support levels, while the ones that are above current prices will be called key resistance levels.
What many traders miss, analyzing key levels, is that every key level will always be a part of support/resistance zones.
Candle closes of highs and lows of important price movement will also be important levels.
I underlined all such levels on our Gold chart.
These levels and highs/lows of the impulses will compose supply and demand zones.
That is how these zones look.
The areas that are based on key supports will be called demand zones.
The areas that are based on key resistances will be called supply zones.
The logic is that a high volume of selling orders will be distributed within supply clusters.
Probabilities will be high that a bearish reaction will follow after a test of such a zone.
Demand zones will accumulate buying orders and buying activity.
With a high probability, Gold price will bounce from such zones.
Levels and zones analysis will provide you with a map for trading Gold.
Use that as a map that 95% of retail traders will not see.
It will help you find profitable trades.
❤️Please, support my work with like, thank you!❤️
I am part of Trade Nation's Influencer program and receive a monthly fee for using their TradingView charts in my analysis.
Time to Fade the Rally—Gold Shorts Aim for 3835–3825Driven by the market's risk aversion sentiment, gold continues to maintain its strong upward position and has now reached our long target area: 3850-3860 as expected. It is obvious that gold is still in a bull trend, but as gold prices have risen sharply, more and more high-level risks have accumulated. Therefore, it is actually very difficult to directly participate in gold long trading now.
But according to the current trend, it is not difficult to find that after each surge in gold, there is a trend of falling back and testing support. Therefore, even if gold is in an upward trend, there is still a need to retrace support locally, and the retracement range is relatively not small, and can reach a retracement space of $20-30, so there is enough profit space for short-term trading.
In addition, in the short term, gold is currently facing the influence of the trend channel resistance area of 3855-3865. The current upward momentum has converged and the willingness to rise has tended to weaken. Under the influence of the resistance in this area, gold may have a need to retreat in the short term.
So in the short term, we might first consider shorting gold with the 3855-3865 area as resistance, and first look at the target area of 3835-3825 area. Of course, to gamble on short-term retracement profits in an upward trend, you need to set up protection!

Gold Lures Bulls In — But Correction LoomsAfter the start of the Asian session, gold continued its upward momentum to around 3692. However, it is obvious that after touching this horizontal area, the upward momentum of gold has converged, and there are obvious signs of stagflation. Moreover, judging from the trading volume, the current trading volume is not enough to support the continued rise of gold. So I think gold may usher in a good wave of pullback at any time after the rise.
From a technical perspective, gold has formed a "double-needle bottoming" structure in combination with the areas near 3628 and 3632. However, since the correction near 3707, gold has shown a clear downward trend. Therefore, according to time and space, under normal circumstances, gold is still in an oscillating structure and may find it difficult to break through the resistance of the 3675-3680 area in a short period of time. But the fact is that on Friday, stimulated by the news, gold not only broke the volatile pattern that should have appeared, but also broke through the resistance of 3675-3680 in one fell swoop; when the time and space are not yet in place, the intention of gold's sharp rise may be to eliminate the short chips that have been recently arranged before gold really starts to pull back, and there is also suspicion of luring the bulls who follow the trend.
Based on space calculations, it is expected that the maximum rise in gold this time will not exceed the 3710-3715 area, and it may even start to pull back again before reaching this area. Therefore, we should not be excessively bullish on gold at this point. On the contrary, we can still short gold in batches above 3680, and the retracement target will first target the 3665-3655-3645 area.

Bull Fever Cools:The Market Still Owes Us a WaterfallAs I expected, the Fed cut interest rates by 25 basis points, and Powell did not show a clear dovish tone in his speech. Gold fell from 3707 to around 3646, with a drop of $610. Our short positions at 3685 and 3700 that we had ambushed overnight won as expected, and we successfully locked in a profit of 750 pips in the news market.
Although the Federal Reserve is inclined to take a hawkish approach to rate cuts, gold has rebounded from around 3646. Although it has performed relatively weakly, the downward momentum has slowed down and a unilateral downward trend has not formed. Overall, it is still in the high-level fluctuation range. So we can't rush to short gold at the moment. Because gold still has the possibility of rebounding back to the 3675-3685 area, and may even be expected to rebound back to the 3690-3700 area. After all, gold did not effectively fall below 3650 during the decline.
Although the decline in gold prices did not change the overall structure, it weakened the market's enthusiastic bullish sentiment in the short term, and the technical resistance also moved down to the 3675-3685 area, followed by the 3695-3705 resistance area. If gold rebounds to the resistance area, we can try to short gold, and the short-term retracement target is set in the 3655-3645 area. Once gold falls below this area, it is expected to continue the downward trend to the 3635-3625 area. Of course, it is not ruled out that gold will fluctuate widely in the 3690-3650 area.
Therefore, we can still make very good profits from the perspective of profit margin by shorting gold at the resistance areas of 3675-3685 .

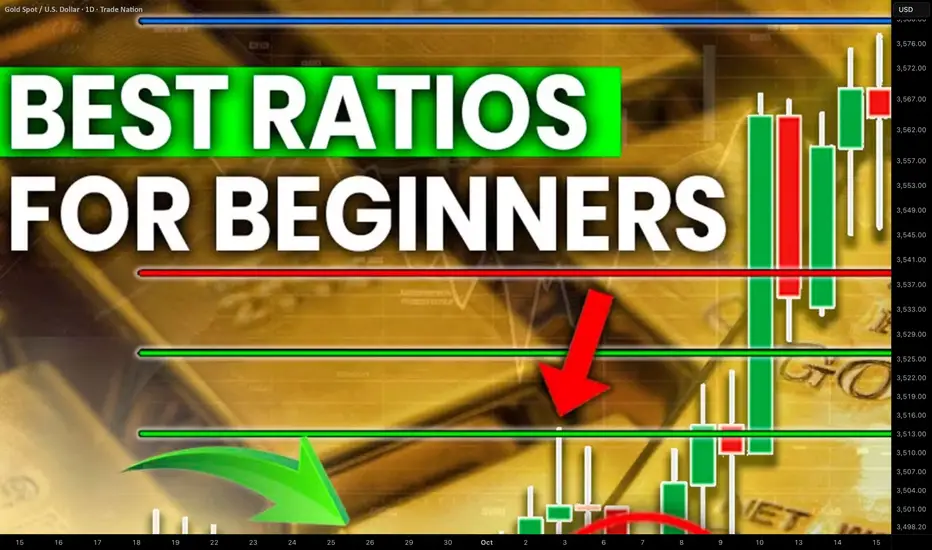
How to Use Fibonacci Levels in Gold Trading. Best Ratios For XAU
I will teach you a simple but efficient way of using Fibonacci levels for Gold analysis.
You will learn the strongest Fib.retracement levels and a proven strategy for XAUUSD trading.
First, let me show you the most powerful Fibonacci retracement levels that you should use for trading Gold.
The most significant ones are: 382, 50, 618, 786.
To use these Fib.Retracement levels properly, you will need to find the strongest 3 impulse legs.
Please, note that you can execute Fibonacci analysis of Gold on any time frame, for the sake of the example, we will do that on a daily.
Here are 3 impulses that I found.
I was simply trying to identify the price waves with the strongest impact. I underlined them from their lows to their highs.
We will draw Fibonacci Retracement levels based on these 3 movements.
We plot Fib.Retracement of a bullish impulse from its low to its high.
We plot Fib.Retracement of a bearish impulse from its high to its low.
That is how it looks.
After that we will need to find a confluence - zones or levels where Fib.Retracement levels of different impulses match .
Such zones will be significant liquidity clusters where market participants will place huge volumes of trading orders.
The first 2 confluence zones that I spotted on a Gold chart will be specific. They are based on 1 and 0 Fib.Retracement levels that match.
These 2 areas are both completion and starting points of our impulse legs.
The fact that significant price movements completed and started after tests of these zones indicates their significance .
Confluence zones 3/4/5/6 are based on a convergence of at least 2 Fib.Retracement levels of different impulses.
Probabilities will be high that these zones will attract the market liquidity.
After we found all confluence zones, I recommend removing Fibonacci levels from the chart to keep it clean .
That is how our complete Fib.Analysis will look.
From these zones, we will look for trading opportunities.
The areas that are above current price levels will be significant supply areas , and we will look for sell signals from them.
The zones that are below Gold spot price will be demand areas. Chances will be high that a strong buying reaction will follow after their test.
Confluence zones that we spotted on Gold chart provide unique perspective. Integrating them in your XAUUSD analysis, you will increase the accuracy of your predictions and trading decisions.
❤️Please, support my work with like, thank you!❤️
I am part of Trade Nation's Influencer program and receive a monthly fee for using their TradingView charts in my analysis.
Rally Before the Fed: A Trap or Treasure for Bears?Gold hit a new high again, and the current highest has reached around 3685. After gold consolidated at a high level for several trading days, the bulls launched a strong attack again, and it seems that there are signs of trying to hit 3700. However, the current gold market is at a critical node and cycle, so I do not advocate continuing to chase gold; on the contrary, I will choose to short gold at every high as the gold price rises!
Gold rose sharply as the Federal Reserve was about to announce its interest rate decision, and hit a new high again! Against the backdrop of interest rate cut expectations, it is easy to push market sentiment to a climax! When the market is caught in a long-term frenzy, it may also be an opportunity for large funds to quietly exit the market. Therefore, I think the purpose of gold's sharp rise before the Federal Reserve announced its interest rate decision is very clear. The first is to reserve room for decline for the news market in advance, and the second is to attract most retail investors in the market to take over. So I think the turning point of gold is coming soon!
So for short traders, I think this rise is not a risk, but an opportunity! Gold may collapse based on the phenomenon of "buying expectations and selling facts", so I think we need to short gold at its rallies before the Federal Reserve announces its interest rate decision. However, I would like to point out that when shorting gold in batches, we must control the number of lots traded to reduce trading risk!
For short-term trading, I believe we can short gold in batches above 3680, with a short-term retracement target of 3660-3650. If gold falls below this area, it may even continue to retrace to the current rising point of 3635-3625.

Best Lot Size for Gold Trading (XAUUSD) Explained
If you trade Gold with fix lot, I prepared for you a simple manual how to calculate the best lot size for your XAUUSD trading account.
Step 1
Find at least the last 10 trades that you took on Gold.
Step 2
Measure stop losses of all these trades in pips
Step 3
Find the trade with the biggest stop loss
In our example, the biggest stop loss is 680 pips
Step 4
Open position size calculator for XAUUSD
Step 5
Input your account size, 1,5% as the risk ratio.
In "stop loss in pips" field, write down the pip value of your biggest stop loss - 680 pips in our example.
Press, calculate.
For our example, the best lot size for Gold will be 0.22.
The idea is that your maximum loss should not exceed 1,5% of your account balance, while the average loss will be around 1%.
❤️Please, support my work with like, thank you!❤️
I am part of Trade Nation's Influencer program and receive a monthly fee for using their TradingView charts in my analysis.

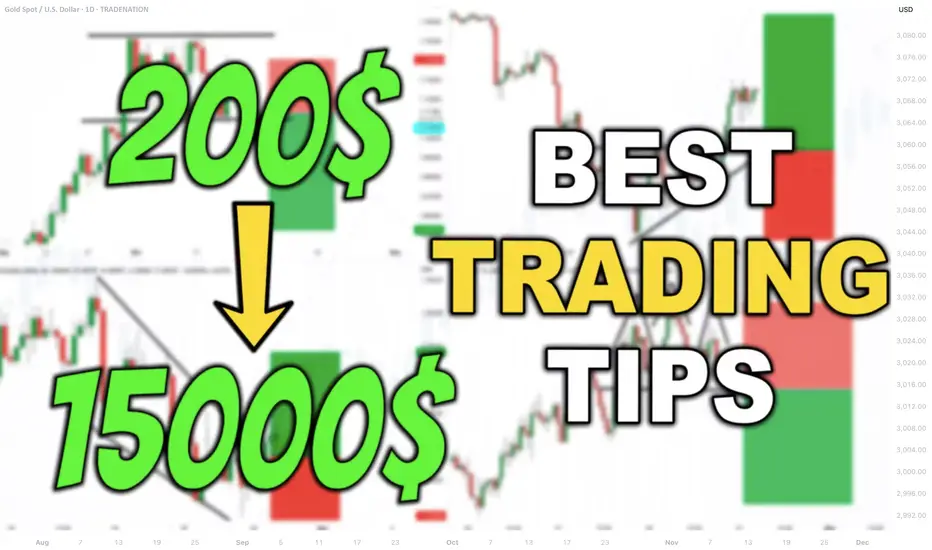
6 Best Tips for Small Trading Accounts (Forex, Gold)
This useful trading tips will help you to efficiently start trading with a small trading account.
A quick note: by a small account, I mean an account size from 10$ - 2000$.
1 - Trade less often
Small account implies a limited amount of money for trading. It means that among dozens of trading opportunities that you spot during a trading day, you should carefully pick only the most promising ones.
I recommend opening maximum 3 trades per day.
2 - Stick to one strategy
One of the ways to trade less frequently is to stick to one single trading strategy. Most of the traders do completely opposite: instead of focusing on one approach, they prefer to trade multiple ones simultaneously.
Trading various strategies requires a lot of capital. The more strategies you follow, the more margin is needed.
With a small trading account, you are risking being left without a free margin for all the trading opportunities that the strategies provide.
3 - Trade liquid instruments with low spreads
When you are picking the financial instruments for your trading, make sure that you select the most liquid ones. You can assess the liquidity of the instrument by a spread. The bigger is the spread, the less liquid is the asset.
Take a look at a spread difference between EURUSD and CHFJPY.
The spread on EURUSD is 0.1 pip.
While the spread on CHFJPY is 2.7 pips.
Spreads directly affect the costs of trading. Bigger spreads reduce the potential profits and increase the risks.
Make sure that you choose the assets with the lowest spreads possible.
4 - Shorten the list of trading instruments
One more option to trade less often is to narrow down the list of your trading instruments. I recommend choosing the maximum of 7 instruments.
7 USD Major Forex Pairs:
EURUSD,
GBPUSD,
USDJPY,
USDCAD
NZDUSD
AUDUSD
USDCHF
is a perfect watch list for a small account trader.
5 - Don't trade higher time frames
Be careful when deciding a time frame to trade.
Remember that the higher is the time frame, the bigger are the stop losses for your traders.
On the left chart is the swing trade that I took with my students on EURUSD chart on a daily. While on the right is the scalping trade taken on 30 minutes time frame.
A stop loss for swing trade is 90 pips and a stop loss of scalping position is 19 pips.
Big stop losses require more free margin and limit the amount of the trades that you can take simultaneously.
For that reason, prioritize lower time frame trading with a small trading account.
6 - Don't risk more than 2% per trade
When traders trade with a small trading account, they often risk a huge portion of their trading account per a single trade.
If you have 100$ trading account, and you risk 20$ per trade, the nominal value of that risk does not look huge. But from a percentage standpoint, it is 20% of the total balance.
Just a 5 trades losing streak will blow such an account.
Make sure that you apply a position size calculator and risk no more than 2% of your account per trade.
Following these recommendations, you will be able to build an effective trading plan that will help you to grow your capital quickly.
❤️Please, support my work with like, thank you!❤️
I am part of Trade Nation's Influencer program and receive a monthly fee for using their TradingView charts in my analysis.
Step-By-Step Guide to Building a Winning Gold Trading Strategy
In the today's article, I will teach you how to create your first profitable gold trading strategy from scratch.
Step 1: Choose the type of analysis
The type of analysis defines your view on the market.
With technical analysis you rely on patterns, statistical data, technical indicators, etc. for making trading decisions.
Fundamental analysis focuses on factors that drive the prices of gold such as micro and macroeconomics, news and geopolitics.
A combination of technical and fundamental analysis implies the application of both methods.
For the sake of the example, we will choose pure technical approach.
Step 2: Specify the area of analysis
Technical and fundamental analysis are complex and multilayered subjects. That is why it is crucially important to choose the exact concepts and techniques that you will apply in gold trading.
For example, with a technical analysis, you can trade harmonic patterns, or apply a combination of key levels and technical indicators.
With fundamental analysis, you can build your trading strategy around trading the economic calendar or important news releases.
Here we will choose support & resistance levels and smart money concepts.
Step 3: Select a trading time frame
Your trading time frame will define your trading style. Focusing on hourly time frame, for example, you will primarily catch the intraday moves, while a daily time frame analysis will help you to spot the swing moves.
You can also apply the combination of several time frames.
We will choose the combination of a daily and an hourly time frames.
Step 4: Define your trading zones
By a trading zone, I mean an area or a level on a price chart from where you will look for trading opportunities.
For example, a technical indicator trader may apply moving average as the trading point.
For the sake of the example, we will choose support and resistance levels on a daily time frame as our trading areas.
Step 5: Choose confirmations
Confirmation is your entry reason . It is the set of conditions that indicates a highly probable projected outcome.
For an economic calendar traders, the increasing CPI (inflation) figures can be a solid reason to open a long position on Gold.
Our confirmation will be a local change of character on an hourly time frame.
Step 6: Define your stop loss placement, entry and target selection and desired reward to risk ratio
You should know exactly where should be your entry point, where will be your stop loss and where should be the target.
We will open a trading position immediately after a confirmed change of character, stop loss will lie below the lows if we buy or above the highs if we sell.
Target will be the next daily structure.
Minimal reward to risk ration should be 1.5.
Step 7: Define Your Lot Size and Risk Per Trade
You should have precise rules for the calculation of a lot size for each trade.
For our example, we will strictly risk 1% of our trading deposit per trade.
Step 8: Set trade management rules
When the trade is active, trade management rules define your action:
for example, whether you strictly wait for tp or sl, or you apply a trailing stop loss.
In our strategy, we will move stop loss to entry 10 minutes ahead of the release of the US news in the economic calendar.
Step 9: Back test your strategy
Study the historical data and back test at least 50 trading setups that meet your strategy criteria.
Make sure that the strategy has a positive win rate.
Step 10: Try a trading strategy on a demo account
Spend at least a month on demo account and make sure that you obtain positive overall results.
If you see consistent profits on a demo account, it is the signal for you that your strategy is ready , and it's time to start trading on a real account.
In case of negative results, modify your trading conditions and back test them again, or build a new strategy from scratch.
❤️Please, support my work with like, thank you!❤️
I am part of Trade Nation's Influencer program and receive a monthly fee for using their TradingView charts in my analysis.
Learn 2 Essential Elements of Forex Gold Trading
In the today's post, we will discuss how Forex Gold trading is structured, and I will share with you its 2 key milestones.
Trading with its nuances and complexities can be explained as the interconnections of two processes: trading rules creation and trading rules following.
1️⃣ With the trading rules, you define what you will trade and how exactly, classifying your entry and exist conditions, risk and trade management rules. Such a set of consistent trading rules compose a trading strategy.
For example, you can have a following trading plan:
you trade only gold, you analyze the market with technical analysis,
you buy from a key support and sell from a key resistance on a daily, your entry confirmation is a formation of a reversal candlestick pattern.
You set stop loss above the high/low of the pattern, and your target is the closest support/resistance level.
Here is how the trading setup would look like.
In the charts above, all the conditions for the trade are met, and the market nicely reached the take profit.
2️⃣ Trading strategy development is a very simple process. You can find hundreds of different ones on the internet and start using one immediately.
The main obstacle comes, however, with Following Trading Rules.
Following the rules is our second key milestone. It defines your ability to stay disciplined and to stick to your trading plan.
It implies the control of emotions, patience and avoidance of rationalization.
Once you open a trade, following your rules, challenges are just beginning. Imagine how happy you would feel yourself, seeing how nicely gold is moving to your target after position opening.
And how your mood would change, once the price quickly returns to your entry.
Watching how your profits evaporate and how the initially winning position turns into a losing one, emotions will constantly intervene.
In such situations, many traders break their rules , they start adjusting tp or stop loss or just close the trading, not being able to keep holding.
The ability to follow your system is a very hard skill to acquire. It requires many years of practicing. So if you believe that a good trading strategy is what you need to make money, please, realize the fact that even the best trading strategy in the world will lose without consistency and discipline.
❤️Please, support my work with like, thank you!❤️
I am part of Trade Nation's Influencer program and receive a monthly fee for using their TradingView charts in my analysis.
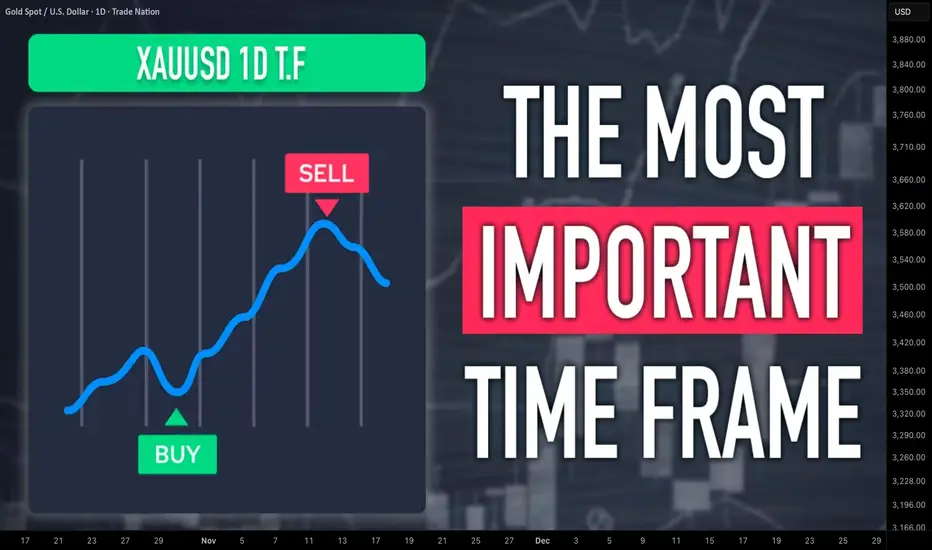
Learn What Time Frame to Trade. Gold Forex Trading Basics
If you just started trading, you are probably wondering how to choose a trading time frame.
In the today's post, I will go through the common time frames, and explain when to apply them.
1m; 5m, 15m Time Frames
These 4 t.f's are very rapid and are primarily applied by scalpers .
If your goal is to catch quick ebbs and flows within a trading session, that is a perfect selection for you.
30m, 1H Time Frame
These 2 are perfectly suited for day traders.
Executing the analysis and opening the trades on these time frames,
you will be able to catch the moves within a trading day.
4h, Daily Time Frames
These time frames are relatively slow .
They are mostly applied by swing traders, who aim to trade the moves that last from several days to several weeks.
Weekly, Monthly Time Frames
These time frames reveal long-term historical perspective and are mostly used by investors and position traders.
If your goal is to look for buy & hold assets, these time frames will help you to make a reasonable decision.
📝When you are choosing a time frame to trade, consider the following factors :
1️⃣ - Time Availability
How much time daily/weekly are you able to sacrifice on trading?
Remember a simple rule: lower is the time frame, more time it requires for management.
2️⃣ - Risk Tolerance
Smaller time frames usually involve higher risk,
while longer-term time frames are considered to be more conservative and stable.
3️⃣ - Your Trading Goals
If you are planning to benefit from short term price fluctuations you should concentrate your attention on lower time frames,
while investing and long-term capital accumulation suite for higher time frames.
Time frame selection is nuanced and a complex topic. However, I believe that these simple rules and factors will help you to correctly choose the one for you.
❤️Please, support my work with like, thank you!❤️
I am part of Trade Nation's Influencer program and receive a monthly fee for using their TradingView charts in my analysis.

Are You Taking the Right Risks in Trading? RISK Per Trade Basics
What portion of your equity should you risk for your trading positions?
In the today's article, I will reveal the types of risks related to your position sizing.
Quick note: your risk per trade will be defined by the distance from your entry point to stop loss in pips and the lot size.
🟢Risking 1-2% of your trading account per trade will be considered a low risk.
With such a risk, one can expect low returns but a high level of safety of the total equity.
Such a risk is optimal for conservative and newbie traders.
With limited account drawdowns, one will remain psychologically stable during the negative trading periods.
🟡2-5% risk per trade is a medium risk. With such a risk, one can expect medium returns but a moderate level of safety of the total equity.
Such a risk is suitable for experienced traders who are able to take losses and psychologically resilient to big drawdowns and losing streaks.
🔴5%+ risk per trade is a high risk.
With such a risk, one can expect high returns but a low level of safety of the total equity.
Such a risk is appropriate for rare, "5-star" trading opportunities where all stars align and one is extremely confident in the positive outcome.
That winner alone can bring substantial profits, while just 2 losing trades in a row will burn 10% of the entire capital.
🛑15%+ risk per trade is considered to be a stupid risk.
With such a risk, one can blow the entire trading account with 4-5 trades losing streak.
Taking into consideration the fact that 100% trading setups does not exist, such a risk is too high to be taken.
The problem is that most of the traders does not measure the % risk per trade and use the fixed lot.
Never make such a mistake, and plan your risks according to the scale that I shared with you.
❤️Please, support my work with like, thank you!❤️
I am part of Trade Nation's Influencer program and receive a monthly fee for using their TradingView charts in my analysis.

Your Best Trading Signal Formula Revealed (Forex, Gold)
If you are looking for a way to increase the accuracy of your trades, I prepared for you a simple yet powerful checklist that you can apply to validate your trades.
✔️ - The trades fit my trading plan
When you are planning to open a trade, make sure that it is strictly based on your rules and your entry reasons match your trading plan.
For example, imagine you found some good reasons to buy USDJPY pair, and you decide to open a long trade. However, checking your trading plan, you have an important rule there - the market should strictly lie on a key level.
The current market conditions do not fit your trading plan, so you skip that trade.
✔️ - The trade is in the direction with the trend
That condition is mainly addressed to the newbie traders.
Trading against the trend is much more complicated and riskier than trend-following trading, for that reason, I always recommend my students sticking with the trend.
Even though USDCHF formed a cute double bottom pattern after a strong bearish trend, and it is appealing to buy the oversold market, it is better to skip that trade because it is the position against the current trend.
✔️ - The trade has stop loss and target level
Know in advance where will be your goal for the trade and where you will close the position in a loss.
If you think that it is a good idea to buy gold now, but you have no clue how far it will go and where can be the target, do not take such a trade.
You should know your tp/sl before you open the trade.
✔️ - The trade has a good risk to reward ratio
Planning the trade, your potential reward should outweigh the potential risks. And of course, there are always the speculations about the optimal risk to reward ratio, however, try to have at least 1.3 R/R ratio.
Planning a long trade on EURNZD with a safe stop loss being below the current support and target - the local high, you can see that you get a negative r/r ratio, meaning that the potential risk is bigger than the potential reward. Such a trade is better to skip.
✔️ - I am ok with losing this trade if the market goes against me
Remember that even the best trading setups may occasionally fail. You should always be prepared for losses, and always keep in mind that 100% winning setups do not exist.
If you are not ready to lose, do not even open the position then.
✔️ - There are no important news events ahead
That rule is again primarily addressed to newbies because ahead and during the important news releases we have sudden volatility spikes.
Planning the trade, check the economic calendar, filtering top important news.
If important fundamentals are expected in the coming hours, it's better to wait until the news release first.
Taking a long trade on Gold, you should check the fundamentals first. Only after you confirm, that there are no fundamentals coming soon, you can open the position.
What I like about that checklist is that it is very simple, but you can use it whether you are a complete newbie or an experienced trader.
Try it and let me know if it helps you to improve your trading performance.
❤️Please, support my work with like, thank you!❤️
I am part of Trade Nation's Influencer program and receive a monthly fee for using their TradingView charts in my analysis.

High Volatility Trade Management & Risk Management Strategies
With a current geopolitical uncertainty and the election of Trump, forex market and gold experience wild price fluctuations. These unpredictable swings can result in substantial losses, particularly for the beginners in trading.
In this article, I will share with you the essential trade management and risk management tips for dealing with extreme volatility in trading.
I will reveal proven strategies and techniques for avoiding losses and unexpected risks.
1. First and foremost, pay attention to the news.
The main driver of high volatility on the markets are the news , especially the bad ones.
In normal times, high impact news events are relatively rare, while in times of uncertainty their frequency increases dramatically.
Such news may easily invalidate the best technical analysis setup: any powerful support or resistance level, strong price action or candle stick pattern can be easily overturned by the fundamentals.
Trump tariffs threats against Canada made USDCAD rise by 400 pips rapidly, while the change of rhetoric quickly returned the prices to previous levels.
One you hold an active trade, monitor the news. If you see the impactful news that may affect the pair or instrument that you trade, immediately protect your position, moving stop loss to entry.
It will help you avoid losses if the market starts going against you.
2. Even constantly monitoring the news, you will not be able to protect yourself from all the surprising movements.
Sometimes your trades will quickly be closed in a loss.
Therefore, I strictly recommend measure a lot size for every trade that you take. Make sure that you risk no more than 1% of your trading account per trade. That will help you to minimize losses cased by the impactful, uncertain events.
3. The impactful events may also occur on weekend, while Forex market is closed. Such incidents can be the cause of huge gap openings.
If you hold an active trading position over the weekend, remember that your entire account can be easily blown with such gaps.
Imagine that you decided to buy EURUSD on Friday during the NY session and keep holding the position over the weekend.
A huge gap down opening would make you face huge losses, opening the market 125 pips below the entry level.
By the way, this day I received a dozen of messages from my followers that their accounts were blown with the opening gaps.
4. If you see a significant price movement caused by some events, and you did not manage to catch it, let it go.
Jumping in such movements is very risky because quite ofter correctional movements will follow quickly.
It will be much safer and better to try to be involved in a trend continuation after a pullback.
Look what happened with Gold when Trump began a new trade war.
The price started to grow rapidly. However, even during such a sentiment, 500 pips pullback occurred, giving patient traders a safe entry point for the trade.
5. In the midst of geopolitical tensions and trade wars, the markets tend to rally or fall for the extended time periods.
The best trading strategies to use to get maximum from such movements are trend-following strategies.
While reversal, counter-trend trading might be extremely risky, providing a lot of false signals.
Trend trading may bring extraordinary profits.
These trading tips, risk management and trade management strategies and secrets are tailored for cutting and avoiding losses during dark times. Empower your strategy with this useful knowledge and good luck to you in trading high volatility on Gold and Forex.
❤️Please, support my work with like, thank you!❤️
I am part of Trade Nation's Influencer program and receive a monthly fee for using their TradingView charts in my analysis.

Best Strategies to Identify a Bearish Reversal in Gold Trading
In this article, I will explain to you 4 efficient strategies to identify a bearish reversal with technical analysis in Gold trading.
You will learn price action, SMC and technical indicator strong bearish signals.
First, let me remind you that different bearish signals may indicate a different magnitude and a degree of a potential reversal.
While some signals will be reliable for predicting short term reversals, some will be more accurate in projecting long-term ones.
One more thing to note is that one of the best time frames for bearish reversal confirmations on Gold is the daily. So, all the cases that will be explained will be on a daily time frame strictly.
XAUUSD Bearish Reversal Signal 1 - Bearish Price Action Pattern.
One of the perfect indicators of the overbought state of a bullish trend on Gold is bearish price action patterns.
I am talking about classic horizontal neckline based patterns like head & shoulders, inverted cup & handle, double/triple top and descending triangle.
Typically, these patterns leave early bearish clues and help to predict a coming downturn movement.
A strong bearish signal is a breakout of a horizontal neckline of the pattern and a candle close below.
The price may continue falling at least to the next key support then.
Above is the example of a head and shoulders pattern on Gold, on a daily. Its formation was the evidence of the overheated market. Bearish breakout of its neckline confirmed that, and the price continued falling.
Bearish Reversal Signal 2 - Rising Channel Breakout.
When the market is trading in a healthy bullish trend, it usually starts moving with the boundaries of a rising channel.
It can be the expanding, parallel or contracting channel.
Its support will represent a strong vertical structure , from where new bullish waves will initiate after corrections .
Its breakout will quite accurately indicate a change of a market sentiment and a highly probable bearish reversal.
Look at this rising parallel channel on Gold chart on a daily. The market was respecting its boundaries for more than 3 months.
A bearish violation of its support was an accurate bearish signal that triggered a strong bearish movement.
Bearish Reversal Signal 3 - Change of Character & Bearish Price Action.
One of the main characteristics of a bullish trend is the tendency of the market to set new higher highs and higher lows. Each final high of each bullish impulse is always higher than the previous. Each final low of each bearish movement is also higher than the previous.
In such a price action, the level of the l ast higher low is a very significant point.
The violation of that and a formation of a new low is an important event that is called Change of Character CHoCH.
It signifies the violation of a current bullish trend.
After that, one should pay attention to a consequent price action, because CHoCH can easily turn into just an extended correctional movement.
If the market sets a lower high and a new lower low then, it will confirm the start of a new bearish trend.
That is the example of a confirmed Change of Character on Gold on a daily. To validate the start of a new bearish trend, we should let the price set a lower high and a form a bearish impulse with a new lower low.
Bearish Reversal Signal 4 - Death Cross.
Death cross is a strong long-term bearish reversal signal that is based on a crossover of 2 moving averages.
On a daily time frame, it is usually based on a combination of 2 Simple Moving Averages: one with 50 length and one with 200 length.
The signal is considered to be confirmed when a 50 length SMA crosses below 200 length SMA.
It is commonly believed that it signifies that the market enters a long-term bearish trend.
On the chart, I plotted 2 Moving Averages. When the blue one crosses below the orange one, a global bearish trend on Gold will be confirmed
The 4 bearish signals that we discussed will be useful for predicting short term, mid term and long term bearish reversals on Gold.
While price action patterns will indicate local bearish movements, Death Cross will confirm a global trend change.
Learn to recognize all the signals that we discussed to make more accurate trading and investing decisions.
❤️Please, support my work with like, thank you!❤️

Learn What Will Make You Profitable in Forex & Gold Trading
What brings the consistent profits in trading?
Talking to hundreds of struggling traders from different parts of the globe, I realized that there are the common misconceptions concerning that subject.
In this educational article, we will discuss what really will make you profitable in trading.
Trading Signals
🔔The first thing that 99% of struggling traders are looking for is signals.
Why damn learn if you can simply follow the trades of a pro trader and make money?!
The truth is, however, is that in order to repeat the performance of a signal provider you have to open all your trading positions in the same exact moment he does. (And I would not even mention the fact that there will be a delay between the moment the provider opens the trade and the moment he sends you the signal)
Because the signal can be sent at a random moment, quite often it will take time for you to reach your trading terminal and open the position.
Just a 1-minute delay may dramatically change the risk to reward ration of the trade and, hence, the final result.
Expert Advisors
🤖The second thing that really attracts the struggling traders is trading robots (EA) . The systems that trade automatically and aimed to generate consistent profits.
You simply start the program and wait for the money.
The main problem with EA is the fact that it requires constant monitoring . It can stop or freeze in a random moment and may require a reboot.
Moreover, due to changing market conditions, the EA should be regularly updated. Without the updates, at some moment it may blow your account.
Trading robot is the work : trading with the robots means their constant development, monitoring and improvement. And that work requires a high level of experience: both in coding and in trading.
Technical Indicators
📈The third thing that struggling traders are seeking is the "magic" indicator. The one that will accurately identify the safe points to buy and sell. You add the indicator on the chart, and you simply wait for the signal to open the trade.
The fact is that magic indicators do not exist. Indicator is the tool that can be applied as the extra confirmation. It should be applied strictly in a combination with something else, and its proper application requires a high level of expertise in trading.
Luck in Trading
🍀The fourth thing that newbie traders seek is luck. They open the trade, and then they pray the God, Powell, Fed or someone else to move the market in their favour.
And yes, occasionally, luck will be on your side. But relying on luck on a long-term basis, you are doomed to fail.
But what will make you profitable then?
What is the secret ingredient.
Remember, that secret ingredient does not exist.
In order to become a consistently profitable traders, you should rely on 4 crucial elements: trading plan, risk management, discipline and correct mindset.
🧠What is correct mindset in trading?
It simply means setting REALISTIC goals and having REALISTIC expectations from the market and from your trading.
📝A trading plan is the set of rules and conditions that you apply for the search of a trading setup and the management of the opened position.
Trading plan will be considered to be good if it is back tested on historical data and then tested on demo account for at least 3 consequent months.
✔️In order to follow the plan consistently, you need to be disciplined . You should be prepared for losing streaks, and you should be strong enough to not break once your trading account will be in a drawdown.
💰Risk management is one of the most important elements of your trading plan. It defines your risk per trade and your set of actions in case of losses. Even the best trading strategies may fail because of poor risk management.
Combining these 4 elements, you will become a consistently profitable trader. Remember, that there is no easy way, no shortcut. Trading is a hard work to be done.
❤️Please, support my work with like, thank you!❤️

Strongest Reversal Candlestick Patterns For Gold & Forex
In this educational article, we will discuss powerful reversal candlestick patterns that every trader must know.
Bullish Engulfing Candle
Bullish engulfing candle is one of my favourite ones.
It usually indicates the initiation of a bullish movement after a strong bearish wave.
The main element of this pattern is a relatively big body. Being bigger than the entire range of the previous (bearish) candle, it should completely "engulf" that.
Such a formation indicates the strength of the buyers and their willingness to push the price higher.
Bullish engulfing candle that I spotted on Gold chart gave a perfect bullish trend-following signal.
Bearish Engulfing Candle
The main element of this pattern is a relatively big body that is bigger than the entire range of the previous (bullish) candle.
Such a formation indicates the strength of the sellers and their willingness to push the price lower.
________________________
Bullish Inside Bar
Inside bar formation is a classic indecision pattern.
It usually forms after a strong bullish/bearish impulse and signifies a consolidation .
The pattern consists of 2 main elements:
mother's bar - a relatively strong bullish or bearish candle,
inside bars - the following candles that a trading within the range of the mother's bar.
The breakout of the range of the mother's bar may quite accurately confirm the reversal.
A bullish breakout of its range and a candle close above that usually initiates a strong bullish movement.
Bearish Inside Bar
A bearish breakout of the range of the mother's bar and a candle close below that usually initiates a strong bearish movement.
Bearish breakout of the range of the mother's bar candlestick provided a strong bearish signal
on EURUSD.
________________________
Doji Candle (Morning Star)
By a Doji we mean a candle that has the same opening and closing price.
Being formed after a strong bearish move, such a Doji will be called a Morning Star. It signifies the oversold condition of the market and the local weakness of sellers.
Such a formation may quite accurately indicate a coming bullish movement.
Doji Candle (Evening Star)
Being formed after a strong bullish move, such a Doji will be called an Evening Star. It signifies the overbought condition of the market and the local weakness of buyers.
Such a formation may quite accurately indicate a coming bearish movement.
Above is a perfect example of a doji candle and a consequent bearish movement on Silver.
I apply these formations for making predictions on financial markets every day. They perfectly work on Forex, Futures, Crypto markets and show their efficiency on various time frames.
❤️Please, support my work with like, thank you!❤️

Learn Supply and Demand Basics in Gold XAAUSD Trading
In this article, we will discuss the basic principles of Smart Money Concepts in Gold trading.
I will explain to you how Gold price relates to supply and demand on the market. What is a fair value and how to identify it.
We will discuss a relation between a fair value and supply and demand and why is it so important to learn to recognize the imbalance.
Gold Price
First, let's briefly discuss how the price of Gold is valued .
Gold price is determined by the basic economic principles of supply and demand.
Supply is defined by the actions of the sellers and selling volumes.
While a demand is defined by the activity of buyers and the volumes they wish to purchase.
When supply exceeds demand, it leads to a decline in prices.
Increased selling pressure leads to lower prices as sellers compete to attract buyers.
Above, you can see how the excess of demand pushes Gold prices up rapidly.
When demand exceeds supply, we see an increase in the price of the financial asset.
In the example above, you can see how the excess of supply leads to a depreciation of a Gold price.
Imbalance & Fair Value
The excess of supply or demand on the market is also called an imbalance in Smart Money Concept trading SMC.
The imbalance causes strong bullish or bearish movement on the market.
However, such moves do not last forever.
At some moment, reaching a particular price level, the market will stop growing or falling, and the market will find the equilibrium in supply and demand.
Such an equilibrium is also called a fair value in SMC trading.
On the chart above, Gold was growing rapidly. After reaching some price level, the growth stopped and the market found a fair value.
Supply finally absorbed the excess of demand.
Sideways Movement & Range
When the market finds a fair value, it usually starts trading in sideways . The sideways movement forms a horizontal range - a horizontal parallel channel.
Such ranges signify that the market participants agree about a current price of an asset.
Above, you can see that after a strong up movement, Gold found a fair value and a consolidation within a horizontal range started.
Fair Value Range
When you spotted the range, you should remember that the market may stay within that for a very long period of time.
The trigger that will make the market reassess the fair value is typically a some important fundamental factor, the surprising geopolitical or economic event that will create a new imbalance on the market.
A strong signal that the market strives to find a new fair value is the breakout of one of the boundaries of the range. It is a signal of a violation of a current fair value.
You can see that Gold found a fair value and was stuck for quite a long period within a wide horizontal range. Then, because of the release of significant US fundamental news, an imbalance occurred. Fair value range was violated, and the price found a new fair value higher.
Trading Tips
When the imbalance on the market occurs and it violates the fair value, the price tends to find a new fair value around significant liquidity zones.
That is why it is so critical to pay attention to them.
Also, the laws of supply and demand, imbalance and fair value work on any time frame and can be applied for any trading style.
Learn to perceive a price chart from a Supply and Demand perspective in order to master Smart Money Concept trading strategy.
❤️Please, support my work with like, thank you!❤️

How to Identify Significant Liquidity Zone in Gold Trading
A liquidity zone is a specific area on a price chart where the market orders concentrate.
In this article, I will teach you how to identify the most significant liquidity zones on Gold chart beyond historical levels.
Liquidity Zones
First, in brief, let's discuss where liquidity concentrates.
Market liquidity concentrates on:
1. Psychological levels
Above, you can see a clear concentration of liquidity around a 2500 psychological level on Gold price chart.
2. Fibonacci levels
In the example above, we can see how 382 retracement of a major bullish impulse attracts market liquidity on Gold XAUUSD daily time frame.
3. Horizontal support and resistance levels and trend lines.
In that case, an area based on a classic support/resistance level was a clear source of market liquidity on Gold.
Significant Liquidity Zone
A significant liquidity zone will be the area where psychological levels, Fibonacci levels, horizontal support and resistance levels and trend lines match .
Please, note that such an area may combine the indicators, or any other technical tools.
Such zones can be easily found even beyond the historic levels.
Look at a price chart on Gold on a daily.
Though the market has just updated the ATH, we can spot the next potentially significant liquidity zone with technical analysis.
We see a perfect intersection of a rising trend line, 2600 psychological level based on round numbers and a Fibonacci extension confluence of 2 recent bullish impulses.
These technical tools will compose a significant liquidity zone.
The idea is that Gold was rallying up because of the excess of demand on the market. We will assume that selling orders will be placed within that liquidity zone and the excess of demand will be absorbed by the supply.
It will make the price AT LEAST stop growing and potentially will trigger a correctional movement.
Learn to recognize such liquidity zones, it will help you a lot in predicting Gold price movements.
❤️Please, support my work with like, thank you!❤️

Best Price Action Pattern For GOLD Trend Following Trading
This bullish pattern is very powerful .
Being spotted on a daily/4h/1h, any time frame, it will help you to accurately predict a strong bullish movement on Gold .
In this article, I will teach you to identify a buying volumes accumulation on Gold chart and as a bonus, I will show you how I predicted a recent bullish rally with this price action pattern.
The initial point of this pattern will be a completion point of a strong bullish impulse.
At some moment, the price finds a strong horizontal resistance, stops growing and retraces.
The second point of the pattern will be a completion of a retracement.
It should strictly be a higher low - it should be higher than the low of an initial bullish impulse.
After a retracement, the price should return to a horizontal resistance and set an equal high , that will be the third point of the pattern.
Then, the price should retrace AT LEAST one more time from a horizontal resistance and set a new higher low.
After that, the price should set one more equal high.
3 equal highs and 2 higher lows will compose a bullish accumulation pattern.
Please, note, that the price may easily set more equal highs and more consequent new higher lows and keep the pattern valid.
Above is the example of a bullish accumulation pattern on Gold on an hourly time frame. The price set 3 equal highs and 3 consequent higher lows.
This pattern will signify the weakness of sellers and the accumulation of buying volumes.
The point is that each consequent bearish price movement from a resistance is weaker than a previous one. It means that fewer sellers are selling from the resistance and more buyers start buying, not letting sellers go lower.
In our example, we can clearly see the consequent weakening, bearish price movements.
This pattern indicates a highly probable breakout attempt of the resistance. A candle close above that provides a strong bullish signal.
The broken resistance will turn into support and will provide a safe point to buy the market from.
In our example, the market broke the underlined horizontal resistance and closed above that. It indicates the completion of a bullish accumulation and a highly probable bullish trend continuation.
You can see that Gold retested a broken structure and then a strong bullish wave initiated.
In a strong bullish market that we currently contemplation on Gold, this bullish pattern will provide a lot of profitable trading opportunities.
No matter whether you are scalping, day trading or swing trading Gold, this bullish accumulation pattern will help you to predict long-term, mid-term and short-term bullish movements.
❤️Please, support my work with like, thank you!❤️

How to Find Key Levels on Gold XAUUSD Chart Easily
In this short article, you will learn how to find powerful levels on a gold chart.
I will explain to you what is a key level, how to apply it in trading. We will discuss key levels and different time frames, valid and invalid key levels. I will share with you a lot of useful trading tips.
First, let's start with a definition of a key level.
Key level is a single important historic price level on the chart,
from where a significant price movement initiated.
Usually, key levels are based on the edges of candlestick wicks.
Look at Gold chart on a 4H time frame.
I underlined a key level. You can see how strong was a bullish reaction to that. The price tested that level, bounced up and formed a long wick.
Key levels that are above current prices will be called resistances .
We will assume that sellers are placing their selling orders there.
Above is the example of a key resistance on Gold on an hourly time frame.
The price tested 2479 level, dropped rapidly and formed a long wick.
From a key resistance level, a bearish movement is expected.
Key levels that are below current prices will be called supports.
We will assume that buyers are placing their buying orders there.
That is the example of a key support level on Gold chart on a daily.
From a key support level a bullish movement is expected.
Key levels that are lying close to each other will compose support and resistance clusters.
Look at 2 key support levels on Gold on a 4H time frame.
These 2 levels are lying very close to each other and compose a support cluster.
3 key resistance above will compose a resistance cluster on Gold on a daily time frame, because these levels lye close to each other.
With time, the market tends to break key levels.
If the price violated a key support level and closes below that, it turns into a resistance level.
Look at a breakout of key support on an hourly time frame on Gold chart.
After a candle close below that, the broken key level turned into resistance.
If the price violates a key resistance level and closes above that, it turns into a support level.
Above is a recently broken horizontal resistance on Gold on a 4H time frame. After a breakout, that key level turned into support.
Key levels tend to lose their significance with time.
Key level that is broken by the buyers and the sellers or vice versa loses the status of a key level.
The underlined level was a significant resistance in the past.
However, the market stopped respecting this level and it lost its importance.
Remember that you can find key levels on any time frame.
But key levels are not equal in their significance.
Key levels that are spotted on higher time frame will be stronger than key levels that are spotted on lower time frames.
On the chart on the left, I underlined key support and resistance levels on a daily time frame on Gold.
While on the right, I market key support and resistance levels on a 4H time frame.
Daily structures will be considered to be more significant structures.
Hence, the market reaction to such structures tend to be stronger.
In comparison to support and resistance areas,
key levels provide the safest points to look for a trading opportunity from.
Once you spotted a confirmation after a test of a key level,
simply set your stop loss below a support or above a resistance.
You will have a very good reward to risk ratio.
Key levels play a crucial role in technical analysis of Gold.
No matter whether you are day trader, scalper, swing trader or investor, key levels is the first thing that you should always start your analysis from.
❤️Please, support my work with like, thank you!❤️
