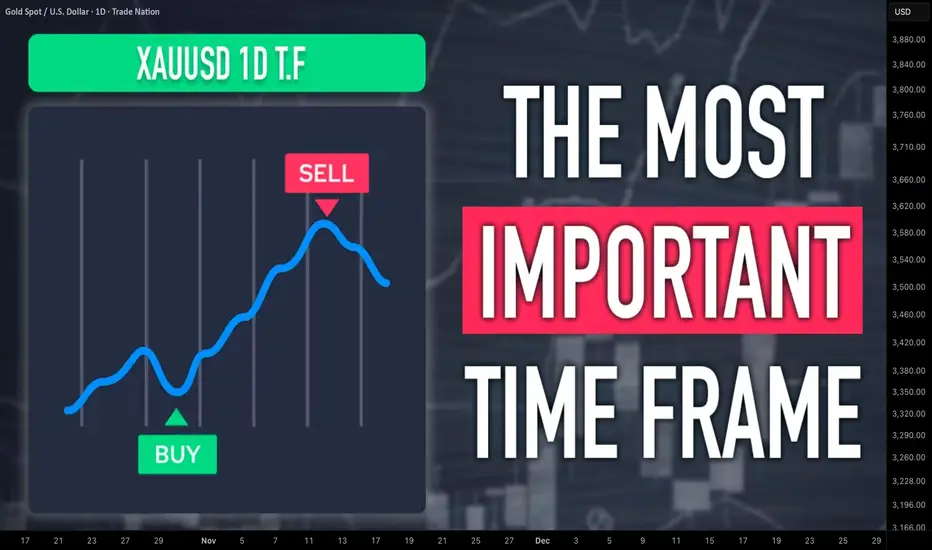
How to Analyze Daily Time Frame on Gold. 5 Important Things
There are 5 important things that you should analyze on Gold on a daily time frame to accurately predict long term, midterm and short term movements.
In this article, I will share with you a step-by-step guide for daily time frame analysis that you can apply on Gold or any other financial instrument.
1 - Identify the market trend
When you analyze a daily time frame, you should identify long term, midterm and short term market trends.
Long-term trend is based on the analysis of one year long price action.
In the example above, Gold is trading in a long term bullish trend because the price keeps setting new higher high and new higher lows during the year.
Midterm trend is based on the analysis of a price action for the last 4–5 months.
Above, we can clearly see that a mid-term trend is bullish because again, the price sets new higher highs and higher lows over time.
Short-term trend is based on the analysis of price movements for the last 2 months.
Short-term price action is also bullish on Gold, with a clear sequence of higher highs and higher lows.
According to the trend analysis, long-term, mid-term and short-term trends are bullish.
2 - Identify the directional bias
The directional bias defines a highly probable future direction on the market.
In our example, we can anticipate that Gold will keep growing among all the dimensions: long-term, mid-term and short-term.
3 - Execute structure analysis
Identify important historic horizontal and vertical structures.
That will be the points from where you should look for trading opportunities.
When you analyze key levels, identify the structures that are lying close to the current price levels.
Make sure that all the structures that you spotted were respected by the market in the past.
4 - Look for price action patterns
Price action patterns are the language of the market.
Proper identification of the patters will help you correctly understand the intentions of the market participants.
You can see that a bearish breakout of a rising channel triggered a correctional movement on the market.
Gold started to fall steadily within a bullish flag pattern and after it tested a key support, the price violated the resistance of the flag.
5 - Analyze candlesticks
Candlestick patterns can provide extra clues and confirmations.
You can see that the market formed multiple rejections from key support, an inside bar formation and bullish engulfing candle.
Violation of the inside bar to the upside with a strong bullish candle is an important bullish signal.
Combining trend analysis, structure analysis, price action and candlestick analysis, and you can make predictions and look for trading opportunities.
You can also make your analysis even more sophisticated, for example, analyzing fundamental analysis or applying technical indicators.
❤️Please, support my work with like, thank you!❤️
I am part of Trade Nation's Influencer program and receive a monthly fee for using their TradingView charts in my analysis.
Goldtradingforbeginners
How to Find Key Levels and Support/Resistance Zones Gold XAUUSD
Key levels and support/resistance zones are 2 essential concepts for profitable trading Gold.
In this article, I will share with you a simple and a proven way to find levels and supply/demand clusters on XAUUSD chart.
I will provide a complete guide with examples.
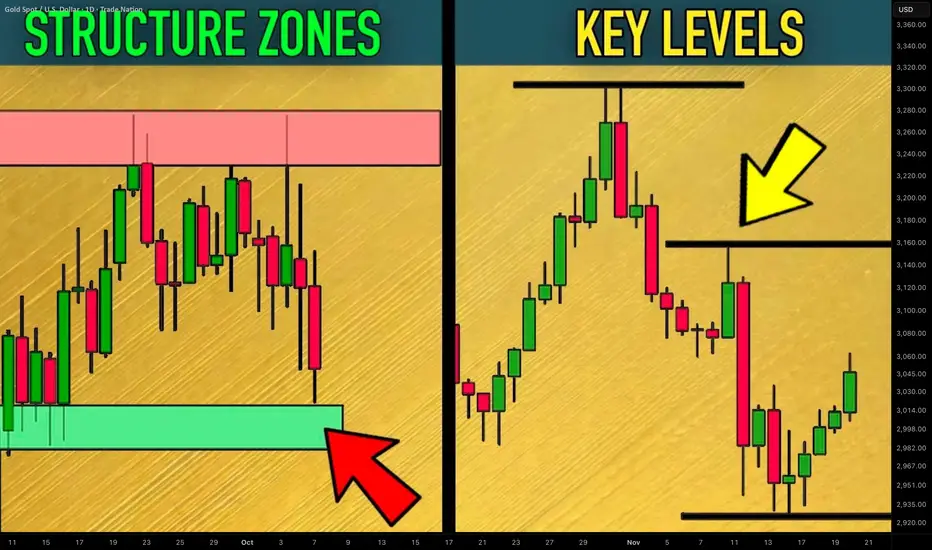
Always start levels/zones analysis on Gold with key levels identification.
Simply put, a key level is a completion point of a strong bullish or bearish movement.
It is the highest high of a bullish wave and the lowest low of a bearish wave.
Let's take a price action on Gold for the last month and let's try to identify key levels.
Analyzing peeks and bottoms of significant price movements, I managed to quickly find a bunch of important key levels.
The ones that are below current spot prices will be called key support levels, while the ones that are above current prices will be called key resistance levels.
What many traders miss, analyzing key levels, is that every key level will always be a part of support/resistance zones.
Candle closes of highs and lows of important price movement will also be important levels.
I underlined all such levels on our Gold chart.
These levels and highs/lows of the impulses will compose supply and demand zones.
That is how these zones look.
The areas that are based on key supports will be called demand zones.
The areas that are based on key resistances will be called supply zones.
The logic is that a high volume of selling orders will be distributed within supply clusters.
Probabilities will be high that a bearish reaction will follow after a test of such a zone.
Demand zones will accumulate buying orders and buying activity.
With a high probability, Gold price will bounce from such zones.
Levels and zones analysis will provide you with a map for trading Gold.
Use that as a map that 95% of retail traders will not see.
It will help you find profitable trades.
❤️Please, support my work with like, thank you!❤️
I am part of Trade Nation's Influencer program and receive a monthly fee for using their TradingView charts in my analysis.
How to Use Fibonacci Levels in Gold Trading. Best Ratios For XAU
I will teach you a simple but efficient way of using Fibonacci levels for Gold analysis.
You will learn the strongest Fib.retracement levels and a proven strategy for XAUUSD trading.
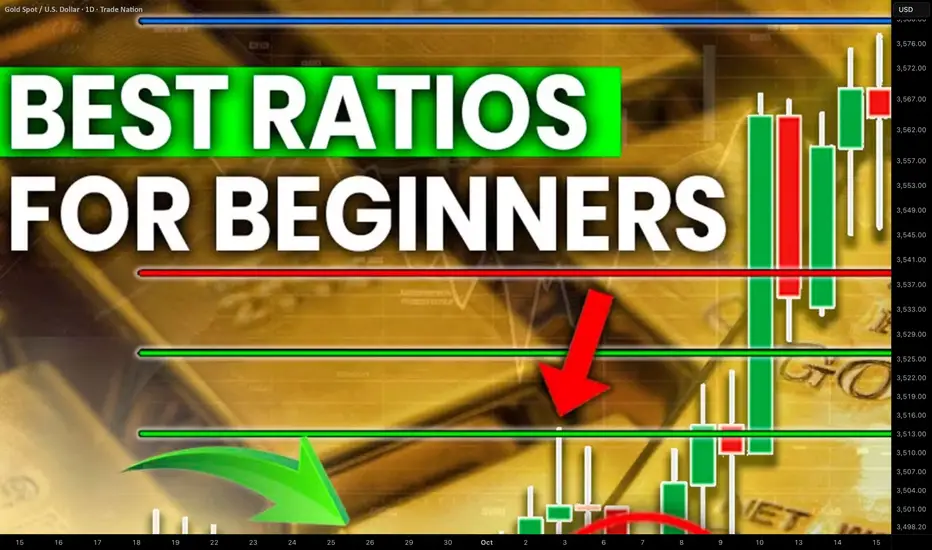
First, let me show you the most powerful Fibonacci retracement levels that you should use for trading Gold.
The most significant ones are: 382, 50, 618, 786.
To use these Fib.Retracement levels properly, you will need to find the strongest 3 impulse legs.
Please, note that you can execute Fibonacci analysis of Gold on any time frame, for the sake of the example, we will do that on a daily.
Here are 3 impulses that I found.
I was simply trying to identify the price waves with the strongest impact. I underlined them from their lows to their highs.
We will draw Fibonacci Retracement levels based on these 3 movements.
We plot Fib.Retracement of a bullish impulse from its low to its high.
We plot Fib.Retracement of a bearish impulse from its high to its low.
That is how it looks.
After that we will need to find a confluence - zones or levels where Fib.Retracement levels of different impulses match .
Such zones will be significant liquidity clusters where market participants will place huge volumes of trading orders.
The first 2 confluence zones that I spotted on a Gold chart will be specific. They are based on 1 and 0 Fib.Retracement levels that match.
These 2 areas are both completion and starting points of our impulse legs.
The fact that significant price movements completed and started after tests of these zones indicates their significance .
Confluence zones 3/4/5/6 are based on a convergence of at least 2 Fib.Retracement levels of different impulses.
Probabilities will be high that these zones will attract the market liquidity.
After we found all confluence zones, I recommend removing Fibonacci levels from the chart to keep it clean .
That is how our complete Fib.Analysis will look.
From these zones, we will look for trading opportunities.
The areas that are above current price levels will be significant supply areas , and we will look for sell signals from them.
The zones that are below Gold spot price will be demand areas. Chances will be high that a strong buying reaction will follow after their test.
Confluence zones that we spotted on Gold chart provide unique perspective. Integrating them in your XAUUSD analysis, you will increase the accuracy of your predictions and trading decisions.
❤️Please, support my work with like, thank you!❤️
I am part of Trade Nation's Influencer program and receive a monthly fee for using their TradingView charts in my analysis.
Best Lot Size for Gold Trading (XAUUSD) Explained
If you trade Gold with fix lot, I prepared for you a simple manual how to calculate the best lot size for your XAUUSD trading account.
Step 1
Find at least the last 10 trades that you took on Gold.
Step 2
Measure stop losses of all these trades in pips
Step 3
Find the trade with the biggest stop loss
In our example, the biggest stop loss is 680 pips
Step 4
Open position size calculator for XAUUSD
Step 5
Input your account size, 1,5% as the risk ratio.
In "stop loss in pips" field, write down the pip value of your biggest stop loss - 680 pips in our example.
Press, calculate.
For our example, the best lot size for Gold will be 0.22.
The idea is that your maximum loss should not exceed 1,5% of your account balance, while the average loss will be around 1%.
❤️Please, support my work with like, thank you!❤️
I am part of Trade Nation's Influencer program and receive a monthly fee for using their TradingView charts in my analysis.

Best GOLD XAUUSD Psychological Levels Indicator on TradingView
There is one free technical indicator that will show you every significant psychological level on Gold XAUUSD chart.
It is available on TradingView and it is very easy to set.
Discover the best psychological support and resistance indicator for Gold trading , its settings and useful tips.
First, let's discuss the significance of psychological levels in GOLD XAUUSD analysis and trading.
The classic way of the search of significant supports and resistance is based on the analysis of a historic price action.
However, while Gold constantly sets new historic highs such a method does not work, because there are no historic resistances to rely on.
In such a situation, the only reliable strategy to find potentially strong resistances is to analyze psychological levels.
Psychological levels are the round numbers based price levels. Because of the common human psychological biases, these levels attract the interest of the market participants and the prices tend to react to them.
A great example of a psychological level in Gold trading is 3000 level.
It served as a resistance first and after a breakout turned into an important support.
And I found a free technical indicator that plots all the significant psychological levels efficiently.
One more thing to note is that I strictly recommend searching for psychological levels on a daily time frame, because it provides the most relevant perspective.
To use this indicator, search "round" in indicators wind ow.
It is called "Round numbers above and below".
Click on that and it will start working immediately.
You can see that the indicator plotted 3 significant psychological resistances above current prices and 3 supports below on Gold chat.
In the settings of the indicator, you can change the number of levels to identify and change the style of the horizontal lines.
Examine the reaction of the price to psychological supports that the indicator shows. These levels may remain significant in futures and applied for pullback/breakout trading.
With a crazy bullish rally that we contemplate on Gold this year, psychological levels will be the most reliable technical analysis tools for the identification of future bearish reversals and corrections.
This free technical indicator on TradingView will help you in search of the strongest ones.
❤️Please, support my work with like, thank you!❤️
I am part of Trade Nation's Influencer program and receive a monthly fee for using their TradingView charts in my analysis.

High Volatility Trade Management & Risk Management Strategies
With a current geopolitical uncertainty and the election of Trump, forex market and gold experience wild price fluctuations. These unpredictable swings can result in substantial losses, particularly for the beginners in trading.
In this article, I will share with you the essential trade management and risk management tips for dealing with extreme volatility in trading.
I will reveal proven strategies and techniques for avoiding losses and unexpected risks.
1. First and foremost, pay attention to the news.
The main driver of high volatility on the markets are the news , especially the bad ones.
In normal times, high impact news events are relatively rare, while in times of uncertainty their frequency increases dramatically.
Such news may easily invalidate the best technical analysis setup: any powerful support or resistance level, strong price action or candle stick pattern can be easily overturned by the fundamentals.
Trump tariffs threats against Canada made USDCAD rise by 400 pips rapidly, while the change of rhetoric quickly returned the prices to previous levels.
One you hold an active trade, monitor the news. If you see the impactful news that may affect the pair or instrument that you trade, immediately protect your position, moving stop loss to entry.
It will help you avoid losses if the market starts going against you.
2. Even constantly monitoring the news, you will not be able to protect yourself from all the surprising movements.
Sometimes your trades will quickly be closed in a loss.
Therefore, I strictly recommend measure a lot size for every trade that you take. Make sure that you risk no more than 1% of your trading account per trade. That will help you to minimize losses cased by the impactful, uncertain events.
3. The impactful events may also occur on weekend, while Forex market is closed. Such incidents can be the cause of huge gap openings.
If you hold an active trading position over the weekend, remember that your entire account can be easily blown with such gaps.
Imagine that you decided to buy EURUSD on Friday during the NY session and keep holding the position over the weekend.
A huge gap down opening would make you face huge losses, opening the market 125 pips below the entry level.
By the way, this day I received a dozen of messages from my followers that their accounts were blown with the opening gaps.
4. If you see a significant price movement caused by some events, and you did not manage to catch it, let it go.
Jumping in such movements is very risky because quite ofter correctional movements will follow quickly.
It will be much safer and better to try to be involved in a trend continuation after a pullback.
Look what happened with Gold when Trump began a new trade war.
The price started to grow rapidly. However, even during such a sentiment, 500 pips pullback occurred, giving patient traders a safe entry point for the trade.
5. In the midst of geopolitical tensions and trade wars, the markets tend to rally or fall for the extended time periods.
The best trading strategies to use to get maximum from such movements are trend-following strategies.
While reversal, counter-trend trading might be extremely risky, providing a lot of false signals.
Trend trading may bring extraordinary profits.
These trading tips, risk management and trade management strategies and secrets are tailored for cutting and avoiding losses during dark times. Empower your strategy with this useful knowledge and good luck to you in trading high volatility on Gold and Forex.
❤️Please, support my work with like, thank you!❤️
I am part of Trade Nation's Influencer program and receive a monthly fee for using their TradingView charts in my analysis.

How to Identify a Bearish Reversal in Gold Trading
In this article, I will explain to you 4 efficient strategies to identify a bearish reversal with technical analysis in Gold trading.
You will learn price action, SMC and technical indicator strong bearish signals.
First, let me remind you that different bearish signals may indicate a different magnitude and a degree of a potential reversal.
While some signals will be reliable for predicting short term reversals, some will be more accurate in projecting long-term ones.
One more thing to note is that one of the best time frames for bearish reversal confirmations on Gold is the daily . So, all the cases that will be explained will be on a daily time frame strictly.
XAUUSD Bearish Reversal Signal 1 - Bearish Price Action Pattern.
One of the perfect indicators of the overbought state of a bullish trend on Gold is bearish price action patterns.
I am talking about classic horizontal neckline based patterns like head & shoulders, inverted cup & handle, double/triple top and descending triangle.
Typically, these patterns leave early bearish clues and help to predict a coming downturn movement.
A strong bearish signal is a breakout of a horizontal neckline of the pattern and a candle close below.
The price may continue falling at least to the next key support then.
Above is the example of a head and shoulders pattern on Gold, on a daily. Its formation was the evidence of the overheated market. Bearish breakout of its neckline confirmed that, and the price continued falling.
Bearish Reversal Signal 2 - Rising Channel Breakout.
When the market is trading in a healthy bullish trend, it usually starts moving with the boundaries of a rising channel.
It can be the expanding, parallel or contracting channel.
Its support will represent a strong vertical structure, from where new bullish waves will initiate after corrections.
Its breakout will quite accurately indicate a change of a market sentiment and a highly probable bearish reversal.
Look at this rising parallel channel on Gold chart on a daily. The market was respecting its boundaries for more than 3 months.
A bearish violation of its support was an accurate bearish signal that triggered a strong bearish movement.
Bearish Reversal Signal 3 - Change of Character & Bearish Price Action.
One of the main characteristics of a bullish trend is the tendency of the market to set new higher highs and higher lows. Each final high of each bullish impulse is always higher than the previous. Each final low of each bearish movement is also higher than the previous.
In such a price action, the level of the last higher low is a very significant point.
The violation of that and a formation of a new low is an important event that is called Change of Character CHoCH.
It signifies the violation of a current bullish trend.
After that, one should pay attention to a consequent price action, because CHoCH can easily turn into just an extended correctional movement.
If the market sets a lower high and a new lower low then, it will confirm the start of a new bearish trend.
That is the example of a confirmed Change of Character on Gold on a daily. To validate the start of a new bearish trend, we should let the price set a lower high and a form a bearish impulse with a new lower low.
Bearish Reversal Signal 4 - Death Cross.
Death cross is a strong long-term bearish reversal signal that is based on a crossover of 2 moving averages.
On a daily time frame, it is usually based on a combination of 2 Simple Moving Averages: one with 50 length and one with 200 length.
The signal is considered to be confirmed when a 50 length SMA crosses below 200 length SMA.
It is commonly believed that it signifies that the market enters a long-term bearish trend.
On the chart, I plotted 2 Moving Averages. When the blue one crosses below the orange one, a global bearish trend on Gold will be confirmed
The 4 bearish signals that we discussed will be useful for predicting short term, mid term and long term bearish reversals on Gold.
While price action patterns will indicate local bearish movements, Death Cross will confirm a global trend change.
Learn to recognize all the signals that we discussed to make more accurate trading and investing decisions.
❤️Please, support my work with like, thank you!❤️

Best Price Action Pattern For GOLD Trend Following Trading
This bullish pattern is very powerful .
Being spotted on a daily/4h/1h, any time frame, it will help you to accurately predict a strong bullish movement on Gold .
In this article, I will teach you to identify a buying volumes accumulation on Gold chart and as a bonus, I will show you how I predicted a recent bullish rally with this price action pattern.
The initial point of this pattern will be a completion point of a strong bullish impulse.
At some moment, the price finds a strong horizontal resistance, stops growing and retraces.
The second point of the pattern will be a completion of a retracement.
It should strictly be a higher low - it should be higher than the low of an initial bullish impulse.
After a retracement, the price should return to a horizontal resistance and set an equal high , that will be the third point of the pattern.
Then, the price should retrace AT LEAST one more time from a horizontal resistance and set a new higher low.
After that, the price should set one more equal high.
3 equal highs and 2 higher lows will compose a bullish accumulation pattern.
Please, note, that the price may easily set more equal highs and more consequent new higher lows and keep the pattern valid.
Above is the example of a bullish accumulation pattern on Gold on an hourly time frame. The price set 3 equal highs and 3 consequent higher lows.
This pattern will signify the weakness of sellers and the accumulation of buying volumes.
The point is that each consequent bearish price movement from a resistance is weaker than a previous one. It means that fewer sellers are selling from the resistance and more buyers start buying, not letting sellers go lower.
In our example, we can clearly see the consequent weakening, bearish price movements.
This pattern indicates a highly probable breakout attempt of the resistance. A candle close above that provides a strong bullish signal.
The broken resistance will turn into support and will provide a safe point to buy the market from.
In our example, the market broke the underlined horizontal resistance and closed above that. It indicates the completion of a bullish accumulation and a highly probable bullish trend continuation.
You can see that Gold retested a broken structure and then a strong bullish wave initiated.
In a strong bullish market that we currently contemplation on Gold, this bullish pattern will provide a lot of profitable trading opportunities.
No matter whether you are scalping, day trading or swing trading Gold, this bullish accumulation pattern will help you to predict long-term, mid-term and short-term bullish movements.
❤️Please, support my work with like, thank you!❤️

How to Find Key Levels on Gold XAUUSD Chart Easily
In this short article, you will learn how to find powerful levels on a gold chart.
I will explain to you what is a key level, how to apply it in trading. We will discuss key levels and different time frames, valid and invalid key levels. I will share with you a lot of useful trading tips.
First, let's start with a definition of a key level.
Key level is a single important historic price level on the chart,
from where a significant price movement initiated.
Usually, key levels are based on the edges of candlestick wicks.
Look at Gold chart on a 4H time frame.
I underlined a key level. You can see how strong was a bullish reaction to that. The price tested that level, bounced up and formed a long wick.
Key levels that are above current prices will be called resistances .
We will assume that sellers are placing their selling orders there.
Above is the example of a key resistance on Gold on an hourly time frame.
The price tested 2479 level, dropped rapidly and formed a long wick.
From a key resistance level, a bearish movement is expected.
Key levels that are below current prices will be called supports.
We will assume that buyers are placing their buying orders there.
That is the example of a key support level on Gold chart on a daily.
From a key support level a bullish movement is expected.
Key levels that are lying close to each other will compose support and resistance clusters.
Look at 2 key support levels on Gold on a 4H time frame.
These 2 levels are lying very close to each other and compose a support cluster.
3 key resistance above will compose a resistance cluster on Gold on a daily time frame, because these levels lye close to each other.
With time, the market tends to break key levels.
If the price violated a key support level and closes below that, it turns into a resistance level.
Look at a breakout of key support on an hourly time frame on Gold chart.
After a candle close below that, the broken key level turned into resistance.
If the price violates a key resistance level and closes above that, it turns into a support level.
Above is a recently broken horizontal resistance on Gold on a 4H time frame. After a breakout, that key level turned into support.
Key levels tend to lose their significance with time.
Key level that is broken by the buyers and the sellers or vice versa loses the status of a key level.
The underlined level was a significant resistance in the past.
However, the market stopped respecting this level and it lost its importance.
Remember that you can find key levels on any time frame.
But key levels are not equal in their significance.
Key levels that are spotted on higher time frame will be stronger than key levels that are spotted on lower time frames.
On the chart on the left, I underlined key support and resistance levels on a daily time frame on Gold.
While on the right, I market key support and resistance levels on a 4H time frame.
Daily structures will be considered to be more significant structures.
Hence, the market reaction to such structures tend to be stronger.
In comparison to support and resistance areas,
key levels provide the safest points to look for a trading opportunity from.
Once you spotted a confirmation after a test of a key level,
simply set your stop loss below a support or above a resistance.
You will have a very good reward to risk ratio.
Key levels play a crucial role in technical analysis of Gold.
No matter whether you are day trader, scalper, swing trader or investor, key levels is the first thing that you should always start your analysis from.
❤️Please, support my work with like, thank you!❤️
