Gold Recovers 1000 Pips Ahead of FOMC: Key Levels in Focus📊 Market Overview
After a sharp selloff that shook long positions, Gold has rebounded nearly 1000 pips, recovering from the 388x area toward 398x ahead of the upcoming FOMC meeting.
Despite the short-term recovery, Gold remains down around 3.5% this week, reflecting cautious sentiment as traders reposition before the Fed decision and amid fading U.S.–China trade tensions.
Currently, price is trading near $3,980–3,990 during the Asian session, consolidating under the psychological $4,000 zone.
💎 Technical Outlook (H1–M15)
Gold continues to trade within a short-term ascending channel, forming a corrective recovery inside a broader downtrend.
Immediate Support Zones:
• 3,961 – 3,937 → Trendline retest & OBS Buy Zone
• 3,918 → Structural invalidation area
Resistance & Key Reaction Levels:
• 4,018 – 4,085 → Mid-term key resistance
• 4,094 – 4,102 → Major Sell Zone (Fibo 1.5–1.618 confluence)
📍If Gold breaks and holds above 4,018, momentum could extend toward 4,085 – 4,102, where strong selling pressure may reappear.
📍If the price rejects at 4,094 – 4,102, expect a corrective move back toward 3,961 – 3,937, aligning with the channel base and trendline retest.
🌍 Macro Context – FOMC Ahead
Markets expect the Fed to cut rates by another 25bps, following September’s “risk management” cut.
However, if Powell’s tone turns hawkish, Gold could face renewed downside pressure as rate-cut expectations fade, particularly for December.
Conversely, a cautious or dovish tone emphasizing inflation risks and slower growth could boost Gold above $4,100 in the short term.
Meanwhile, easing trade tensions between the U.S. and China and the ongoing equity rally may continue to limit safe-haven demand.
🧭 Summary
Gold is holding a short-term recovery bias, yet the medium-term trend remains fragile ahead of the FOMC.
Expect volatility around the 4,000–4,100 zone, with the Fed statement likely to set the next major direction.
🛡️ Stay patient — liquidity builds before clarity, and key reactions around $4,094–4,102 will reveal the next macro impulse.
Goldtradingidea
‘10.29 Buy first below 3900 and then sell!Technical Analysis:
The first resistance area above is 3960-70. Maintain a short position below this level. If the market unexpectedly breaks higher, focus on the 3995-4005 area, which remains bearish. If the market weakens, the 3945-50 area, previously the starting point for the rally, has become a source of pressure after breaking below it today.
Key support areas below are the 20-day moving average (SMA) at 3865-70 and the 50% level at 3840-45.
Trading strategy: Maintain a short position on rebounds.
Participate in the 3960-70 area, targeting a new low. After a new low, consider entering long positions based on the 20-day moving average and the 50% level.
10.28 Gold continues to fall to 3970For the day, we will focus on the support at 3970. If it falls below, the price will continue to fall to 3950-3900-3850. In the short term, we will focus on the 4020 line and the resistance near 4060. After breaking through 4020, the price will continue to rebound and test the 4050-4060 line. However, the main strategy for the day is still to go short.
Strategy:
Go short near 4006-4010, defend 4021, and target 3970-3940-3900-3850
The second short position above is near 4054-4060, and the target position remains unchanged.
As for the long position below, it is at 3895 and 3870.

XAUUSD – Gold Trapped in Uncertainty Before the FOMC Market Overview:
Gold remains range-bound as US–China trade optimism tempers safe-haven demand, while expectations for further Fed rate cuts continue to weigh on the USD and cushion downside pressure.
The market is hesitant ahead of the two-day FOMC meeting this week, as traders await clear policy guidance before taking larger directional bets.
In short — macro tone is mixed:
Trade headlines reduce fear.
Fed expectations support gold.
Yet the chart shows indecision — a compression phase before expansion.
Technical Outlook (H1)
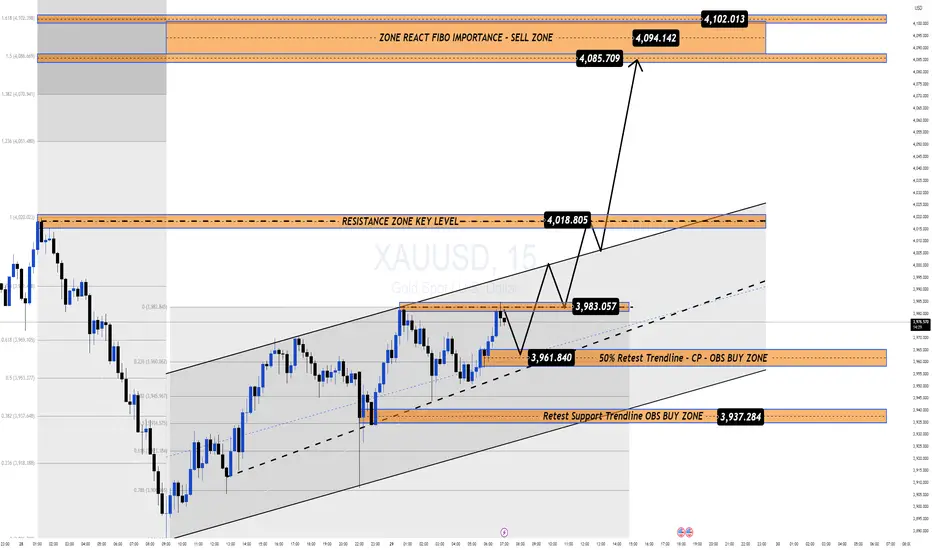
On the chart, gold continues to oscillate inside a tightening triangle, holding above the 4,050–4,060 Support Trendline (OBS BUY ZONE).
The liquidity structure shows buy-side absorption near the lows, while sellers remain active around the 4,186–4,260 resistance zones.
If gold maintains stability above 4,050, buyers may attempt to push toward the 4,107 neckline, and possibly test 4,186, before meeting the next supply layer at 4,260.
Conversely, a failure to hold support could expose the 4,002 and 3,930 liquidity pools below.
Key Technical Zones:
Support Trendline / OBS BUY ZONE: 4,058 – 4,050
Neckline / Local Resistance: 4,107 – 4,110
Reaction Zone (Fibo / Supply): 4,186 – 4,260
Deeper Liquidity Zone: 4,002 – 3,930
MMFLOW View – Plan for the Session
At this stage, the market is in accumulation mode.
As long as price stays above 4,050, MMFLOW maintains a neutral-to-bullish bias, focusing on how price reacts near the neckline at 4,107.
The ideal scenario would be:
A short-term pullback to absorb liquidity near 4,050,
Followed by a push toward 4,186,
Then a possible correction before the FOMC outcome.
However, if sellers manage to reclaim 4,050, a drop into 4,002 or even 3,930 could mark the next deep liquidity grab — setting up the base for a larger rally later.
Summary:
Gold remains stuck between macro hesitation and structural compression.
Liquidity is building on both sides — and the breakout direction will likely align with post-FOMC volatility.
🟡 Bias: Neutral-to-Bullish above 4,050.
Watch how the market defends 4,058 and reacts at 4,107–4,186.
📊 What’s your take — will FOMC give gold a reason to break free, or keep it trapped another week?
👉 Follow MMFLOW TRADING for daily structure breakdowns & institutional flow insights.
🟣 Chart: XAUUSD H1 – Smart Money Flow structure showing liquidity sweep, compression triangle, and Fibo confluence zones before the FOMC decision.

Gold daily K-line stopped falling, and the slow bull correction On Friday, the market corrected for 2 hours, finding support near 4045 on the lower 2-hour band, before retracing upwards. Next week, tomorrow, the 3-hour correction will gradually begin. Currently, the 3-hour BOLL is moving sideways, further oscillating within the range. Once the 3-hour correction concludes, the 4-, 6-, 8-, and 12-hour bands will begin to correct. Ultimately, the next bullish and bearish trend will unfold during this 4- to 12-hour correction.
On Monday, we'll initially focus on the 3-hour BOLL band range. Currently, the range is between 4155 and 4050. Within this range, the market will continue to fluctuate, with buy low and sell high being the primary strategy. Therefore, a buy low, sell high strategy within the 4155-=4050 range should be sufficient.
Technical Analysis:
1: The 3-hour correction is evident, with the BOLL range moving sideways, within the 4050-4155 range. Buy low, sell high is a viable strategy within this range.
2: The 4-hour Stochastic and MACD lines are both blunting, indicating a temporary sideways trend. The central axis of pressure is near 4145 .
3: In the daily K-line chart, the Stochastic is blunting and moving downward, signaling a bearish bias. The MACD is initially forming a death cross and moving downward, signaling a bearish bias. However, the central axis of the daily K-line is holding support, currently moving up to around 4085, followed by support around 4000.
Overall, the technical outlook suggests a range-bound trend within the 3-hour chart, followed by a gradual upward trend within the 4-hour chart, followed by a volatile upward trend within the daily K-line. This is the corresponding signal of the current market; but the specific approach is mainly to wait and see and respond as needed!
XAUUSD – CPI Cools, USD Weakens, and Gold Regains MomentumMarket Overview:
Gold has regained bullish traction after the latest US CPI report showed softer inflation data, leading to a weaker USD and renewed buying across metals.
CPI figures came in below market expectations (Core CPI 0.2% vs 0.3%, CPI m/m 0.3% vs 0.4%, CPI y/y 3.0% vs 3.1%), signalling lower inflation pressure and reinforcing bets that the Fed will stay dovish heading into November.
As a result, gold bounced strongly from the 4,050–4,058 support zone, reclaiming key structure levels and stabilising above 4,100 USD/oz.
Market sentiment remains risk-sensitive, but the short-term tone favours further upside correction, as long as gold holds above the trendline and liquidity support zones highlighted on the chart.
Technical Outlook (H2):
The market structure suggests gold has completed its correction phase and is attempting to form a new bullish leg.
Price action shows a clean rejection at the 4,050 liquidity base, and the next immediate objectives are the 4,211 neckline and 4,260–4,342 supply zones.
Key Technical Levels:
Support / Buy Zone: 4,058 – 4,002
Liquidity Sweep Zone: 3,930 – 3,940
Resistance / Neckline: 4,211
Sell Zone Reaction Fibo: 4,260 – 4,342
Trading Plan – MMFLOW View
🔹 BUY Zone #1 (Continuation Play)
Entry: 4,058 – 4,050
Stop Loss: 4,035
Take Profit: 4,155 → 4,211 → 4,260
🔹 BUY Zone #2 (Liquidity Sweep Scenario)
Entry: 4,002 – 3,930
Stop Loss: 3,915
Take Profit: 4,058 → 4,155 → 4,211
Ideal setup if price retests liquidity before CPI-induced recovery continues.
🔹 SELL Zone(Reaction Trade)
Entry: 4,260 – 4,342
Stop Loss: 4,355
Take Profit: 4,211 → 4,100 → 4,058
Weekly Bias & Summary:
With CPI cooling and the USD losing momentum, gold’s structure points to a recovery phase, possibly extending into Wave III of the medium-term cycle.
However, the 4,211 neckline remains the key pivot — a breakout above this zone could trigger momentum extension toward 4,260–4,340, while a rejection may result in another range-bound pullback.
🟡 MMFLOW Bias: Bullish while above 4,050 — dips remain opportunities to buy.
Macro tone favours risk-on rotation, supporting gold’s upside into next week.
📊 Do you think gold will break 4,211 for the next bullish leg, or is another correction incoming before the real move?
👉 Follow MMFLOW TRADING for daily institutional updates and Smart Money Flow structure.

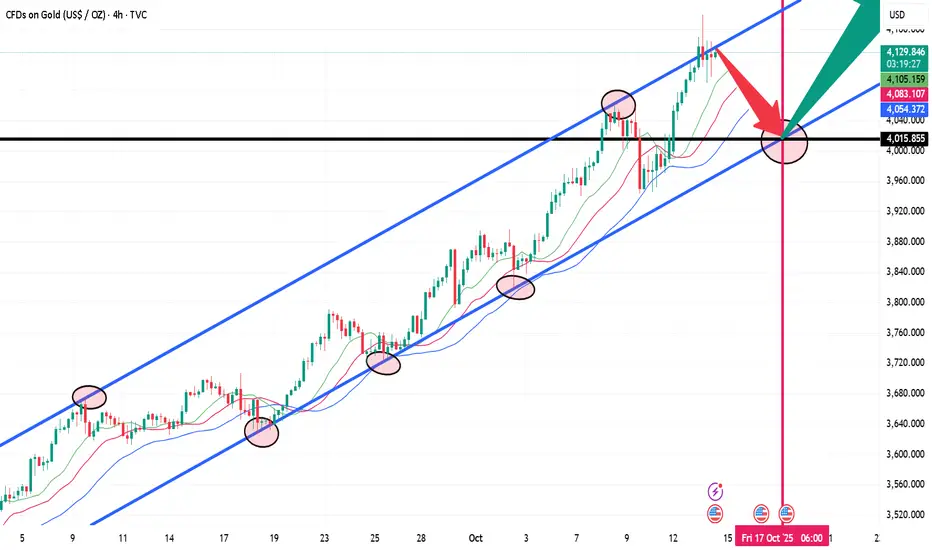
Beware of Black Friday as gold prices fall againOn Friday, the Asian session reaffirmed the upper resistance level of the channel at 4142-4144, further declining to 4081.
Can this trend continue, with the market holding highs and breaking lower, and breaking through the lower double-line on the hourly chart, the next support area to watch is the lower channel at 3990-3980.
The 3980 area is what we call the target point, representing a gap of exactly $400 compared to the historical high of 4380.
The hourly chart is sweeping the double-line range, with a breakout further opening up the market.
The upper channel is slightly further away at 4180, while the lower channel is getting closer. In the 4035 range
Support and resistance levels are shifting. If the market breaks below the lower double-line at 4035, the next target is the 4014-4004 low. The next target is the lower channel line, and breaking through it will continue the trend.
Holding highs is key, and breaking lows is crucial. Although the market fluctuates greatly, each initial move follows its own pattern.
Starting an uptrend, holding lows and breaking highs, holding lows throughout the process, and continuing the bullish climb.
Starting a downtrend, holding highs and breaking lows, holding highs throughout the process, and continuing the bearish decline.
To summarize, two points:
1. Maintain a cycle Regarding the rhythm of the decline, the area around 4100 should be considered as the dividing line. Looking down, we should look to the 4080 area. A break below this level could lead to further trading volume (don't expect a large rebound to confirm resistance).
2. A wide-ranging sweep, with the high of 4144 as a defensive measure, requires considering the 4133-4135 area, and then looking for leverage to complete a break below the lower low (this rebound will be more powerful, requiring additional attention to the highs).
Thus, regarding the future gold price, we should refer to the above-mentioned approach. First, the 4144 high should be used as a defensive measure. Here, we should consider the 4133-4135 area, and then look for leverage to complete a break below the lower low (this rebound will be more powerful, requiring additional attention to the highs). Pressure around 00: A slow decline is needed to break the lows. Time is used to buy space to find the lower band of the channel.
First, pressure at 4135 represents a correction. A break above 4080 will be leveraged to move lower, followed by a large-scale decline.
Focus on gains and losses at 4080. If it breaks below, the next target is the lower double line at 4035. Breaking through this level will lead to lower points at 4014-4004. Finally, focus on the lower band of the channel at 3990-3980.
Note: A break above this high will indicate a change in the nature of the market.
Clearly define your defenses, establish your strategy, implement risk control measures, and strictly enforce them.

Gold Stuck Near $4,100 Ahead of CPI Market Pulse:
Gold is holding steady around $4,100, caught between uncertainty and opportunity as traders brace for the US CPI release and new developments in US–China trade talks.
The yellow metal has paused its recovery from $4,050 → $4,160, while the US Dollar and bond yields edge higher amid renewed geopolitical tension and surging oil prices.
This is the classic “calm before volatility” moment — the market is simply waiting for data to decide the next wave.
If CPI comes in softer or trade talks disappoint, liquidity could flood back into gold, breaking above 4,155–4,160 and opening the path toward 4,215 → 4,261.
But a strong CPI surprise could flip sentiment fast — dragging price back into the 4,056 and 4,018 buy zones, where the next reaction will decide direction.
📊 Technical Outlook (M30)
Price continues to coil within a tight structure between 4,100 – 4,155, forming a “spring compression” right below trendline resistance.
Market flow suggests accumulation beneath 4,100, hinting that liquidity is building before the next expansion.
Key Structure Zones:
Resistance Pivot: 4,154 – 4,155 → Key breakout level
Breakout Support (CP Zone): 4,056 – 4,060
Liquidity Buy Zone: 4,018 – 4,020
Sell Zone (Fibo Reaction): 4,215 – 4,261
🎯 Trading Plan – MMFLOW Style
🔹 BUY PLAN – Reaccumulation Base
Entry: 4,056 – 4,060
Stop Loss: 4,045
Targets: 4,100 → 4,140 → 4,155
Focus on reaction candles & liquidity grab confirmation.
🔹 BUY PLAN – Liquidity Sweep Setup
Entry: 4,018 – 4,020
Stop Loss: 4,005
Targets: 4,056 → 4,100 → 4,150
If liquidity sweeps this zone clean, watch for a sharp recovery flow.
🧭 Summary – MMFLOW View
Gold is in “decision mode”, waiting for CPI and macro catalysts to trigger the next trend.
The structure stays neutral-bullish as long as price holds above 4,056.
A confirmed breakout above 4,155 may unlock a fast rally toward 4,215–4,260, while a break below 4,018 could open the door for one more liquidity flush.
⚜️ MMFLOW Bias: “No need to predict the move — just follow the flow when liquidity confirms.”
📊 Do you expect gold to break higher after CPI, or trap traders before reversing?
👉 Follow MMFLOW TRADING for daily flow-based setups, structure breakdowns, and institutional insights.

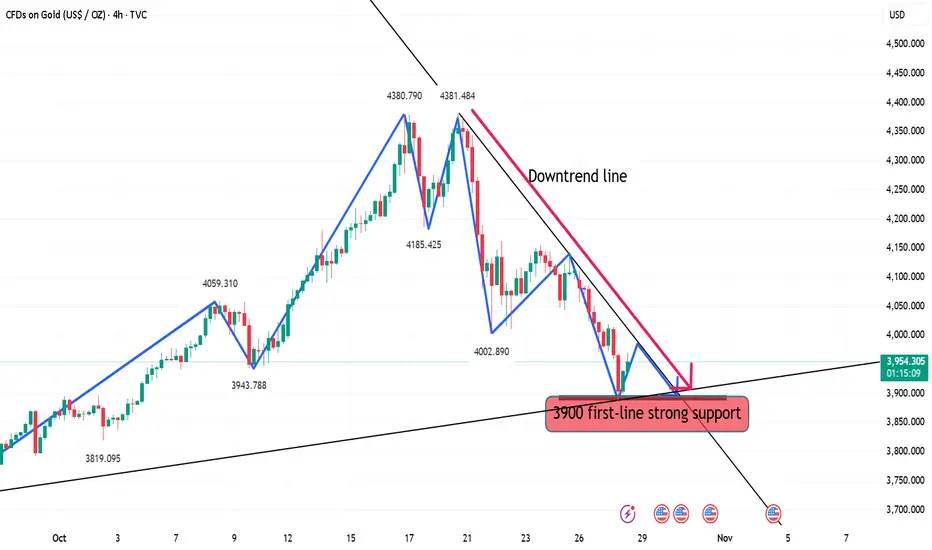
10, 23 gold is still expected to fall!!!This week, gold hit $4380 for the second time before retreating, forming a double top. The upward rebound was interrupted by a break below 4293. A break below the previous low of 4186 marked the first time a secondary decline has occurred, breaking the previous correction pattern. Previous declines have not resulted in a secondary break below the previous low, let alone a downward extension. Therefore, this time represents a shift in rhythm, a pause in the bull market, and a period of rest and consolidation. The bull market needs rest!
Short-term, yesterday's Asian session rebounded, reaching 4161 before retreating around 2:00 PM. Today, we will focus on the overnight rebound high of 4118 and the 2:00 PM timeframe. Specifically, relying on the resistance at 4118, we can short in the European session and continue to watch for a decline.
Specifically, keep an eye on the resistance at 4118 and consider shorting when the time is right.

XAUUSD – Waiting for a Breakout to Confirm the Next Bullish WaveGold remains under pressure, trading slightly below 4,100 USD/oz despite ongoing geopolitical tensions and weak global sentiment.
On the higher timeframe, the structure still respects its ascending channel, showing no signs of a deep breakdown yet.
During the early Asian session, renewed buying interest has started to emerge, supported by a stable inflow of safe-haven demand.
Technically, price is attempting to form a bullish continuation structure (Dow wave) around the 4,110 zone.
If a breakout above this key level occurs, gold could accelerate toward 4,155, and potentially extend into a corrective bullish wave targeting 4,220–4,260, aligning with the Fibonacci retracement confluence and the CP/OBS sell zone on the chart.
Technical Outlook (M30):
Price action suggests a potential wave recovery structure forming after last week’s steep decline.
The 4,155 level acts as a key inflection point — it will decide whether bulls regain control or bears push for another correction.
Key Levels:
CP Zone Up / Breakout Base: 4,053 – 4,055
Short-Term Key Level: 4,110 – 4,115
Mid-Level Resistance: 4,155 (structure pivot)
Fibo Sell Zone / Wave End Target: 4,220 – 4,263
Trading Plan:
🔹 BUY Setup #1
Entry: 4,020 – 4,018
Stop Loss: 4,010
Take Profit: 4,030 → 4,035 → 4,040 → 4,050 → 4,060 → 4,100
Bias: Reaccumulation Phase (structure support)
🔹 BUY Setup #2 (Scalp Play)
Entry: 4,053 – 4,051
Stop Loss: 4,043
Take Profit: 4,060 → 4,070 → 4,080 → 4,090 → 4,100 → 4,150
Note: Ideal for intraday traders watching the breakout base.
🔹 SELL Setup (Liquidity Reaction Zone)
Entry: 4,263 – 4,265
Stop Loss: 4,273
Take Profit: 4,255 → 4,250 → 4,240 → 4,230 → 4,220 → 4,210 → 4,200
Summary:
Gold continues to consolidate above 4,050, showing signs of early recovery after the recent 3,000-pip correction.
The 4,155 level remains the key pivot for short-term direction — a breakout here could confirm a Wave 3–5 recovery structure, while rejection could bring one more pullback.
Macro and geopolitical uncertainty still favour safe-haven flows, keeping the bullish scenario valid as long as 4,000–4,020 holds.
📊 What’s your take — will gold break above 4,155 to start a new bullish wave, or reject and extend the correction further?
👉 Follow MMFLOW TRADING for institutional-style updates and daily structure-based setups.

XAUUSD – Sharp 5% Drop as Traders Take Profit Ahead of US CPIMarket Context:
Gold (XAU/USD) slumped over 5.5% on Tuesday, marking its largest daily decline in months as traders took profits ahead of the upcoming US CPI data (October 24).
The US Dollar Index (DXY) rebounded 0.36% to 98.94, making gold more expensive for foreign buyers.
This correction also coincides with renewed optimism over potential easing of US–China trade tensions, after President Trump confirmed plans to meet Chinese leader Xi Jinping next week.
While this sharp move caught many traders off guard, it appears to be a healthy correction within a broader bullish structure, as investors remain cautious before major data and the upcoming Fed policy meeting next week.
Technical Outlook (M30):
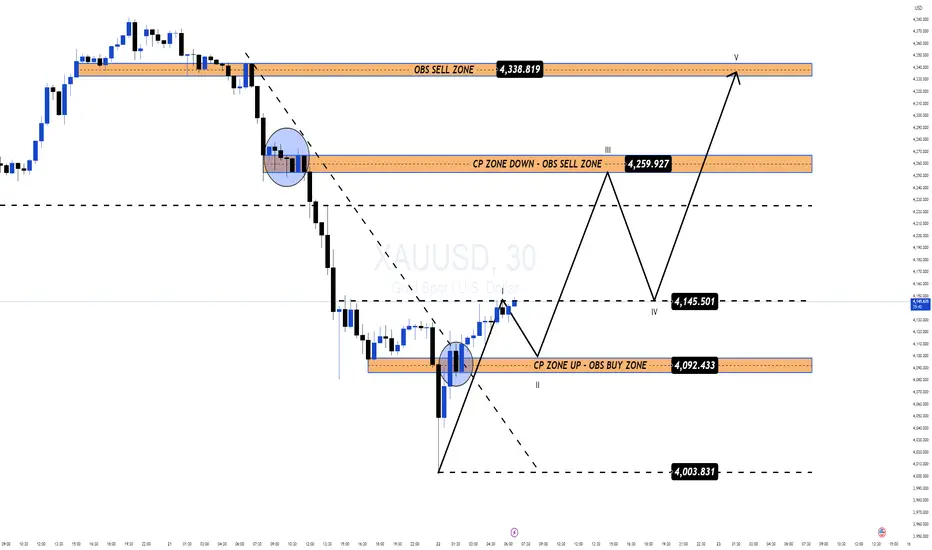
After the heavy selloff from the 4,375 high, gold found near-term support around 4,003 – 4,010, forming a potential accumulation base.
The pair now trades near 4,150, showing early signs of recovery toward key confluence zones.
Key Technical Levels:
OBS Sell Zone: 4,338 – 4,340
CP Zone Down / OBS Sell Zone: 4,259 – 4,260
CP Zone Up / OBS Buy Zone: 4,092 – 4,094
Deep Buy Zone: 4,003 – 4,008
The current structure outlines a 5-wave projection, where price may complete Wave II near 4,092, then advance toward Wave III at 4,259, followed by a correction (Wave IV) and another push toward Wave V near 4,338.
Trading Plan:
🔹 BUY ZONE#1 (Short-Term Recovery)
Entry: 4,092 – 4,094
Stop Loss: 4,080
Take Profit: 4,145 → 4,259 → 4,338
🔹 BUY ZONE #2 (Liquidity Sweep Scenario)
Entry: 4,003 – 4,008
Stop Loss: 3,990
Take Profit: 4,090 → 4,259
🔹 SELL ZONE (Countertrend Reaction)
Entry: 4,259 – 4,260
Stop Loss: 4,272
Take Profit: 4,145 → 4,092
Summary:
The recent 5% correction is viewed as a profit-taking phase ahead of CPI data, not a structural breakdown.
Gold is expected to stabilise above 4,092, with buyers likely stepping in near the OBS Buy Zone.
Focus remains on 4,259 for a short-term reaction and 4,338 as the next potential liquidity target if momentum continues.
📊 What’s your view — is this just a healthy retracement before CPI, or the start of a deeper shift?
👉 Follow MMFLOW TRADING for daily institutional-grade setups and smart money structure updates.

XAUUSD – Sharp 5% Drop as Traders Take Profit Ahead of US CPIMarket Context:
Gold (XAU/USD) slumped over 5.5% on Tuesday, marking its largest daily decline in months as traders took profits ahead of the upcoming US CPI data (October 24).
The US Dollar Index (DXY) rebounded 0.36% to 98.94, making gold more expensive for foreign buyers.
This correction also coincides with renewed optimism over potential easing of US–China trade tensions, after President Trump confirmed plans to meet Chinese leader Xi Jinping next week.
While this sharp move caught many traders off guard, it appears to be a healthy correction within a broader bullish structure, as investors remain cautious before major data and the upcoming Fed policy meeting next week.
Technical Outlook (M30):
After the heavy selloff from the 4,375 high, gold found near-term support around 4,003 – 4,010, forming a potential accumulation base.
The pair now trades near 4,150, showing early signs of recovery toward key confluence zones.
Key Technical Levels:
OBS Sell Zone: 4,338 – 4,340
CP Zone Down / OBS Sell Zone: 4,259 – 4,260
CP Zone Up / OBS Buy Zone: 4,092 – 4,094
Deep Buy Zone: 4,003 – 4,008
The current structure outlines a 5-wave projection, where price may complete Wave II near 4,092, then advance toward Wave III at 4,259, followed by a correction (Wave IV) and another push toward Wave V near 4,338.
Trading Plan:
🔹 BUY ZONE#1 (Short-Term Recovery)
Entry: 4,092 – 4,094
Stop Loss: 4,080
Take Profit: 4,145 → 4,259 → 4,338
🔹 BUY ZONE #2 (Liquidity Sweep Scenario)
Entry: 4,003 – 4,008
Stop Loss: 3,990
Take Profit: 4,090 → 4,259
🔹 SELL ZONE (Countertrend Reaction)
Entry: 4,259 – 4,260
Stop Loss: 4,272
Take Profit: 4,145 → 4,092
Summary:
The recent 5% correction is viewed as a profit-taking phase ahead of CPI data, not a structural breakdown.
Gold is expected to stabilise above 4,092, with buyers likely stepping in near the OBS Buy Zone.
Focus remains on 4,259 for a short-term reaction and 4,338 as the next potential liquidity target if momentum continues.
📊 What’s your view — is this just a healthy retracement before CPI, or the start of a deeper shift?
👉 Follow MMFLOW TRADING for daily institutional-grade setups and smart money structure updates.
XAU/USD – Gold Technical Rebound Prepares for Next Waveb]🔍 Market Context
After reaching a peak at the ATH GOLD 4,391 USD region, gold has undergone a technical correction — reflecting temporary profit-taking following a strong upward trend.
The market structure still maintains a bullish bias as the support zones below (FVG + OB) remain intact and untested.
Currently, the price is hovering around 4,325 USD, indicating that selling pressure has weakened.
Buyers are likely to return at two strategic zones below — where institutional money (Smart Money) typically accumulates positions before the next upward wave.
💎 Technical Analysis
ATH GOLD: 4,391 USD
Liquidity Zone $$$: 4,465 – 4,424 USD → the upper liquidity zone, the main target for the next upward wave.
FVG Zone: 4,284 – 4,267 USD → an unfilled gap, likely to be retested.
Order Block Zone: 4,244 – 4,230 USD → deep discount zone confluence with Fibo 0.786, high probability of strong reaction.
Liquidity Clear $$$: 4,186 – 4,190 USD → the last defense zone of the main upward trend.
Overall structure remains bullish ; the current decline is merely a phase of adjustment to “accumulate liquidity” before continuing the upward momentum.
📈 Trading Scenarios
1️⃣ BUY Setup #1 – FVG Zone 4,267 USD
Entry: 4,267 – 4,270
SL: 4,255
TP: 4,330 → 4,366 → 4,391
✅ Condition: Confirming bullish candle (rejection / engulfing bullish) at the FVG zone or a small BoS appears on M15.
➡️ Short-term “buy-the-dip” setup, leveraging the unfilled FVG zone — where technical buyers often initiate positions first.
2️⃣ BUY Setup #2 – Order Block Zone 4,244 USD
Entry: 4,244 – 4,230
SL: 4,210
TP: 4,284 → 4,366 → 4,391 → 4,424
✅ Condition: Strong confirming candle (engulfing bullish) or a retracement pattern breaking a small BoS back up.
➡️ Swing-buy setup at deep discount zone — confluence of OB + Fibo 0.786, high probability and optimal R:R.
⚠️ Risk Management
Avoid FOMO buying in the middle of the range (4,320–4,340).
Prioritize waiting for clear reactions at 4,267 and 4,244 before entering trades.
If the price closes an H1 candle below 4,210 → pause all buy orders, re-evaluate price action at 4,186.
Maintain moderate trading volume during the current rebound phase.
💬 Conclusion
Gold is in a phase of healthy technical correction within a major upward trend.
The two zones 4,267 USD (FVG Zone) and 4,244 USD (Order Block Zone) are key “accumulation” areas for large capital.
When bullish confirmation signals appear, these will be safe buy positions before gold heads back to the peak 4,391 – 4,465 USD .
👉 Reasonable Strategy:
Buy at 4,267 – 4,270 USD if reversal confirmation occurs.
Buy at 4,244 – 4,230 USD if a strong OB reaction signal appears.
🔥 “Smart money waits at precise levels — not at the top. The next gold wave will emerge between 4.267 and 4.244.”

Gold Holding Gains Ahead of Key US CPI DataGold extends its bullish momentum in early Asian trading, hovering near $4,370, supported by rate-cut expectations from the Fed and ongoing US government shutdown concerns, which continue to pressure the USD.
According to CME FedWatch, markets are now pricing in a 99% probability of another rate cut next week — a strong catalyst for gold bulls.
Lower interest rates reduce the opportunity cost of holding non-yielding assets like gold, reinforcing the medium-term uptrend.
However, all eyes are on the US September CPI report due later this week.
A hotter-than-expected reading could temporarily lift the USD and trigger short-term volatility in gold prices.
🔍 MMFlow Technical Outlook
Gold is currently consolidating around the $4,320–$4,370 range after reaching the ATH zone.
Price action shows a clear liquidity sweep at the highs, followed by a minor retracement — still within the bullish structure.
The main trendline remains intact, suggesting that any dip toward $4,305–$4,260 may attract new buyers.
⚙️ Trading Plan (MMFlow View)
BUY SCALP Setup
Entry: 4,302 – 4,300 (½ volume)
Stop Loss: 4,292
Take Profit: 4,310 → 4,315 → 4,320 → 4,330 → 4,340 → 4,350+
BUY ZONE (Swing)
Entry: 4,260 – 4,258
Stop Loss: 4,252
Take Profit: 4,265 → 4,270 → 4,280 → 4,290 → 4,300+
📈 Buy setups remain favored as long as price holds above 4,260.
Intraday sell reactions near 4,360–4,378 are short-term only — watch for liquidity grabs and bullish re-entry opportunities.
⚡️ Key MMFlow Zones
CP Down Zone / OBS Sell Zone: 4,360
ATH Liquidity Sell Zone: 4,448
Retest Trendline / OBS Buy Zone: 4,305
End FVG Uptrend / OBS Buy Zone: 4,260
Sentiment: 🟢 Bullish Bias
Bias Confirmation: CPI Data & Fed Rate Expectations
Strategy: Buy-the-Dip → Target Liquidity Above 4,370–4,380
🔥 Stay patient — let liquidity drive the next leg. MMFlow tracks smart money zones, not emotions.

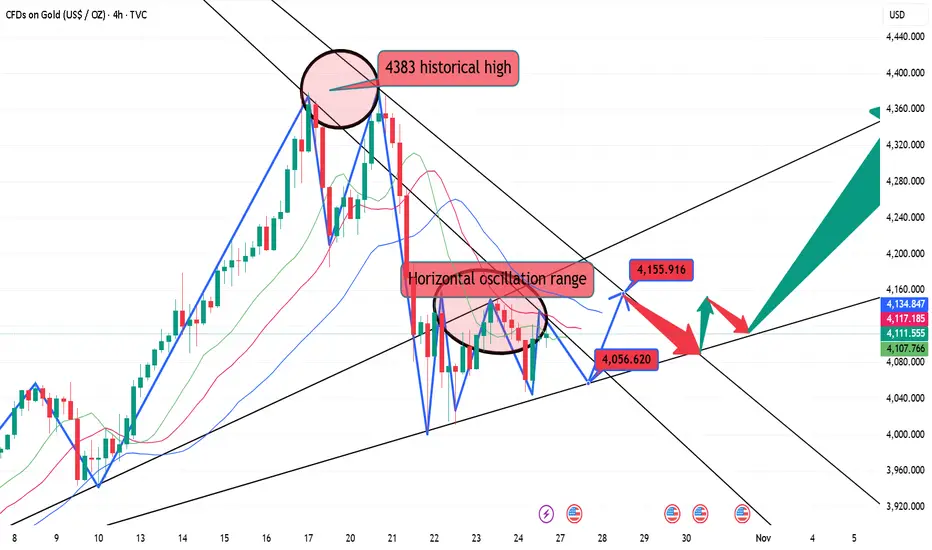
10.20 Gold short-term resistance looks at 4280Gold prices twice confirmed their all-time high of 4380 before falling, the first time by $100 and the second time by nearly $200.
Last Friday, gold prices were insane, plummeting from 4380 to 4279, leaving $100 of room for further gains, before rising another $100 to find 4380.
After confirming resistance at 4380 for the second time, the price continued to rise, signaling a downward trend. Pressure was placed on the short side at 4380, 4355, 4350, 4321, and 4364. The price continued to move around the established downward trend, gradually shifting between levels, and finally accelerating to 4186 before ending the decline.
The price rebounded in late trading, returning to the 4250 mark to end the week!
Judging from Monday's market action, the market has entered a broad range-bound sweep. Specifically, the bullish rally may have temporarily paused, gathering momentum for a subsequent rebound.
We must clearly understand the positioning of our defensive lines. When these lines are breached, adjustments and changes must be made:
1. Coordination between the two lines on the hourly and 30-minute charts
It has fallen back into the 30-minute chart's two-line range, between 4280 and 4110.
It remains above the upper limit of the two lines on the hourly chart, at 4221. Although it broke briefly last Friday, the closing price quickly recovered. Support is also being sought at 4221 in the European session this afternoon.
The upper limit of the two lines, 4280-4220, is where the support is being sought.
If the price breaks through this range, the nature of the market will begin to change.
2. Top and bottom reversal positions and Within the small channel, pressure is building up in the 4280-4385 area. The lower band is extending and expanding, focusing on the 4180-4200 range.
In the Asian session, prices fluctuated around the 4219-4271 range. In the afternoon, we confirmed that the 4268 area was beginning to bearishly bearish. Based on this strategy, we chose to enter a bearish position from above, targeting the 4220 area. Once the price started to move, we would aggressively chase the price, pursuing the bearish trend until it accelerated to the 4221 area.
Short-term strategies for the European and US sessions
1. Short-term trading in the 4278-4282 area, with the upper pressure at 4286, a stop-loss at 4298, and a target of 4250. The next target is 4225-4215.
2. After completing the $100 sweep, focus on the 4320 area for short selling. The specific target is a bit further out, so stay tuned for real-time alerts.
3. Currently, the price has returned to around 4260, so we will wait for the plan in the first point.

4,200 or 4,285? Gold’s Next Move Decides It All📊 Market Overview
Gold remains under pressure at the start of the week, trading below last week’s record highs, after a sharp correction from the 4,380s down to the 4,240 zone.
Investor sentiment is cautious as the market navigates a mix of uncertain U.S. economic data, a still-closed U.S. government, and renewed geopolitical tensions across multiple regions — all of which are fueling both fear and indecision in the market.
During early Asian hours, gold showed a mild recovery but continues to move sideways in a tight consolidation range, reflecting indecisive liquidity buildup before the next major move.
🧠 Technical Structure (MMFLOW View)
Gold is consolidating between short-term support near 4,206–4,204 and resistance around 4,285–4,287.
Liquidity has started to cluster above and below the current range, suggesting that a breakout is imminent.
The 4,166 – 4,140 region remains a major Smart Money re-entry zone, aligned with the CP BUY ZONE + OBS demand block.
On the upside, 4,313 – 4,342 stands as a key supply zone where large sellers previously stepped in.
Until price breaks out decisively, traders should expect choppy intraday conditions with limited follow-through.
🔑 Key Levels to Watch
🟢 BUY ZONE (Liquidity Re-entry Zone)
Zone: 4,206 – 4,204
SL: 4,200
TP: 4,210 – 4,215 – 4,220 – 4,230 – 4,240 – 4,250 – ???
🔴 SELL ZONE (Liquidity Reaction Zone)
Zone: 4,285 – 4,287
SL: 4,292
TP: 4,280 – 4,275 – 4,270 – 4,260 – 4,250 – ???
⚙️ MMFLOW Scenarios
1️⃣ Bullish Scenario:
If gold sustains above the 4,200 – 4,210 support area, a short-term rebound toward 4,270 – 4,285 can be expected.
Breaking above 4,287 would open room toward 4,313 – 4,342 (OBS Sell Zone), where Smart Money may begin distributing again.
2️⃣ Bearish Scenario:
A clean break below 4,200 could trigger a deeper retracement toward 4,166 – 4,140 (CP BUY ZONE).
This would still represent a healthy correction within the broader bullish macro structure.
⚡ MMFLOW Insights
Market remains neutral-to-bullish, but current movement reflects accumulation within a compression range.
Sideway structure indicates the market is loading liquidity for the next impulsive leg.
Patience is key — traders should wait for clean breakout confirmations before scaling positions.
⚠️ Trading Notes
✅ Use tight Stop Losses — gold’s volatility remains unpredictable during macro uncertainty.
✅ Avoid over-leveraging while price stays inside the sideway channel.
✅ Focus on reaction zones (CP, OBS, and liquidity sweeps) for precise entries.
🧭 Quick Summary
Gold trades sideways below record highs.
Key support: 4,206 – 4,204, key resistance: 4,285 – 4,287.
Short-term bias: Range-bound with bullish undertone.
Best approach: Buy dips at liquidity zones; wait for breakout confirmation before trend trades.

10.19 Gold Monday short-term analysis guide!Gold closed near 4247 on Friday. Following five consecutive daily gains, the market closed with a bearish candlestick pattern. Technical analysis suggests that gold prices are poised for a period of volatile correction. Without news stimulus, gold is expected to fluctuate within a range. Given the pullback from Friday's large bearish candlestick, Monday's focus should be on whether the decline can be sustained. If this trend isn't sustained, bulls are poised to launch a counterattack. Otherwise, gold is poised to enter a range of rebound resistance.
From the 4-hour market trend, short-term resistance is currently at 4280-4293, with a focus on 4315-23. Support is at 4185-4193. If bulls fail to achieve a sustained breakout, a period of volatile correction is imminent. Trading strategies should prioritize range-bound trading. In the middle, adopt a cautious approach, cautiously follow orders, and patiently wait for key entry points.

Trap Alert: Gold’s Pullback Could Fuel the Next Bounce!Gold continues to retreat in the short term, currently testing the strength of support at 4300. From the current technical perspective, although gold has repeatedly come under pressure at the 4370-4380 area, forming a multiple top structure in the short term, limiting upside potential in the short term, as gold continues to decline, the current resistance area has shifted down to 4235-4245.
Although gold is retreating under pressure, the overall bullish trend remains strong until it breaks below this key area. The current support structure after the top-bottom conversion lies in the 4290-4280 area. If gold cannot fall below this area during the pullback, then gold still has the potential to rebound to the 4230-4240 area. Therefore, even if we see gold prices continue to retreat, we should not rush to short gold during this pullback.
Instead, consider short-term trading:
We can continue to try to go long on gold with the 4290-4280 area as support. Of course, for short-term trading, the rebound target can be aimed at the 4320-4330 area!

GOLD Awaiting Sell Reaction at Peak & Buy Pullback Support🔍 Market Context
After a series of strong Break of Structure (BoS) , gold has reached a new ATH at 4,385 USD – marking a sustainable uptrend over the past 3 sessions.
However, this peak area is currently acting as a significant psychological and technical barrier . Buying momentum is temporarily slowing as the price reacts to the Liquidity Zone around 4,351 – 4,385 USD .
The market is in a phase of liquidity rebalancing .
The major trend remains upward, but the current price area may see a short-term correction before further wave expansion.
💎 Technical Analysis
ATH GOLD: 4,385 USD
Sell Liquidity Zone: 4,430 – 4,435 USD → high liquidity resistance zone, potential for short-term sell reactions.
Liquidity Zone $$$: 4,284 – 4,282 USD → nearby support zone, confluence with trendline.
Order Block | Fibonacci Zone: 4,226 – 4,230 USD → deep discount zone confluencing with Fibo 0.618, high reversal potential.
Overall Structure: remains bullish , but showing short-term signs of weakness as the price fails to hold above 4,360.
📈 Trading Scenarios
1️⃣ SELL Setup – Rejection at peak area 4,385 – 4,433 USD
Entry: 4,430 - 4,435
SL: 4,440
TP: 4,425 → 4,420 →4,415→4,410→4405
✅ Condition: Appearance of rejection or strong bearish engulfing candles at high Liquidity zone.
➡️ This is a liquidity reaction setup – sell when the price sweeps the peak and clear sell signals from major players appear.
2️⃣ BUY Setup #1 – Pullback at 4,284 – 4,282 USD
Entry: 4,284 – 4,282
SL: 4,272
TP: 4,290 → 4,300 → 4,310/Open
✅ Condition: Strong H1 candle reaction at support or minor reversal structure.
➡️ Buy with the main trend, taking advantage of a slight pullback around the support Liquidity zone.
3️⃣ BUY Setup #2 – OB Deep Zone 4,226 – 4,230 USD
Entry: 4,226 – 4,230
SL: 4,190
TP: 4,235 → 4,240 → 4,250/Open
✅ Condition: Appearance of bullish BoS or confirming bullish engulfing candle.
➡️ This is a deep discount zone, suitable for swing orders following the main trend.
⚠️ Risk Management
Avoid FOMO buying at high zones (4,360+).
Prioritize observing price behavior at 4,284 and 4,226 before entering orders.
Sell orders at 4,385–4,430 are only triggered if there is a clear confirmation signal.
Maintain moderate volume, avoid averaging down without confirmation.
💬 Conclusion
Gold is accumulating after reaching the peak of 4,385 USD , this is a crucial phase to determine the correction before the new upward wave.
The most effective strategy now is sell reaction at the high peak area 4,385 – 4,430 and buy with the trend at 4,284 – 4,226 USD when confirmation appears.
👉 Reasonable Strategy:
Sell Reaction: 4,385 – 4,430 → TP 4,284 – 4,226
Buy Pullback: 4,284 – 4,282
Buy OB Deep: 4,226 – 4,230

10.17 Gold bulls rose sharply and are about to enter the 4400 erLooking at the 4-hour market trend, the short-term support at 4290-4300 is currently under consideration, with a focus on 4270. The bulls are rising strongly and there is no end in sight. Trading strategies should focus on buying on pullbacks. For intermediate positions, be cautious in following orders and patiently wait for key entry points. I will provide detailed trading strategies during the trading session, so please pay attention.

10.16 Gold maintains the upward trend in the Asian session!!!From a multi-period analysis perspective, first observe the monthly chart's rhythm. From a long-term perspective, 3130 represents a watershed in the long-term trend. Above this level, consider a long-term bullish approach. From a weekly perspective, the current bull-bear watershed is 3585. Above this level, consider a medium-term bullish approach. From a daily perspective, focus on the 3997 support area for now. Above this level, consider a short-term bullish approach. From a four-hour perspective, which we've consistently emphasized, support currently lies at 4175. Above this level, consider a short-term bullish approach. On an hourly basis, prices are also currently bullish, but short-term divergence is occurring. Therefore, be mindful of short-term bullish risks in the event of further upward movement. Meanwhile, today's early trading session saw another surge in gains, with the early morning low serving as a watershed for the day. Above this level, consider a short-term bullish approach. Focus on the 4235-4266 area as an upward move.
Gold's Asian session low of 4199.73 marks the intraday watershed. Above this level, bullish momentum is expected to continue. (Also, a divergence is occurring in the hourly chart, so be aware of the risks associated with a short-term rally.)
10.15 Gold breaks high again, looking for retracement to continuAfter a significant bearish candlestick pattern, the gold price's hourly chart immediately took off with a bullish candlestick pattern in the Asian session, signaling a rebound from a bottoming out. The large bullish candlestick pattern at the bottom solidified the base, and the moving average took off again, also trending almost vertically upward. The candlestick pattern remained above the moving average throughout, demonstrating the unstoppable bullish momentum. The upper limit remains at 4200.
Intraday short-term trading strategy:
BUY: 4150 Stop-loss: 4142
Top 1: 4185
Top 2: 4200
10.14Gold bulls continue to exert their strength!!!Gold is currently stabilizing after a broad range-bound consolidation on the 4-hour chart. It experienced an unexpected intraday plunge, but the momentum has been minimal. A rapid intraday rise followed by a sustained decline could present an opportunity for a short position. The price has rebounded after retracing to previous support levels, and the K-line charts are still trading above the short-term moving average, suggesting a relatively strong trend in the short term. There are currently no significant technical patterns on the hourly chart. On the smaller timeframes, pressure is building on the short-term moving average, maintaining a weak trend. There may be some room for correction in the short term. Focus on the support level around 4005 in the short term.