GOLD DAILY CHART ROUTE MAPHey Everyone,
Please see our Daily chart idea, which had a strong candle body close above the 5030 axis level on Monday opening the long-range upside target at 5198.
On Tuesday, we saw a small corrective move back to test the EMA5, which acted as dynamic support. The bounce from EMA5 aligned perfectly with our plan to buy the dips, supporting continuation of the upward push.
Following Monday’s confirmation close, price delivered a move of over 500+ pips, reinforcing the bullish structure. A daily EMA5 lock above 5030 would further strengthen the bullish gap above and increase the probability of filling it.
We will continue to update as the chart structure unfolds.
Mr Gold
Goldtradingstrategy

XAUUSD H1 – Triangle Breakdown Confirmed | Sideway Range ResolvAfter several sessions of compression inside a symmetrical triangle, Gold has finally resolved the range with a decisive downside expansion.
The prolonged sideway structure between 5,070 and 5,020 has now transitioned into a momentum-driven breakdown, confirming liquidity sweep and structural shift on H1.
🧠 Market Structure Update
Multi-day sideway compression inside triangle
Liquidity resting above 5,070 and below 5,020
Strong impulsive candle broke below 5,043 and 5,020
Clean expansion through 5,000 psychological level
This is no longer accumulation — this is distribution confirmed.
Short-term structure has shifted bearish.
📌 Key Zones From Current Chart
🔴 Broken Support Zone – 5,043
Former triangle support
Now acting as intraday supply on pullback
Rejection here favors continuation lower
🔴 Major Supply – 5,000 – 5,005
Psychological level
Previous consolidation base
Now resistance if retested
🔵 Immediate Reaction Level – 4,956
Intraday retracement zone
Potential lower high formation area
🔵 Primary Demand / Liquidity Target – 4,882 – 4,885
Major liquidity pocket
Projected downside expansion objective
🎯 Trading Scenarios
🔽 Bearish Continuation Scenario (Primary Bias)
Condition:
Price holds below 5,000
Rejection at 5,000 or 5,043 supply
Entry:
On bearish rejection after pullback
Targets:
TP1: 4,956
TP2: 4,920
TP3: 4,882 liquidity zone
Structure favors continuation unless 5,000 is reclaimed with strength.
🔼 Counter-Trend Recovery Scenario
Condition:
Strong M30 close back above 5,000
Acceptance above 5,043
Targets:
5,070 prior range boundary
Without reclaiming 5,000, upside remains corrective only.
📊 Tactical Summary
Sideway compression has completed.
Liquidity sweep below range triggered momentum expansion.
Bias: Bearish while below 5,000.
Pullbacks into broken structure are opportunities, not reversals — unless reclaimed decisively.
From compression → expansion → continuation phase.

Gold H1: Trendline Retest Before the Next Impulse?Gold is pulling back into a key confluence zone while macro volatility remains elevated.
Is this a breakdown… or just a liquidity reload before continuation?
📊 Technical Overview (H1)
Overall structure: Higher highs & higher lows intact
Price broke below short-term support → now retesting ascending trendline
Current pullback approaching major H1 FVG demand
This is a classic trendline retest + imbalance reaction area.
🟢 Key Support Zone
Major FVG Demand:
4,800 – 4,820
This zone aligns with:
Ascending trendline
Prior bullish impulse origin
Liquidity resting below recent lows
If price sweeps liquidity into 4,805 and shows strong H1 rejection → bullish continuation probability increases.
🔴 Resistance & Upside Targets
Near-Term Resistance:
4,983 – 5,000
Expansion Target:
5,080 – 5,120
If bullish continuation confirms:
TP1: 4,983
TP2: 5,080
TP3: 5,120
❌ Invalidation
Sustained H1 close below 4,780
→ Trendline failure
→ Structure shifts to deeper correction

GOLD 1H CHART ROUTE MAP UPDATE & TRADING PLAN FOR THE WEEKHey Everyone,
Please see our 1h chart levels and targets for the coming week.
We are seeing price play between two weighted levels with a gap above at 4982 and a gap below at 4863, as support. We will need to see ema5 cross and lock on either weighted level to determine the next range.
We will see levels tested side by side until one of the weighted levels break and lock to confirm direction for the next range.
We will keep the above in mind when taking buys from dips. Our updated levels and weighted levels will allow us to track the movement down and then catch bounces up.
We will continue to buy dips using our support levels taking 20 to 40 pips. As stated before each of our level structures give 20 to 40 pip bounces, which is enough for a nice entry and exit. If you back test the levels we shared every week for the past 24 months, you can see how effectively they were used to trade with or against short/mid term swings and trends.
The swing range give bigger bounces then our weighted levels that's the difference between weighted levels and swing ranges.
BULLISH TARGET
4982
EMA5 CROSS AND LOCK ABOVE 4982 WILL OPEN THE FOLLOWING BULLISH TARGETS
5077
EMA5 CROSS AND LOCK ABOVE 5077 WILL OPEN THE FOLLOWING BULLISH TARGETS
5200
EMA5 CROSS AND LOCK ABOVE 5200 WILL OPEN THE FOLLOWING BULLISH TARGETS
5334
EMA5 CROSS AND LOCK ABOVE 5334 WILL OPEN THE FOLLOWING BULLISH TARGETS
5446
EMA5 CROSS AND LOCK ABOVE 5446 WILL OPEN THE FOLLOWING BULLISH TARGETS
5550
BEARISH TARGETS
4863
EMA5 CROSS AND LOCK BELOW 4863 WILL OPEN THE FOLLOWING BEARISH TARGET
4734
EMA5 CROSS AND LOCK BELOW 4734 WILL OPEN THE SWING RANGE
4600
4493
As always, we will keep you all updated with regular updates throughout the week and how we manage the active ideas and setups. Thank you all for your likes, comments and follows, we really appreciate it!
Mr Gold
GoldViewFX

XAUUSD H1 – Resistance Rejection and Pullback Toward Key SupportMarket Overview:
On the H1 timeframe, Gold faced strong rejection near the 5,090–5,100 resistance zone after completing a sharp impulsive move from the 4,680 swing low. The failure to sustain above resistance triggered a bearish retracement toward the 4,900 region.
Technical Structure:
A clear bullish impulse leg formed from 4,680 to approximately 5,120.
Price entered consolidation beneath the 5,100 resistance and failed to break decisively.
A lower high structure developed, followed by strong bearish momentum.
The ALMA (9) has turned downward, confirming short-term bearish pressure.
Key Levels:
Resistance Zone: 5,080–5,100
Immediate Support: 4,900–4,880
Major Support Zone: 4,850 area
Invalidation for Bears: Sustained move back above 5,100
Trade Scenario:
The current structure favors a corrective move toward the marked support zone around 4,880–4,850. If buyers defend this area and bullish confirmation appears, a potential rebound toward the 5,050–5,100 region could follow.
However, a clean H1 close below 4,850 would weaken the broader bullish structure and expose 4,800 as the next downside objective.
Conclusion:
Gold is undergoing a technical pullback after rejection at resistance. The 4,880–4,850 support zone is critical for determining whether this move is a healthy retracement within an uptrend or the beginning of a deeper bearish correction.

GOLD 4H CHART ROUTE MAP UPDATE & TRADING PLAN FOR THE WEEKHey Everyone,
Please see our 4h chart route map and trading plan for the week ahead.
We are now seeing price play between two weighted levels with a gap above at 5068 and a gap below at 4925. We will need to see ema5 cross and lock on either weighted level to determine the next range.
We will see levels tested side by side until one of the weighted levels break and lock to confirm direction for the next range.
We will keep the above in mind when taking buys from dips. Our updated levels and weighted levels will allow us to track the movement down and then catch bounces up.
We will continue to buy dips using our support levels taking 20 to 40 pips. As stated before each of our level structures give 20 to 40 pip bounces, which is enough for a nice entry and exit. If you back test the levels we shared every week for the past 24 months, you can see how effectively they were used to trade with or against short/mid term swings and trends.
The swing range give bigger bounces then our weighted levels that's the difference between weighted levels and swing ranges.
BULLISH TARGET
5068
EMA5 CROSS AND LOCK ABOVE 5068 WILL OPEN THE FOLLOWING BULLISH TARGET
5214
EMA5 CROSS AND LOCK ABOVE 5214 WILL OPEN THE FOLLOWING BULLISH TARGET
5375
EMA5 CROSS AND LOCK ABOVE 5375 WILL OPEN THE FOLLOWING BULLISH TARGET
5482
BEARISH TARGET
4925
EMA5 CROSS AND LOCK BELOW 4925 WILL OPEN THE FOLLOWING BEARISH TARGET
4823
EMA5 CROSS AND LOCK BELOW 4823 WILL OPEN THE FOLLOWING BEARISH TARGET
4700
EMA5 CROSS AND LOCK BELOW 4700 WILL OPEN THE FOLLOWING BEARISH TARGET
4592
EMA5 CROSS AND LOCK BELOW 4592 WILL OPEN THE SWING RANGE
4435
4297
As always, we will keep you all updated with regular updates throughout the week and how we manage the active ideas and setups. Thank you all for your likes, comments and follows, we really appreciate it!
Mr Gold
GoldViewFX

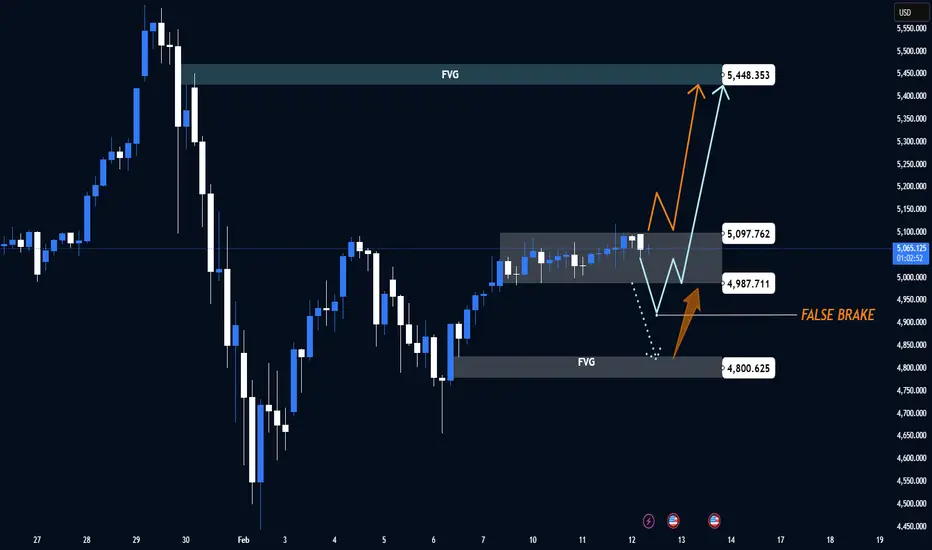
XAUUSD H1 – False Break or Expansion Toward 5,448?Gold is compressing beneath a major imbalance while macro uncertainty keeps volatility elevated.
This is a classic liquidity environment — either a fake breakdown to sweep stops or a clean expansion toward higher liquidity.
📊 Technical Structure (H1)
Short-term structure: Bullish recovery intact
Price holding above prior demand base
Consolidation forming under internal resistance
Market is trading between two major imbalances (FVG zones), preparing for expansion.
🟢 Key Demand & Support
Internal Support / Reaction Zone:
4,987 – 5,000
Major Demand (FVG):
4,800 – 4,820
This lower zone is critical.
A sweep into 4,800 followed by strong rejection = high probability false break setup.
🔴 Resistance & Liquidity Targets
Near-Term Resistance:
5,097
Major FVG Supply:
5,430 – 5,448
If bullish continuation confirms, price is likely targeting this upper imbalance.
🎯 Trading Scenarios
Scenario 1 – False Break (Liquidity Sweep)
Price dips into 4,800 zone
H1 closes back above 4,900
Then continuation toward:
TP1: 5,097
TP2: 5,430
TP3: 5,448
Scenario 2 – Direct Breakout
H1 acceptance above 5,100
Momentum continuation into upper FVG 5,430–5,448
Invalidation
Sustained H1 close below 4,780 → structure shifts bearish
🌍 Macro Context
Gold remains sensitive to:
Fed rate expectations
US Treasury yields
USD strength
Geopolitical risk flows
Any shift in inflation expectations or dovish Fed signals increases upside probability.
Stronger USD / rising yields may trigger the liquidity sweep first.
XAUUSD (Gold Spot) – 1H Chart Analysis & Trade IdeaMarket Structure
Gold has shifted into a short-term bullish structure after forming a higher low and reclaiming the key support zone. Price is consolidating above the former resistance, which is now acting as support—a typical continuation setup.
Key Levels
Support / Entry Zone: 5,000 – 5,030 (blue zone, prior resistance turned support)
Stop Loss: Below 4,950 (red zone, structure invalidation)
Target: 5,100 – 5,150 (green demand/supply objective)
Trade Idea
Bias: Bullish continuation
Entry: Buy on pullback into the support zone or on bullish confirmation above it
Stop Loss: Below the marked stop-loss zone to protect against a breakdown
Take Profit: Target the upper demand zone for continuation upside
Confluence
Break-and-retest of resistance as support
Higher low formation on H1
Momentum holding above the support line
Risk Management
Maintain disciplined position sizing. If price closes decisively below the support zone, the bullish setup is invalidated.
This idea is based on technical structure and zone analysis. Always manage risk according to your trading plan.

XAUUSD (Gold) – 1H timeframe, and the chart is structured
🔎 Market Structure
1️⃣ Overall Bias: Bullish
Price formed a V-shaped recovery from ~4,720.
Higher highs and higher lows are forming.
Price is trading above ALMA (moving average) → short-term bullish momentum.
Currently consolidating above previous resistance → potential breakout continuation.
📊 Key Zones on Your Chart
🟢 Demand Zone (Buy Area)
Around 5,135 – 5,150
Institutional support area.
Marked as BUY zone.
If price pulls back here, it’s a high-probability reaction area.
🔵 Resistance (Now Being Tested)
Around 5,085 – 5,100
Previously rejected price.
Now acting as breakout level.
If price holds above it → bullish continuation confirmed.
🔴 Stop Loss Zone
Around 5,000 – 5,020
Below structure support.
If price breaks this, bullish structure weakens.
📐 Fibonacci Extension Targets
From your fib projection:
🎯 1.618 → ~5,146
🎯 2.618 → ~5,237
🎯 3.618 → ~5,327
🎯 4.236 → ~5,384
Your primary target appears near 5,146 – 5,160, with extended targets above.
💡 Trade Idea (Based on Your Chart)
Option A – Breakout Continuation
Entry: Above 5,090–5,100 after confirmed close
Stop: Below 5,020
Target 1: 5,146
Target 2: 5,237
RR: Good structure-based RR if momentum continues
Option B – Pullback Entry (Safer)
Wait for retrace to:
5,050–5,060 (minor support), OR
5,135 demand zone if deeper pullback
Look for bullish rejection candle
Same upside targets
⚠️ What Would Invalidate This?
Strong bearish candle closing below 5,020
Failure to hold above previous resistance
Momentum divergence forming on 1H
🧠 What This Setup Represents
This is a:
Breakout → Retest → Continuation pattern
combined with Fibonacci extension targeting.
It’s a classic intraday bullish continuation structure.
If you’d like, I can:
Refine it into a scalping plan
Convert it into a swing trade plan
Or calculate exact position sizing based on your risk %**
Just tell me your account size and risk per trade.

Gold may consolidate short-term before a breakout.📊 Market Overview:
Gold (XAU/USD) is currently trading around the 5030–5050 USD/oz zone as the market awaits inflation data and policy signals from the Fed. The USD has weakened slightly, but US bond yields remain elevated, preventing gold from breaking out strongly and keeping the market in a consolidation phase.
📉 Technical Analysis:
• Key Resistance: 5055 – 5065 | 5100 – 5120
• Nearest Support: 5010 – 5000 | 4975 – 4960
• EMA: Price is trading above the EMA 09 on H1 but below the EMA on H4, indicating a short-term bullish bias while the medium-term trend remains mixed.
• Candlestick / Volume / Momentum: H1 candles show small bodies with decreasing volume → consolidation signal. RSI is around 55–60, not in overbought territory, suggesting room for upside but lacking strong breakout momentum.
📌 Outlook:
Gold may rise slightly or continue to move sideways in the short term if the USD does not strengthen and inflation data does not exceed expectations. However, a break below 5000 could trigger stronger downside pressure.
________________________________________
💡 Trading Strategy:
SELL XAU/USD: 5100 – 5103
🎯 TP: 40 / 80 / 200 pips
❌ SL: 5107
BUY XAU/USD: 5000 – 4997
🎯 TP: 40 / 80 / 200 pips
❌ SL: 4993

THE KOG REPORT - WeeklyWeekly chart:
Following on from our previous post based on the weekly chat, we have whipsawed both regions that we wanted, however, we have failed to breach the defence regions on either side. For that reason, we’ll stick with the chart and expect price to play the defence box immediately below for now, as well as the one above which lines up with the 4H chart, showing we need a weekly break above 5020-50 to then take that liquidity pool above.
Please do support us by hitting the like button, leaving a comment, and giving us a follow. We’ve been doing this for a long time now providing traders with in-depth free analysis on Gold, so your likes and comments are very much appreciated.
As always, trade safe.
KOG

Gold May Consolidate Short-Term Before Breakout📊 Market Overview:
Gold is trading around 5025 USD/oz as markets await new signals from US economic data and expectations that the Fed will ease monetary policy. A slightly weaker USD and ongoing safe-haven demand continue to support gold above the psychological 5000 level.
📉 Technical Analysis:
• Key Resistance: 5055 – 5100
• Nearest Support: 5000 – 4970
• EMA: Price remains above EMA 09, indicating a short-term bullish bias.
• Candlestick / Volume / Momentum: Gold is forming a range consolidation pattern with declining volume, suggesting a potential breakout. Momentum remains positive but slightly weakening.
📌 Outlook:
Gold may continue to rise if it holds above 5000 and breaks 5055; otherwise, a pullback is likely if 5000 is broken.
________________________________________
💡 Trading Strategy Suggestion:
🔻 SELL XAU/USD at: 5057 – 5060
🎯 TP: 40 / 80 / 200 pips
❌ SL: 5063
🔺 BUY XAU/USD at: 4975 – 4972
🎯 TP: 40 / 80 / 200 pips
❌ SL: 4969

We’re looking at Gold vs USD on the 1-hour chartPrice recently completed a deep pullback after a strong bullish leg.
That pullback formed a rounded / cyclical bottom (purple curve), which often signals trend continuation, not reversal.
🧠 Structure & Price Action
What stands out:
Higher low formed after the sell-off → bullish market structure
Strong impulsive bullish candles off the lows → buyers in control
Price reclaimed and is holding above a key mid-range level (~4960)
This tells us:
The correction phase is likely complete, and price is transitioning back into an impulse phase upward.
🎯 Trade Idea (Based on Your Chart)
✅ Entry
Buy around 4,960 – 4,970
This is a pullback entry inside bullish continuation
🛑 Stop Loss
Below the recent structure low
Around 4,840 – 4,860
If price breaks here, the bullish idea is invalidated
🎯 Target
5,050 – 5,100 zone
This aligns with:
Prior resistance
Projected impulse leg (measured move)
Liquidity resting above highs
Risk–Reward:
Roughly 1:2.5 to 1:3, which is solid for an intraday/swing setup.
🔍 Why This Setup Makes Sense
Bullish continuation after correction
Structure shift confirmed (higher low)
Strong momentum candles
Clear invalidation level (clean risk)
The blue projected path you drew fits perfectly with a pullback → continuation → expansion model.
⚠️ Invalidation Clue
If price:
Breaks and closes below the stop zone
Or starts printing lower highs + strong bearish momentum
→ bullish bias is off, and we reassess.

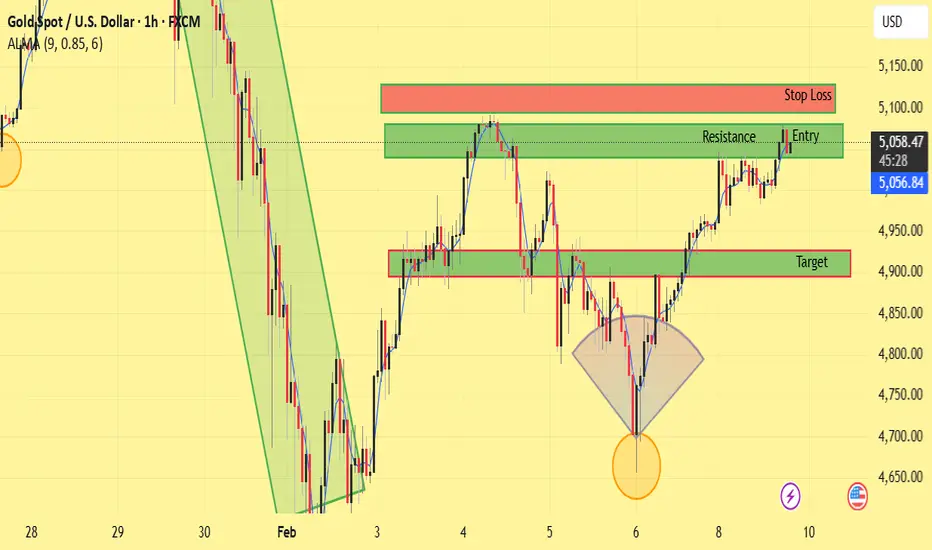
XAUUSD (Gold) – 1H Chart Analysis & Trade IdeaGold is currently trading within a short-term bullish structure after forming a clear reversal from the recent swing low. The price action shows higher highs and higher lows, supported by strong bullish momentum.
Technical Overview
Price previously sold off aggressively but found strong demand near the marked swing low, forming a V-shaped reversal.
After the reversal, gold broke above minor structure and continued to climb, confirming bullish continuation.
The current price is approaching a key resistance zone, which has been marked as the potential entry area.
This resistance zone also aligns with prior supply, increasing the probability of a short-term pullback.
Trade Idea
Entry: Sell from the marked resistance zone near 5,055–5,060
Stop Loss: Above the upper red zone (above resistance / liquidity area)
Target: The marked green demand zone around 4,900
Bias
Short-term: Bearish from resistance (pullback expected)
Invalidation: A strong bullish close above the resistance zone would invalidate the short setup and suggest continuation to higher levels.
This setup is based on support & resistance, market structure, and price reaction zones. Always wait for confirmation and manage risk accordingly.
XAUUSD H1 – Compression Before Expansion? Key Zones Decide Next Gold is coiling inside a tightening structure — volatility expansion is approaching
📊 Market Structure & Technical Outlook (H1)
Price is trading inside a symmetrical compression formed by:
Descending trendline from prior high
Rising demand trendline from February lows
Previous CHOCH + BOS indicate the bearish momentum has weakened
Current price is balancing, waiting for liquidity to be taken on either side
➡️ This is a reaction market — patience > prediction
🧱 Key Price Zones
🟢 Primary BUY ZONE (Demand)
4,860 – 4,835
Strong H1 demand
Reaction zone from prior impulse
Confluence with ascending trendline
🟡 Decision / Mid Zone
5,020 – 4,980
Structure pivot
Acceptance above favors upside continuation
🔴 SELL / Liquidity Zones (FVG)
FVG 1: 5,265
FVG 2 (Major Target): 5,350
🎯 Trade Scenarios
🔵 Primary Scenario – Buy the Dip
Look for bullish confirmation inside 4,860 – 4,835
Entry only after:
Strong rejection
Bullish H1 / M30 candle close
Upside Targets:
TP1: 5,100
TP2: 5,265
TP3: 5,350 (Major FVG + liquidity)
🔴 Alternative Scenario – Break & Fail
If price fails to hold above 4,835, expect deeper pullback toward lower structure
No blind buys below demand
❌ Invalidation
H1 close below 4,780 → bullish bias invalid
🌍 Fundamental Context
Gold remains sensitive to:
Fed policy uncertainty
Expectations around future rate cuts
Ongoing demand for safe-haven assets
With high-impact US events ahead, liquidity grabs and fake moves are likely before direction is confirmed

XAUUSD M30 – High Volatility Session | Trade by Zones, Not EmotiGold is trading in a strong volatile phase on M30 after breaking out of the descending channel and shifting into a short-term bullish structure. However, price is now entering a decision area, where fake breakouts and deep pullbacks are highly likely.
➡️ This is a two-way market: reactions at key zones will define the next move.
🧠 Market Context (M30)
Previous bearish channel breakout confirmed
Price is holding above the rising trendline → bullish structure still valid
Volatility remains elevated → expect deep pullbacks before continuation
Intraday Bias: Bullish above key demand, but not a straight move up.
📐 Key Zones on Chart
🔴 Supply / Resistance Zones
5,046 – 5,050
→ Major intraday supply & trendline confluence
4,986 – 4,990
→ Short-term resistance / reaction zone
🔵 Demand / Support Zones
4,952 – 4,945
→ Intraday demand, pullback buy zone
4,891 – 4,880
→ Strong demand + structure support (critical zone)
🎯 Trade Scenarios
🔵 BUY Scenario – Demand Reaction (Preferred)
Only consider buys after clear bullish confirmation (rejection wicks, strong M30 close).
Buy Zone 1: 4,952 – 4,945
Buy Zone 2: 4,891 – 4,880
Targets
TP1: 4,986
TP2: 5,046
TP3: 5,080 – 5,100 (extended if momentum holds)
🔴 SELL Scenario – Supply Rejection (Counter-trend)
Short only if price fails to hold above supply and shows bearish rejection.
Sell Zone: 5,046 – 5,080
Targets
TP1: 4,986
TP2: 4,952
TP3: 4,891
❌ Invalidation Levels
M30 close below 4,880 → bullish structure breaks
Clean breakout & hold above 5,080 → bearish scenario invalid

Gold May Continue Rising as the USD Weakens📊 Market Overview:
Gold surged strongly and remains above the 5000 USD/oz level as the US dollar weakened and expectations of Fed rate cuts increased, boosting safe-haven demand. Market sentiment remains risk-off amid ongoing macroeconomic uncertainties.
________________________________________
📉 Technical Analysis:
Key Resistance:
• 5035 – 5040
• 5065 – 5070
Nearest Support:
• 5000 – 4995
• 4970 – 4965
EMA:
• Price is trading above EMA 09 → short-term trend remains bullish.
Candlestick / Volume / Momentum:
• H1 candles show bullish bodies with short lower wicks → buyers are in control.
• Volume increased during the breakout above 5000 → confirming a valid breakout.
• RSI and momentum remain bullish but not overbought → further upside potential remains.
________________________________________
📌 Outlook:
Gold may continue rising in the short term if price holds above 5000 and no hawkish signals from the Fed or strong US economic data emerge.
________________________________________
💡 Trading Strategy:
🔻 SELL XAU/USD: 5039 – 5042
🎯 TP: 40 / 80 / 200 pips
❌ SL: 5045
🔺 BUY XAU/USD: 4999 – 4996
🎯 TP: 40 / 80 / 200 pips
❌ SL: 4993

XAUUSD (Gold) – 1H Chart Analysis & Trade IdeaGold has completed a strong corrective phase after the sharp bearish impulse and is now showing signs of trend reversal and bullish continuation. Price respected the recent swing low (marked with the circle), forming a higher low, which confirms improving market structure.
After the rebound, price pushed above the short-term moving average and successfully retested a key demand zone, which now acts as support. This area aligns with previous consolidation, increasing the probability of bullish continuation.
Trade Idea
Entry: Buy from the highlighted green support / entry zone
Stop Loss: Below the red support zone (below recent higher low)
Target: Upper green resistance zone (prior supply area)
Technical Confluence
Higher low formation (bullish structure shift)
Strong rejection from demand zone
Moving average support holding
Previous resistance turned support
Favorable risk-to-reward setup
Conclusion
As long as price holds above the stop-loss zone, the bullish bias remains valid. A sustained move toward the marked target zone is expected. A break below support would invalidate this setup.
This analysis is for educational purposes only. Always manage risk properly.
If you want, I can also:
Rewrite this in short TradingView post style
Translate it into German, French, Spanish, Italian, Turkish, or Polish
Create a title-only version for quick posting

Gold (XAU/USD) using a combination of key technical levelsThis chart analysis is focused on trading Gold (XAU/USD) using a combination of key technical levels and a specific entry, stop loss, and target strategy. Let’s break down the key components and ideas from the chart:
1. Price Structure and Trend:
The chart shows an overall sideways movement or consolidation pattern, with price moving within a certain range. It appears to be in a pullback after a prior upward move, with a possible bullish reversal expected from this point.
The purple curved line suggests the trader expects the price to rebound and move upwards, based on the price pattern and technical analysis.
2. Entry Point:
The entry point is marked at approximately 4,964.30, where the price is expected to start moving up. This level is significant because the price appears to be at a support zone (highlighted in green), and traders are looking for a buy position at this point, anticipating a breakout or reversal to the upside.
3. Target Level:
The target is identified around 5,080.00 (blue zone), where the trader expects the price to go if the trend continues upwards. This level is set with the idea of capturing potential profits if the price reaches or exceeds it.
The target area is likely determined based on resistance or past price highs, where the price has previously struggled to push higher.
4. Stop Loss:
The stop loss is placed around 4,840.00 (red zone). The stop loss is designed to limit potential losses if the price moves in the opposite direction of the trade (downwards).
The stop loss level appears to be just below a key support zone, ensuring that if the price falls below this level, it would signal that the bearish trend may continue, invalidating the trade idea.
5. Risk/Reward Setup:
The setup shows a favorable risk/reward ratio. The price has a chance to move up to the target (5,080.00) while limiting potential losses if the price falls to the stop loss (4,840.00).
If the trade is successful, the potential profit could significantly outweigh the potential loss, which is ideal for risk management.
6. Technical Indicators and Price Action:
The price action suggests that the market may be forming a double bottom pattern or similar reversal pattern near the entry point, signaling a potential shift to an uptrend.
The chart has a bullish bias, as indicated by the trader's setup for a long position and the price potentially breaking above resistance levels.
7. Conclusion/Trade Idea:
Buy near 4,964.30 (Entry Point) if the price shows signs of reversal or breaking through resistance.
Set a stop loss around 4,840.00 to manage risk.
The target is set at 5,080.00, expecting the price to reach this level if the bullish trend continues.
This setup relies on the idea that the market is in a bullish reversal phase, and the trader aims to profit from an upward movement.
This trading strategy focuses on technical analysis (support, resistance, price action) and aims to capitalize on the reversal after a pullback. The trader is positioning for a possible breakout and looking to manage risk using a well-placed stop loss.

XAUUSD H1: Structure Holds — Liquidity Pullback Before Next Leg Market Context (Macro)
Gold remains sensitive to Fed expectations, USD flows, and yields. With rate-cut uncertainty still unresolved, dips continue to attract defensive flows rather than aggressive selling. This keeps gold bid on pullbacks, especially at technical discount zones.
📊 Technical Structure – H1
Bullish structure remains intact after a clear CHoCH → BOS sequence.
Price is consolidating above the last BOS, suggesting pause, not reversal.
A pullback into FVG / demand would be technically healthy before expansion.
🎯 Key Trading Zones
🔵 BUY Zone (Reaction Area):
4,820 – 4,800
• FVG overlap
• Prior BOS base
• Fibonacci discount support
➡️ Look for H1 rejection or bullish reaction (no blind entries).
🎯 Upside Targets (Liquidity Objectives)
TP1: 4,985
TP2: 5,064
TP3: 5,325 (Major liquidity / swing target)
❌ Invalidation
H1 close below 4,760 → bullish structure weakened, reassess bias.

XAUUSD – High Volatility, Trading by Reaction Zones (M30)Gold is currently experiencing strong volatility on the M30 timeframe after a sharp rebound from the recent lows. At this stage, the market is no longer trending smoothly but is shifting into a liquidity-driven, two-way environment, where price reacts aggressively at key Supply & Demand zones.
👉 This is not a FOMO market. Priority should be given to trading by levels and waiting for confirmation.
📌 Market Context
The broader structure is still capped by a descending trendline from above.
The latest bullish leg shows active demand, but no clear trend reversal confirmation yet.
Price is ranging within a wide band, making liquidity sweeps on both sides highly likely.
➡️ Short-term bias: Neutral → trade reactions at key zones.
📊 Structure & Price Action (M30)
Price is consolidating between well-defined demand and supply zones.
Each touch of a zone has produced sharp reactions → ideal for short-term MMFlow-style trades.
No confirmed CHoCH yet to validate a sustained bullish trend.
🎯 Trading Plan – MMFlow Style
🔵 BUY Scenario – Focus on Demand Reactions
Only look for BUY setups after bullish confirmation (bullish candles / Higher Low structure on M30).
BUY Zone 1: 4,819 – 4,800
(Short-term demand, multiple strong reactions)
BUY Zone 2: 4,733 – 4,710
(Major demand zone + liquidity low)
Target Zones (TP):
TP1: 4,900
TP2: 4,955
TP3: 5,018
Extended TP: 5,100 – 5,105 (major supply above)
🔴 SELL Scenario – Supply Reaction Trades
If price rallies into supply and fails to sustain bullish momentum:
SELL Zone 1: 4,955 – 4,965
SELL Zone 2: 5,018 – 5,105
Downside Targets:
TP1: 4,900
TP2: 4,819
TP3: 4,733
❌ Invalidation Conditions
Strong M30 close above 5,105 → bearish structure invalidated, reassess overall bias.
M30 close below 4,710 → risk of deeper downside expansion.
🧠 Summary
Gold is in a high-volatility, structure-building phase. The edge comes from:
Trading precise price zones, not chasing candles
Waiting for clear confirmation
Prioritizing risk management over trade frequency
📌 In volatile markets, discipline always beats prediction.

THE KOG REPORT
THE KOG REPORT:
In last week’s KOG Report we said we would wait for the red box breach before making a decision on what trade and direction to take. We opened the week well, with a cut through the box defence, swooping the low we wanted and then bouncing. As you can see, we retested the hot spot and then the continuation took place from the flip, giving traders the opportunity to get in on the long trade.
It was during the week we started a small range hence we gave the immediate hot spots and the potential range we expected price to play in, which also worked well for us.
All in all a decent week in Camelot apart from NAS not quite playing ball with us.
So, what can we expect in the week ahead?
Looking at this chart we have a significant resistance level here above at the 5020 level which we will say is a key level of resistance for this week. Below, we have the support level pivot at the 4920 level which is also a pattern test region. If we do open clean, no gaps, glitches etc, we expect this to be the potential range for the early part of the week.
Immediate support stands at the 4920-10 level, so a test here and fail to breach, can give the opportunity to long back up to target the break of the 5000 level and potential to achieve 5020 which will be the first hurdle for bulls. We need a clean break above here with the flip in play to then target higher pricing with the red box sitting above.
Whether or not we clear all time highs or not remains to be seen, we still feel these is a huge chance we’ll either stop short and then see another profit taking event, or, we’ll fail and swoop those lows again.
Due to the price moving so aggressively and the ranges being so big, what would be a “tank” previously, is now just another day on the gold market. So please play caution, respect the market, respect the process of money and risk management, and above all, respect your account to make sure you stay in the game long enough to benefit from the swing that will come soon.
Again, let's play it day by day extreme level to extreme level.
RED BOXES:
BREAK ABOVE 4970 for 4989, 4999, 5002, 5010 and 5016 in extension of the move
BREAK BELOW 4950 for 4038, 4933, 4920 and 4006 in extension of the move
Please do support us by hitting the like button, leaving a comment, and giving us a follow. We’ve been doing this for a long time now providing traders with in-depth free analysis on Gold, so your likes and comments are very much appreciated.
As always, trade safe.
KOG

GOLD WEEKLY CHART MID/LONG TERM ROUTE MAPHey Everyone,
Please review our updated long-term weekly chart route map and trading plan.
The correction last Friday re-attached price to the EMA-5 detachment zone, which we have been tracking and highlighted with the blue circle. Keep in mind that the new weekly candle may also establish a fresh detachment range this week.
Last week’s strong upside move pushed price to a new all-time high (ATH), with the wick filling the upper Goldturns up to 5436. That wick has now defined a long-term retest zone.
A future confirmed close above 5436 would open the door for an extended range test toward the 5738 Goldturn.
At present, price is testing key support around 4631. A confirmed candle body close or a stronger EMA-5 lock will be required to activate the downside retracement range. Conversely, a fresh body close or EMA-5 lock above 4893 and 5181 would reopen the higher Goldturn targets again.
The safest way to pursue extended-range targets is through position building from pullbacks, riding the wave in a way that progressively reduces risk and allows the trade to become effectively risk free.
Discipline, patience, and structure continue to lead the way.
We’ll keep these long range timeframe structures in mind as we continue with our plans to buy dips.
We will keep you all updated as this chart idea unfolds.
Mr Gold
