CPI data is confusing,gold is fluctuating in a bearish directionGold Technical Analysis: Looking back at the recent trend, gold surged and then retreated on Tuesday, forming a shooting star pattern. However, the decline did not continue on Wednesday, indicating that the pullback was merely a one-off adjustment and lacks sustainability. It is a normal correction after a significant rally. Even if the market peaks, it will not be so simple. It will at least undergo a process of "high-level fluctuations turning bearish" or "second upward attack to lure more investors and then decline." In the short term, the rebound will continue to fluctuate, and it is unlikely to see significant rises or falls in a short period of time. Looking at the daily gold chart, the daily gold line has slowed down slightly. After continuous large volume, the daily line has turned into a small Yinxing candlestick pattern for consolidation. There is a need for a short-term pullback. Considering the short-term chart, the second high-point test failed to break through the previous high, the previous continuous large volume without a pullback, and the pressure from the second upward test. If there is no new high in the short term, there will be a partial correction around 3675-3657. The pattern will determine whether it is a deep pullback or a sideways consolidation.
Judging from the 4-hour gold chart, yesterday's gold price failed to achieve results in its attempt to rise again. There are signs of a downward correction. The 4-hour chart lost the middle track, breaking the unilateral upward momentum. At the same time, there is a need to further retrace to the lower track. Combined with the second high in the hourly chart near 3657, the second pressure turned into a decline. The strong market is to retrace and then break the high. Once the breaking power is stopped, it will go into a shock correction. Overall, today's short-term gold operation strategy recommends shorting on rebounds as the main strategy, and buying on pullbacks as the auxiliary strategy. The short-term focus on the upper side is the 3640-3650 resistance line, and the short-term focus on the lower side is the 3610-3600 support line.
Goldtradingstrategy
XAUUSD – CPI Today: Liquidity Sweep Scenario & Trading Plan📊 Market View
Gold (XAUUSD) is sliding under short-term resistance (descending trendline), showing sellers are still in control short-term. On the M30 chart, buy-side liquidity levels are clearly stacked: 3,624 → 3,612 → 3,599 → 3,586.
👉 During the European session, expect a breakdown liquidity sweep toward these support zones before any bullish reaction.
📈 CPI View – US Session
Soft CPI (below expectations) → Weaker USD, lower yields → Gold may bounce strongly from 3,612 / 3,599 / 3,586 and retest trendline/resistance.
Hot CPI (above expectations) → Stronger USD, higher yields → Gold may break 3,612, sweep deeper to 3,599 or 3,586, then recover.
⚠️ High risk of news traps: the first reaction can reverse quickly. Wait for retests + confirmation candles before entering.
🔑 Key Levels
Dynamic Resistance (trendline): 3,643 – 3,646
React Zone FIB: 3,650 – 3,654
OBS Sell Zone: 3,665
Support/Liquidity Zones:
3,624.36 (key zone support BUY)
3,612.60 (CP/React FIB)
3,599.31 (BUY ZONE)
3,586.49 (END LIQUIDITY – BUY ZONE)
📌 Trading Plan
🔴 SELL ZONE: 3,646 – 3,648
SL: 3,652
TP: 3,640 → 3,635 → 3,630 → 3,620 → 3,610 → ???
🔵 BUY SCALP: 3,612 – 3,610
SL: 3,605
TP: 3,616 → 3,620 → 3,625 → 3,630 → ???
🔵 BUY ZONE (Primary): 3,600 – 3,598
SL: 3,592
TP: 3,605 → 3,610 → 3,615 → 3,620 → 3,630 → 3,640 → ???
Backup BUY: (if liquidity sweep deepens) 3,58x
Hard SL: 3,578
❗ If 3,578 breaks, don’t rush to re-buy—CPI volatility can extend moves further.
⚠️ Notes & Risk
Reduce position size around the CPI release.
Always wait for confirmation (pin bar / engulfing / retest) before entering.
Use staggered TPs to lock in profits early.
An M30 close above 3,654 invalidates near-term shorts and opens 3,665.
✅ Summary
Gold could sweep liquidity into the buy zones before bouncing. Trade the reaction: SELL at 3,646–48 on rejection, BUY at 3,612/3,600 on clean bounce, and reserve backup BUY at 3,58x with tight risk.
👉 Follow MMFLOW TRADING for real-time updates and BIGWIN setups during CPI volatility.

GOLD ROUTE MAP UPDATEHey Everyone,
This is the 1H chart route map we tracked this week - played out beautifully to completion.
After hitting 3658, we saw no further EMA5 cross and lock, which led to the rejection. As expected, the lower Goldturns acted as support, giving us the planned dip-buying opportunities.
First, 3638 held as support with multiple bounces.
Then we got a cross-and-lock break below 3638, which opened 3613.
That target was hit and provided a support bounce back into 3638 today.
Right now, price action is playing between 3613 and 3638. An EMA5 cross and lock at either level will determine the next range.
We will keep the above in mind when taking buys from dips. Our updated levels and weighted levels will allow us to track the movement down and then catch bounces up.
We will continue to buy dips using our support levels taking 20 to 40 pips. As stated before each of our level structures give 20 to 40 pip bounces, which is enough for a nice entry and exit. If you back test the levels we shared every week for the past 24 months, you can see how effectively they were used to trade with or against short/mid term swings and trends.
As always, we will keep you all updated with regular updates throughout the week and how we manage the active ideas and setups. Thank you all for your likes, comments and follows, we really appreciate it!
Mr Gold
GoldViewFX

Gold trend analysis continues to rise after consolidationGold trend: Today, gold focuses on the impact of CPI data, which may impact the temporary technical view. Today, the Asian and European sessions maintain a low-long bullish trend, with support at 3620-3610 and short-term focus on 3645-3655. The US data has little impact, so it depends on the range. If the data has a large impact, focus on 3600 below and 3680-3690 above. Gold has risen unilaterally in two transactions and fluctuated for one trading day this week. The current high of gold is 3675, and the decline is only around 3620. Therefore, it is obvious that gold is rising slowly under the bullish trend, and even if it fluctuates, it will not fall much. Then, to determine the direction, we must look at the upward space under the direction. We still don’t guess the top, but under the influence of data, we still have to discuss whether there will be a change in direction or a shift in strength in the near future.
From a technical point of view, the daily line is still above the support of the 5-day moving average. If the 5-day moving average is not broken, there is no possibility of weakening. Although the 4-hour Bollinger Bands have closed, the middle track has not broken, and it is difficult to have a major adjustment. Therefore, the current market is still in a strong position. It is not clear whether gold has peaked or has a larger adjustment space. Therefore, if you want to trade, you still have to go long on the decline. So, today's market can be viewed in two steps. The European session is expected to fluctuate upward. Operate at key points and go long in the 3620-3610 support area below. Look at the 3645-3655 area above. If the US data has a greater impact, pay attention to the gains and losses of the 3600 key point below. It is still a good time to go long if it does not break.

CPI GOLD MAPPING ! CPI GOLD BUY AND SELL AREAS
SELL 3644 , 3667 (OB)
BUY 3571 , 3555 (FVG + OB)
BUY 3517 , 3497 (TS + RBS)
Good Luck With Your Trading 🤞

The decline is just an adjustment, gold still has new highsAccording to the strategy, we first arranged long orders near 3620, and the market rose smoothly to around 3650; then it fluctuated and consolidated, and according to the strength of the decline, we were prompted to go long again near 3640, and finally made a profit again near 3655, achieving two consecutive wins with open long orders, and reaping considerable profits overall. Congratulations to friends who have been paying attention. Many traders who blindly followed the trend and shorted in the market today are wailing, but we have always insisted on remaining unchanged in the face of change. After confirming the strong rhythm, we have made decisive and continuous attacks, steadily reaping profits, and the winning streak is still continuing.
Gold is fluctuating upward above the 3640 level. It is currently fluctuating around the 3650 level. The market's expectations for interest rate cuts have not cooled down. The market may continue to fluctuate at a high level in the later period. Although gold rebounded on Wednesday, it did not reach a new high. The main structure is still operating within the expected range. However, after the market has stood above 3650, it brings uncertainty to the trend. Therefore, gold is still treated with the idea of going long on pullbacks. Going long on pullbacks is still the general trend. In terms of operation, I believe that we will continue to go long as the pullback does not break.
From the 4-hour cycle, the bullish structure of gold remains stable. The short-term support below is around 3635-3625. The bullish strong dividing line has moved up to 3615. If this position is not broken, the pullback will rely on this area and continue to be bullish. At the daily level, as long as it stabilizes above 3615, the overall main tone of pulling back to low and long and following the trend will remain unchanged. In terms of operation, we should be patient and wait for the support to be confirmed. Low and long is still the general direction. As for the specific operation strategy of the counter-trend short position, I will remind you again at the key position, and everyone can pay attention to it in time.
Gold operation strategy: Go long when gold falls back to around 3640-3630, with the target at 3655-3660. Continue to hold if it breaks through.

Bulls vs Bears: Race to 3700 or 3600 ?!Currently, gold is fluctuating above the 3640 line. We can clearly see that gold has not effectively fallen below 3640 during multiple pullbacks in the short term. This proves that during the pullback period of gold, a lot of funds have entered the market, thereby pushing the gold price to fluctuate upward. However, during the upward fluctuation, gold encountered resistance and fell back in the 3655-3660 area many times, exacerbating the short-term volatility trend!
But we need to note that gold has rebounded since 3620 and formed a band-like low point structure; and it has tested 3640 many times and has not fallen below it, showing signs of forming a band-like secondary low point structure. Judging from the characteristics of the low point gradually rising, the current bullish force has a slight advantage, so short-term trading is still dominated by going long on gold.
Judging from the current structure, the short-term support area below is located in the 3635-3625 area, followed by the 3615-3605 area; and the short-term resistance is located near 3660. If gold breaks through the area near 3660 during the volatile upward process, gold may test the high point area near 3675. Once the high point near 3675 is refreshed again, it is expected to directly touch around 3700.
Therefore, it is not completely certain that gold has peaked at present, and we should not blindly chase short gold in trading; on the contrary, when gold retreats to the support area of 3635-3625, we can try to go long on gold, first aiming at the target area: 3660-3670, and once it breaks through this area, the target area will be postponed to the 3690-3700 area.

GOLD READY FOR FALL ! Ready To Fall The Gold !
It’s Enough ATH We Are Going To Drop Soon 3500 / 3400
Gold Respect The Resistance A Strong Resistance Its Now We Are Expecting Gold Bearish Momentum

Pay attention to the low-buying opportunities above 3630.Gold ultimately broke through the trendline, breaking out of its current high near 3657. During the European trading session, it fluctuated upward between 3648 and 3640. Therefore, if the price doesn't retreat below 3630 before the European session, the probability of an upward breakout will increase in this volatile upward trend. Therefore, the European session's lowest retracement near 3640 is a key bullish target for a second leg higher.
Gold operation suggestion: go long around 3640-3630, target at 3660-3675.

XAUUSD – PPI Ahead: Key Liquidity Levels & Trading Plan🚀 MMFLOW TRADING
Market View:
After yesterday’s sharp drop where sellers dominated the liquidity zone, gold (XAUUSD) is now recovering from 362x → 364x during the Asian session. In the short term, price may range between 362x–365x in Asia/Europe before going sideways to await the PPI release in the US session.
Today’s PPI is expected at 0.3% vs 0.9% previous, signalling cooling inflation. However, actual data could surprise higher – often creating a “news trap”. From a technical view, gold may need to revisit 360x liquidity before resuming its uptrend ahead of CPI & the upcoming FED meeting.
👉 In short: Structure remains bullish, but short-term liquidity sweeps are likely before any continuation move.
Key Levels:
Resistance: 3647 – 3654 – 3665 – 3674 – 3704
Support: 3635 – 3613 – 3600 – 3586
Trading Plan:
🔵 BUY Zone: 3600 – 3598
SL: 3592 (or tighter at 3580)
TP: 3605 → 3610 → 3615 → 3620 → 3630 → 3640 → 3650+
🔴 SELL Zone: 3703 – 3705
SL: 3710
TP: 3698 → 3694 → 3690 → 3680 → 3670 → 3660+
Summary:
✅ Gold remains in an uptrend, but may retest 360x liquidity before heading higher.
✅ PPI today & CPI tomorrow could act as a “news trap” – caution is required.
👉 Watch the key levels and follow MMFLOW TRADING for real-time updates & BIGWIN setups!

GOLD WEEKLY CHART MID/LONG TERM ROUTE MAPWeekly Chart Update
Please see update on our weekly chart idea.
Sunday we stated that we had the weekly body close above the channel top at 3576 and now opened the door to the larger 3659 long-term gap target.
- this target is now complete
We will now look for a close above 3659 for a continuation or failure to lock will follow with a rejection into lower levels for support.
🔹 Range Support Levels
3576 and 3482 now act as layered support levels to keep the bullish case intact within this range.
Updated Levels to Watch
📉 Support – 3482 & 3576
Key supports for this new range. Holding above 3576 strengthens the case for continuation toward 3659. A failure back below 3576 puts 3482 into play as the next defensive level.
📈 Resistance – 3732
This becomes the next upside objective if structure holds above 3659.
Thanks as always for your support,
Mr Gold
GoldViewFX

GOLD 4H CHART ROUTE MAP UPDATEHey Everyone,
This is a follow up update on our 4H chart idea that we shared Sunday stating that we still had the final gap in the range left.
EMA5 cross and cross and lock above 3561 left 3615 open.
- This target was hit this week now completing our 4H chart idea.
Keep an eye out for our NEW 4H chart idea with updated levels and route map.
BULLISH TARGET
3424 - DONE
EMA5 CROSS AND LOCK ABOVE 3424 WILL OPEN THE FOLLOWING BULLISH TARGETS
3499 - DONE
EMA5 CROSS AND LOCK ABOVE 3499 WILL OPEN THE FOLLOWING BULLISH TARGET
3561 - DONE
EMA5 CROSS AND LOCK ABOVE 3561 WILL OPEN THE FOLLOWING BULLISH TARGET
3615 - DONE
As always, we will keep you all updated with regular updates throughout the week and how we manage the active ideas and setups. Thank you all for your likes, comments and follows, we really appreciate it!
Mr Gold
GoldViewFX

How to correctly grasp the gold trading opportunities?Yesterday, the technical side of gold rose first and then fell. The overall gold price continued to rise strongly in the Asian and European sessions, and finally fell back in the U.S. session and fell into repeated fluctuations, and finally closed near 3628. The daily K-line closed at a high and then fell back and fluctuated in the middle. Yesterday, I kept notifying everyone that the technical side needed to retrace and not to be overly bullish on gold. Now everything is perfectly in line with expectations. Friends who follow me can see it. Today we continue to treat it with the idea of going long on retracements. After all, I believe that the trend has not reversed, and going long on retracements is still the general trend. Today, we will first focus on the short-term support at 3620-3610 below, and continue to go long if it retraces and does not break. If you encounter troubles in your current gold operations and want to make your investment journey more stable and avoid detours, please feel free to communicate with us at any time!
From the 4-hour level, today's short-term support for gold will focus on the 3620-3610 area, and the 3600 mark is the core dividing line between the strength of the bulls. If it retraces and stabilizes above this position during the day, the overall bullish thinking will remain unchanged. The main tone is still to go long on the retracement. At the daily level, as long as gold stabilizes above 3600, the low-long thinking will be sustainable. As for the counter-trend short positions, specific reminders will be given according to the pressure on the market at high levels. Brothers just need to pay attention to the bottom in time.
Gold operation strategy: Go long on gold when it retraces to around 3620-3610, target 3650-3660, and continue to hold if it breaks through.
GOLD M15 MAPPING / ZGMGold M15 Mapping Update Gold
If Gold Break The Resistance Then We Buy At 3650📈
If Gold Break The Support Then We Sell At 3603 📉
The Gold Have A Trendline With A Breakout We Will Sell At Reversal 3675 / 3687
Follow Us For More !

Gold - Buy or Sell this week??? (08-12/09)With the sustained accumulation over the past five months, gold has experienced a strong breakout from the $3,300 sideways range and reached a new all-time high around $3,600. The upward trend is clearly established. Therefore, we can consider buying and selling at the following price levels:
>>> SELL ZONE: 3684 - 3679
SL: 3689
TP: 3618 - 3596 - 3578 - 3565 - 3515
>>> BUY ZONE: 3560 - 3570
SL: 3550
TP: 3618 - 3678
Have a good day. Good luck buddies! :)

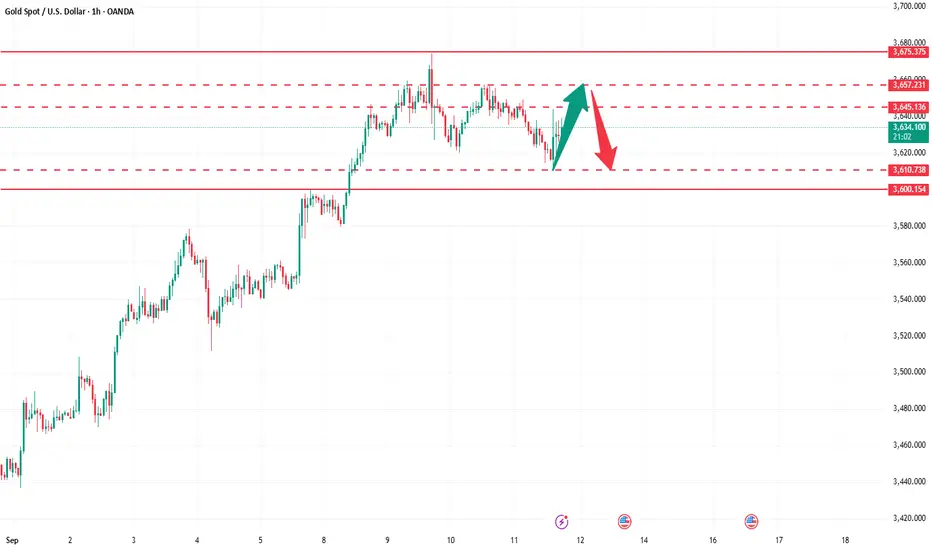
Intensifying Bear Grip: Can 3610–3600 Save the Bulls?Gold started to retreat from around 3675, and has now retreated to the lowest point of 3620-3610. According to the current market performance, we can clearly see that the rebound high point of gold after the retreat is gradually decreasing, and the control of the short position is further increasing. Yesterday, according to my trading model, my prediction that gold may usher in another 600pips retreat has been realized, and we have also won a big victory in the short transaction. It can be said that we have become the first echelon to reap the dividends from the short transaction. Then, will the high-rise building that the gold market has worked so hard to build collapse?
In fact, from a macroeconomic and technical perspective, gold's bullish trend remains intact, supported by expectations of rate cuts and safe-haven demand, which will, to a certain extent, limit any potential pullback.
From a capital perspective, some funds may be taking profits, but the current retracement is far from panic selling. Furthermore, as gold gradually retreats, a large amount of funds that have not yet entered the market in a timely manner may flow into the market, further pushing up gold prices.
From a technical perspective, after the pullback, the rebound high of gold has gradually moved down from 3655 to 3650 and 3640, while the retracement low has also moved down simultaneously. The current lowest has reached around 3620, and there are signs of further pullback. However, we need to note that in the short term, gold is still technically supported in the 3610-3600 area, while strong support is in the 3590-3580 area. Therefore, from a short-term perspective, the retracement space may not be sufficient, so I do not advocate shorting gold directly. On the contrary, we can wait for gold to rebound to the 3640-3650 area and then moderately consider shorting gold, because as gold gradually retreats, the 3635-3645 area has become the current short-term resistance area.
Therefore, for short-term trading, since gold has rebounded after touching 3620 many times, and is technically supported by the 3610-3600 area in the short term, we can consider starting to try to go long on gold in the 3620-3610 area; after gold rebounds to the 3635-3645 area, we can moderately consider shorting gold.

High-Level Consolidation: A Playground for Both Bulls and BearsToday, I clearly predicted that "cyclical patterns suggest a 600-pips drop in gold." Gold surged to around 3675 before retreating, reaching a low of around 3626, a fluctuation of 490 pips. It was very close to my expectation, so according to my trading model, I won a big victory in long and short trading today!
Day Trading Results:
1. First, we shorted gold near 3658 and closed the trade at TP: 3638, for a profit of 200 pips.
2. We shorted gold twice at 3655-3656, closing the positions manually at 3647 and 3645, respectively, for a total profit of 190 pips.
3. We shorted gold in batches near 3667 and 3673, closing the trade at TP: 3650, for a total profit of 400 pips.
4. We longed gold in batches near 3632 and 3628, closing the trade at TP: 3642, for a total profit of 240 pips.
Thus, today's total profit on both long and short trades was 1030 pips. I am very satisfied with today's trading model and results.
As for my view on the gold market in the future, I believe that the current gold market is still in an environment of interest rate cut expectations, and the macroeconomic background still has a significant supporting effect on gold. The current bullish trend of gold has not changed, and short-term fluctuations will not affect the overall direction. Therefore, before the interest rate cut is implemented (the Federal Reserve announces its interest rate decision on September 17), gold will still maintain an upward structure.
Judging from the candlestick chart, as long as gold remains above 3600, gold will remain in a bullish structure and maintain an overall upward trend. Although gold began to retreat after touching around 3675, and the bullish momentum no longer seems strong, I believe that gold has limited room for retreat in the short term. Even if the bulls no longer recover their previous strong momentum, gold is expected to maintain a high-level volatile trend, with the short-term support below at 3630-3620. If it is difficult for gold to fall below this area in the short term, gold may still hit the 3670-3680 area during the rebound.
Therefore, in the next short-term trading, if gold first retreats to the 3630-3620 area, we can consider trying to go long on gold, first looking at the 3650-3660 target area;If gold touches the 3670-3680 area again during the rebound, we can still try to short gold again, and the retracement target will first look at the 3655-3645 area.
GOLD Every Rise Has Its Sunset- From 2000 to today, gold has surged by an impressive 1000%, a remarkable performance for the world's leading asset.
- Keep in mind, every ascent is bound to face a descent someday.
- I’ll skip the deep dive into politics and fundamentals, but the picture is clear: with Trump winning the election, peace could make a comeback. Gold typically rises when fears of war spike, but as those fears ease, its value tends to drop.
- As always, the chart tells the story. Take a look at the Fibonacci levels— a prime buying opportunity is likely to emerge in the $1200 to $800 range.
- i will post in comments my older Gold Analysis.
Happy Tr4Ding !

GOLD ROUTE MAP UPDATEHey Everyone,
Another PIPTASTIC day on the charts for us with our 1H chart playing out as analysed with our final target completed today.
After completing 3593, 3613 and then 3638, we stated that we would now look for ema5 cross and lock above 3638 to open 3658. We got the lock and confirmation followed with the target hit - PERFECTION!!
We are now seeing rejection on this level and will use the lower Goldturns for support and bounce. If the range above opens further please review our daily chart and weekly chart updates with higher range levels to continue to track the movement until we update a new 1h chart.
We will continue to buy dips using our support levels taking 20 to 40 pips. As stated before each of our level structures give 20 to 40 pip bounces, which is enough for a nice entry and exit. If you back test the levels we shared every week for the past 24 months, you can see how effectively they were used to trade with or against short/mid term swings and trends.
The swing range give bigger bounces then our weighted levels that's the difference between weighted levels and swing ranges.
BULLISH TARGET
3593 - DONE
EMA5 CROSS AND LOCK ABOVE 3593 WILL OPEN THE FOLLOWING BULLISH TARGETS
3613 - DONE
EMA5 CROSS AND LOCK ABOVE 3613 WILL OPEN THE FOLLOWING BULLISH TARGET
3638 - DONE
EMA5 CROSS AND LOCK ABOVE 3638 WILL OPEN THE FOLLOWING BULLISH TARGET
3658 - DONE
BEARISH TARGETS
3562
EMA5 CROSS AND LOCK BELOW 3562 WILL OPEN THE FOLLOWING BEARISH TARGET
3528
EMA5 CROSS AND LOCK BELOW 3528 WILL OPEN THE SWING RANGE
3492
3470
EMA5 CROSS AND LOCK BELOW 3470 WILL OPEN THE SECONDARY SWING RANGE
3438
3408
As always, we will keep you all updated with regular updates throughout the week and how we manage the active ideas and setups. Thank you all for your likes, comments and follows, we really appreciate it!
Mr Gold
GoldViewFX

XAUUSD – M30 Intraday Trading Plan | MMFLOW TRADINGMarket Pulse:
The US jobs report confirmed a clear slowdown in labour market growth. According to CME FedWatch, there is now an 88% probability the Fed cuts rates by 0.25% in September, and 12% for a 0.5% cut. Lower rates reduce the opportunity cost of holding gold – fuelling demand further.
Gold has already gained 38% YTD, after rising 27% in 2024. A weaker USD, aggressive central bank accumulation (led by China, which extended purchases for the 10th consecutive month in August), loose monetary policy, and rising global uncertainty continue to build a solid base for this bullish trend.
👉 Bottom line: Macro flows + liquidity both favour the BUY side.
Technical View (M30):
Price is respecting the ascending channel, printing higher lows.
3616–3596 is the structural support; only a breakdown here shifts the trend.
Liquidity clusters sit at 3653–3655 and 3675–3677, likely to trigger short-term SELL reactions before the broader uptrend resumes.
Execution Plan (Today):
🔵 BUY ZONE: 3618 – 3616
SL: 3610
TP: 3624 → 3630 → 3635 → 3640 → 3650 → 3660 → 3670+
🔵 BUY ZONE: 3598 – 3596
SL: 3590
TP: 3602 → 3606 → 3610 → 3615 → 3620 → 3630 → 3640 → 3650+
🔴 SELL ZONE: 3653 – 3655
SL: 3660
TP: 3648 → 3644 → 3640 → 3635 → 3630 → 3620
🔴 SELL ZONE: 3675 – 3677
SL: 3681
TP: 3670 → 3665 → 3660 → 3650 → 3640
Summary:
✅ Bigger picture: Bullish trend intact – look for buys off liquidity support zones.
⚡ Short-term: take quick SELLs around liquidity resistance for intraday setups.
👉 Follow MMFLOW TRADING for precision plans: BUY with structure, SELL with liquidity.

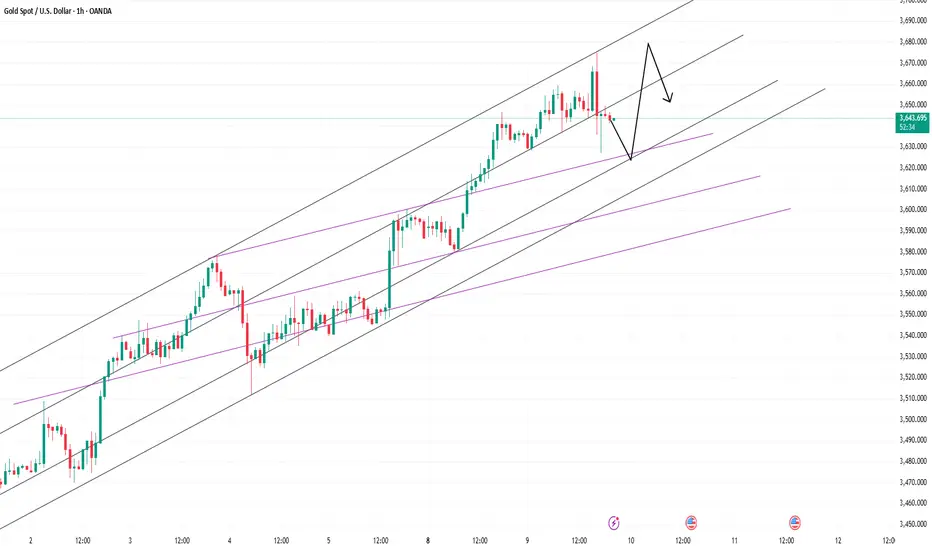
Gold’s Power Play: Bubble or Break?After gold touched around 3659 during the day, it retreated to our primary target area as expected: 3640-3630 area. In this short transaction, we actually made a profit of 200pips, which is a relatively good trade.
There is no doubt that gold is still in a unilateral upward trend and may continue to around 3670 in the short term, but at the current stage, I would rather wait and see on the sidelines than rush to chase the rise in gold, because I really don’t want to be hanging on a tree and swinging.
What is unstoppable is that I will still try to short gold by touching the top in the high area along the current trend line. Judging from the recent fluctuations, since I don’t have the courage to chase the rise of gold, in order to participate in market transactions, I will try to short gold based on the principle of touching the high point of the trend line. It is not too difficult to earn a profit margin of 100-200 pips in short trading. According to the current trend line constructed, the current upward extension space is around 3670, while the intraday high is around 3660.
Therefore, in short-term trading, we can still continue to try to short gold by using the short-term high point area of 3660-3670 as resistance. The primary short-term target is still the 3640-3630 area. Once gold falls below this area, the target area will be moved to the 3610-3600 area.

Cyclic Patterns Point to 600-Pip Downside in GoldUnfortunately, gold failed to reach the expected 3620 target area during the pullback. It only touched around 3628 in the early morning hours before rebounding again. During this period, because I saw that gold could not fall below 3628, and even could not fall below 3630 at one point, I promptly closed all short positions near 3630. Although the two transactions suffered losses due to the slightly lower entry price, because we added short positions near 3636 and 3646, the overall profit was still $10K.
Gold has now rebounded again and continued its upward trend to around 3657, continuing its upward trend. However, aside from opportunities to enter the long position in the 3630-3628 area, there are virtually no other good long entry opportunities. Judging from the current trend, gold still has the potential to continue to rise to around 3665, but since I missed the opportunity to enter the long position at 3630-3628, I will never choose to chase the rise of gold now.
Although the current uptrend is strong, even if you short gold, there are always opportunities to exit safely and profit during the day. Therefore, I still plan to try to short gold in the 3655-3665 area. Of course, keep my tips from yesterday in mind when shorting. When you first try shorting gold today, try to use a small lot size. When adding positions, you can appropriately increase the number of trading lots to increase the average price and increase profit margins. From a shorting perspective, it is relatively safer!
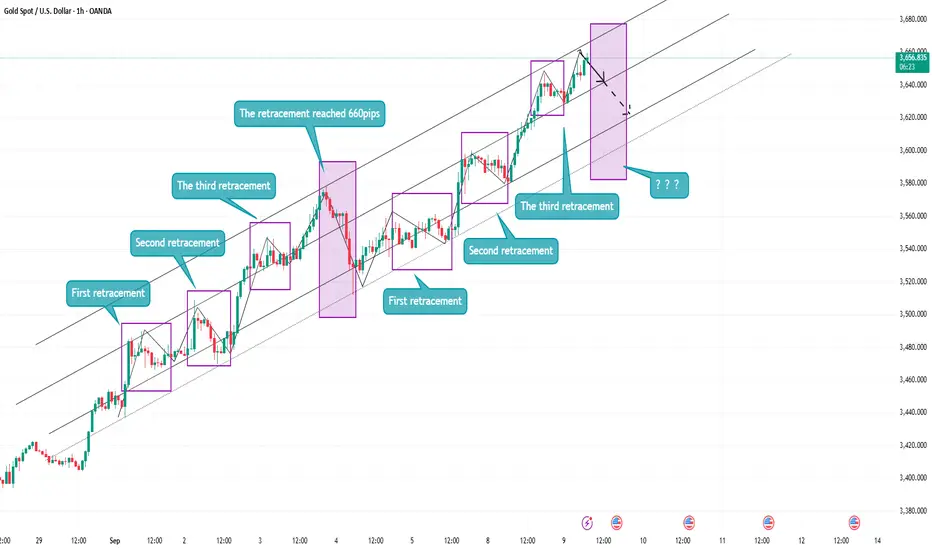
At present, I will pay close attention to the short-term support area of 3640-3630, followed by the area of 3610-3600. Don’t subjectively think that gold will not pull back to the 3610-3600 area, because in the previous band, after gold experienced three 200pips fluctuation retracements, the fourth retracement reached 660pips; and now gold has experienced three 200pips fluctuation retracements again. If it follows the cycle, gold may usher in another retracement of about 600pips, that is, reaching the 3610-3600 area.
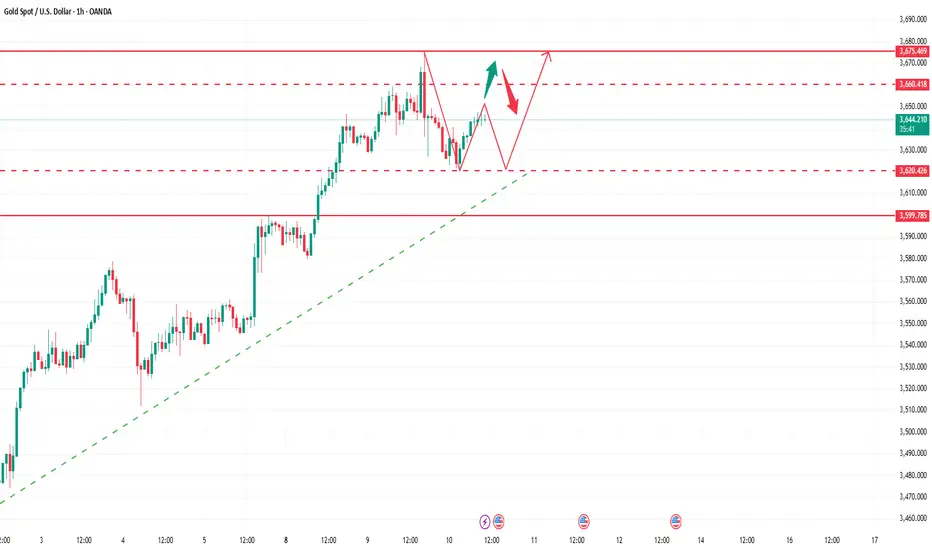
Breaking Free: How Bears Can Win Back in GoldAfter touching the trend line resistance area of 3640-3650, gold fell back as expected, showing a high "doji" in the hourly candle chart and signs of stagflation. It is expected to become a market turning point in the short term. The gold market may usher in a good correction in the short term due to this technical turning point. However, we need to note that as long as gold remains above 3580, the current situation is still a strong bullish pattern, so we must pay attention to the extent of the retracement.
As gold continues to rise, the current short-term support is at 3620-3610, so I think it is necessary for gold to retrace its support in this area. Once gold is supported in this area, it may rebound again and retest the high area of 3640-3650. If gold falls below the short-term support area of 3620-3610, then gold will further retrace its steps to 3590-3580, which is the lifeline of bulls and the dividing line between bulls and bears.
If gold falls below the 3590-3580 area during the backtest, the current gold bull advantage will no longer exist, and the bears will likely regain control of the situation. As most long funds take profits and the market experiences panic selling, gold will completely turn into a bearish trend and fall further.
At present, I still hold short position in gold, and first aim at the short target area: 3620-3610 area. Once gold falls below this area, the target area will be postponed to 3600-3590 area. I am currently holding my short position and have already realized some profits. I very much hope that gold will fall back to the target area as expected!
