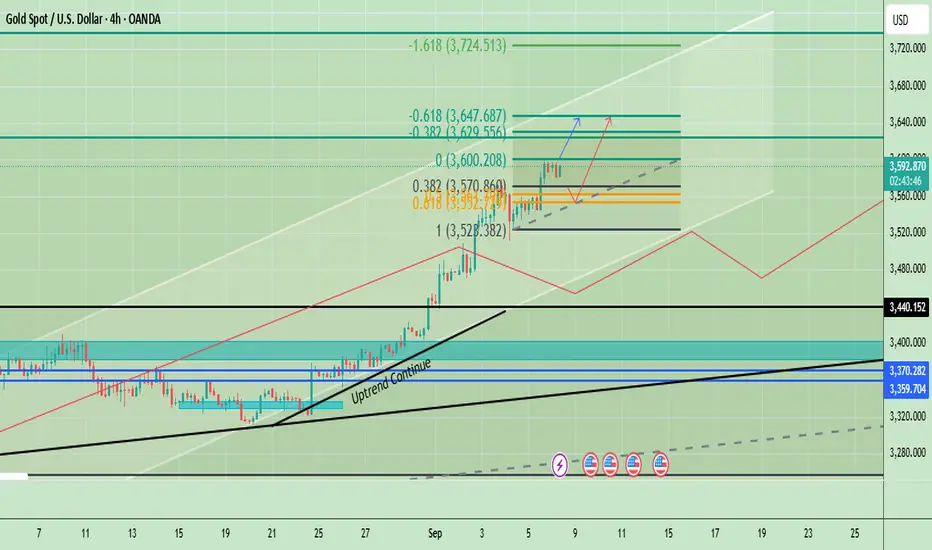
Gold Price Analysis | Fed Rate Cut Hopes & CPI Data in FocusGold is consolidating just below the $3,600 resistance zone, which is a critical pivot. The uptrend structure remains intact, and short-term retracements into the $3,570–$3,552 zone can provide a strong buy opportunity. A decisive break above $3,600 would trigger further bullish momentum toward $3,629, $3,647, and potentially $3,724. On the downside, a daily close below $3,528 would weaken momentum, while a drop under $3,440 would signal trend exhaustion.
Macro fundamentals support this bullish bias: weak U.S. labor data has boosted expectations for Fed rate cuts in September, while the upcoming CPI release on September 11 will be the key event. Softer CPI would confirm easing conditions and strengthen gold’s rally, while a hotter CPI could trigger a short-term pullback into support.
🔑 Key Levels
- Immediate Resistance: $3,600, $3,629 – $3,647
- Support / Buy Zone: $3,570 – $3,552, $3,528 (structural swing low support).
✅ Best Setup:
- Buy Zone: $3,570–$3,552
- Buy Trigger: Bounce from support or breakout above $3,600
- Upside Targets: $3,629 → $3,647 → $3,724
- Invalidation: Below $3,528
Note
Please risk management in trading is a Key so use your money accordingly. If you like the idea then please like and boost. Thank you and Good Luck!
Goldtradingstrategy
GOLD 1H CHART ROUTE MAP UPDATE Hey Everyone,
Great start to the week with our 1h chart idea playing out, as analysed.
We started with our Bullish target hit at 3593 followed with ema5 cross and lock opening 3613, which was hit perfectly. We then got a further ema5 cross and lock above 3613 opening 3638, also completed today - beautiful!!
We will now look for ema5 cross and lock above 3638 to open the range above or failure to lock above here will follow with a rejection into the lower Goldturns for support and bounce.
We will keep the above in mind when taking buys from dips. Our updated levels and weighted levels will allow us to track the movement down and then catch bounces up.
We will continue to buy dips using our support levels taking 20 to 40 pips. As stated before each of our level structures give 20 to 40 pip bounces, which is enough for a nice entry and exit. If you back test the levels we shared every week for the past 24 months, you can see how effectively they were used to trade with or against short/mid term swings and trends.
The swing range give bigger bounces then our weighted levels that's the difference between weighted levels and swing ranges.
BULLISH TARGET
3593 - DONE
EMA5 CROSS AND LOCK ABOVE 3593 WILL OPEN THE FOLLOWING BULLISH TARGETS
3613 - DONE
EMA5 CROSS AND LOCK ABOVE 3613 WILL OPEN THE FOLLOWING BULLISH TARGET
3638 - DONE
EMA5 CROSS AND LOCK ABOVE 3638 WILL OPEN THE FOLLOWING BULLISH TARGET
3658
BEARISH TARGETS
3562
EMA5 CROSS AND LOCK BELOW 3562 WILL OPEN THE FOLLOWING BEARISH TARGET
3528
EMA5 CROSS AND LOCK BELOW 3528 WILL OPEN THE SWING RANGE
3492
3470
EMA5 CROSS AND LOCK BELOW 3470 WILL OPEN THE SECONDARY SWING RANGE
3438
3408
As always, we will keep you all updated with regular updates throughout the week and how we manage the active ideas and setups. Thank you all for your likes, comments and follows, we really appreciate it!
Mr Gold
GoldViewFX

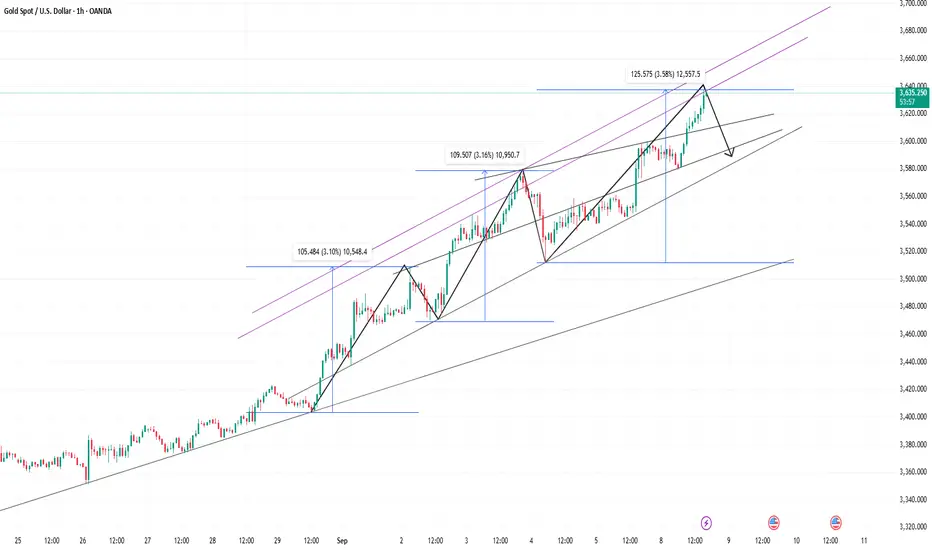
Turning the Tables: Bears’ Guide to Profit in GoldDriven by the dual influence of interest rate cut expectations and the job market, gold prices continue to rise and reach new highs. This is entirely a game played by big money at this stage. Buying sentiment in the gold market is currently so high that most of the time, there's no opportunity to even enter a long position. Therefore, after considering the possible phenomenon of "buying expectations and selling facts", while controlling risks, I carefully tried to short gold. Although I suffered losses frequently, I also made a good profit overall because I successfully captured the volatility.
Currently, gold continues to rise and has reached a high of around 3637. In fact, according to its wave pattern, gold may experience a pullback at any time. This is why I insist on shorting gold today.
The 1st wave: Gold rose from around 3405 to around 3508, a 3.1% increase with a fluctuation of $105.
The 2nd wave: Gold rose from around 3470 to around 3578, a 3.16% increase with a fluctuation of $108.
The current wave: Gold rose from around 3512 to its target of around 3637, a 3.5% increase with a fluctuation of $124.
According to the trend of price fluctuations, gold has reached and, to a certain extent, exceeded the previous two waves, so a pullback is possible at any time.
Furthermore, given that intraday fluctuations have been between $30 and $50 in recent days, and the intraday fluctuation of gold from around 3580 to around 3637 reached $57, a short-term pullback is highly likely.
However, because the bullish momentum of gold is strong, I will continue to try to short gold before a clear peak signal appears, but I may appropriately lower my expectations for gold's pullback, that is, appropriately lower my expectations for profit margins. My current short position entry prices are: 3612, 3621 and 3636. Basically, I add positions every time the fluctuation is 100-150pips. I currently hope that gold can retreat to the area around 3610-3600.
XAUUSD – Breakout in Action, Next Liquidity Zones AheadMarket View:
Gold (XAUUSD) has just broken out of consolidation, confirming bullish momentum. After the accumulation phase, price surged strongly, showing buyers remain in control. The focus now shifts to the next liquidity zones above, with upside momentum still dominant.
Key Levels (H1/H15):
Immediate Resistance: 3621 – 3633
Next Liquidity Sell Zone: 3649 – 3650
Extended Target: 3669 – 3678
Support: 3595 – 3580 – 3572
Technical Outlook:
Breakout confirms continuation of the bullish trend.
As long as price holds above 3595, the structure stays intact.
A clean break through 3621–3633 opens the path towards 3649–3669.
Trading Plan:
BUY (preferred):
Buy on retest around 3595–3600
SL: 3580
TP: 3621 → 3633 → 3649 → 3669+
SELL scalp (alternative):
Only if strong rejection occurs at 3632 – 3634
SL: 3640
TP: 3625 → 3630 → 3620
Summary:
✅ Breakout confirmed, bullish momentum remains strong.
👉 Watch 3621–3633 and 3649–3650 closely for the next trading opportunities.
Follow MMFLOW TRADING for more updates and execution setups!

XAUUSD – Weekly Plan: Bullish Bias with Key Levels Ahead MMFLOW TRADING PLAN XAUUSD
Market View:
Gold (XAUUSD) is moving exactly as projected in our weekly plan. After Nonfarm pushed price close to $3600/oz ATH, gold has been consolidating around the 357x–358x zone while holding the ascending trendline. Both the Daily and Weekly charts remain strongly bullish, showing no signs of profit-taking. This confirms that buyers are still in control, and the upside bias remains intact.
👉 However, with key US data (Core PPI, CPI, Jobless Claims, UoM Sentiment) coming up this week, short-term volatility is expected. Traders should watch closely how gold reacts around critical support and resistance zones.
Technical Outlook (H1 Chart):
Price is consolidating sideways, respecting the bullish structure.
Holding above 3574–3550 keeps the bullish momentum alive, targeting higher liquidity zones at 3620–3640+.
A break below 3530 could trigger a deeper pullback before buyers step back in.
Trading Plan:
🔵 BUY ZONE: 3552 – 3550
SL: 3544
TP: 3556 → 3560 → 3565 → 3570 → 3575 → 3580 → ????
🔵 BUY SCALP: 3573 – 3571
SL: 3567
TP: 3578 → 3582 → 3586 → 3590 → ????
🔴 SELL SCALP: 3598 – 3600
SL: 3604
TP: 3595 → 3590 → 3585 → 3580 → 3570 → 3560 → ????
🔴 SELL ZONE: 3631 – 3633
SL: 3638
TP: 3626 → 3622 → 3618 → 3614 → 3610 → 3600 → ????
Summary:
✅ Gold is respecting the bullish outlook from our weekly plan.
👉 Key levels to watch: 3592 (bullish trigger) and 3575 (bearish trigger). As long as price holds above 3550, the bias remains to the upside.
Follow MMFLOW TRADING for daily updates and execution setups.

Critical Zone 3610–3620:Shorts Get Ready!After retreating to around 3579, gold rebounded again and has now reached a high of around 3614. Fortunately, the gold retracement gave us the opportunity to safely exit our previous short positions, and we accurately seized this pullback opportunity to close all our previous short positions at a break-even point.
As I said, closing my short position does not mean that I am not optimistic about the gold pullback, but in the process of executing swing trading, we need to constantly adjust to make our short entry price more favorable to us. Therefore, closing the short position entered at a relatively low price previously gives us the flexibility to enter the short position again at a higher price.
Gold was quickly pulled up to around 3614 in the short term. There was almost no headwind in the short term. Driven by the dual expectations of interest rate cuts and risk aversion demand, the bullish momentum was strong. However, in the short term, we are currently facing the 3610-3620 trend line resistance area, so I still do not advocate continuing to chase more gold; on the contrary, no matter what, I will continue to try to execute swing trading to short gold in the 3610-3615 area.
Although the bulls have risen strongly, it does not actually provide a good position to enter the market to go long on gold. Since we cannot participate in long transactions, we can only try to short gold in waves during constant adjustments. On the premise of controlling trading risks, as long as we are not afraid of short-term floating losses, once gold begins to collapse, we will be the first traders to reap the benefits of the short position. Therefore, when gold is facing the trend line resistance area of 3610-3620, I first considered and executed a short trade at 3610-3615 as planned, hoping that the gold market will have a good retracement as some unsteady funds show signs of profit-taking!

Gold Price Outlook – Key Levels & Buy TriggerGold (XAUUSD) is holding its bullish structure within the upward channel, currently trading near 3531 after testing key support. The main buy zone lies between 3511–3524, where Fibonacci support and channel trendline align. A confirmed bounce and close above 3537 would trigger fresh buying momentum, targeting 3578, followed by 3619 and 3644. The overall trend remains bullish as long as 3511 holds, while a break below 3470 would weaken the outlook.
🔑 Key Levels to Watch:
- Immediate Support: 3511 – 3524. A strong confluence with the channel support makes this the main buy zone.
- Immediate Resistance: 3537, 3578
- Major Upside Targets: 3619, 3644
Invalidation: 3470 (previous swing low). If broken, the trend may weaken toward 3450.
Buy Zone: 3511 – 3524 (Fibonacci 0.618 & 0.5 retracement + channel support).
Buy Trigger: Bullish rejection or H1 close above 3537 confirming strength for upside continuation.
Note
Please risk management in trading is a Key so use your money accordingly. If you like the idea then please like and boost. Thank you and Good Luck!

Extended Pullback Ahead: A Golden Opportunity for ShortsDue to the stimulation of the NFP market, gold continued to refresh its historical highs, continued to break through the recent high of 3578, and touched the 3600 mark as expected. According to the current market structure, the bullish momentum of gold is strong, and there is no obvious peaking signal in the short term. As the center of gravity of gold continues to rise, the current short-term support will move up to the 3570-3550 area, and the short-term strong support is near the 3530 area.
However, in this extreme market, we shouldn't blindly chase gold at high levels to avoid being buried in a crash. Two key details emerge from this:
1. Gold experienced a significant pullback near 3578, retreating to around 3511.
2. Gold failed to hold above 3600 before Friday's market close, falling back to around 3586, indicating some profit-taking.
Furthermore, the current surge in the gold market is driven by news and, to some extent, has deviated from technical indicators. Market sentiment is extremely euphoric, making it vulnerable to a sudden collapse during this period. Furthermore, after this period of digestion, expectations of a rate cut have largely faded, potentially leading to a potential exit by large investors and panic selling.
Therefore, I do not think that chasing gold at high levels is a rational and correct strategy. Gold may still retrace to the 3570-3550 area in the future, or even continue to retrace to the area around 3530. Of course, this is another opportunity to make short profits in the short term.
I currently hold a short position with the average price around 3582. If you also hold a short position like me, I think we can seize the profit opportunity of the gold pullback next!

GOLD 1H CHART ROUTE MAP UPDATE & TRADING PLAN FOR THE WEEKHey Everyone,
Please see our updated 1h chart levels and targets for the coming week.
We are seeing price play between two weighted levels with a gap above at 3593 and a gap below at 3562. We will need to see ema5 cross and lock on either weighted level to determine the next range.
We will see levels tested side by side until one of the weighted levels break and lock to confirm direction for the next range.
We will keep the above in mind when taking buys from dips. Our updated levels and weighted levels will allow us to track the movement down and then catch bounces up.
We will continue to buy dips using our support levels taking 20 to 40 pips. As stated before each of our level structures give 20 to 40 pip bounces, which is enough for a nice entry and exit. If you back test the levels we shared every week for the past 24 months, you can see how effectively they were used to trade with or against short/mid term swings and trends.
The swing range give bigger bounces then our weighted levels that's the difference between weighted levels and swing ranges.
BULLISH TARGET
3593
EMA5 CROSS AND LOCK ABOVE 3593 WILL OPEN THE FOLLOWING BULLISH TARGETS
3613
EMA5 CROSS AND LOCK ABOVE 3613 WILL OPEN THE FOLLOWING BULLISH TARGET
3638
EMA5 CROSS AND LOCK ABOVE 3638 WILL OPEN THE FOLLOWING BULLISH TARGET
3658
BEARISH TARGETS
3562
EMA5 CROSS AND LOCK BELOW 3562 WILL OPEN THE FOLLOWING BEARISH TARGET
3528
EMA5 CROSS AND LOCK BELOW 3528 WILL OPEN THE SWING RANGE
3492
3470
EMA5 CROSS AND LOCK BELOW 3470 WILL OPEN THE SECONDARY SWING RANGE
3438
3408
As always, we will keep you all updated with regular updates throughout the week and how we manage the active ideas and setups. Thank you all for your likes, comments and follows, we really appreciate it!
Mr Gold
GoldViewFX

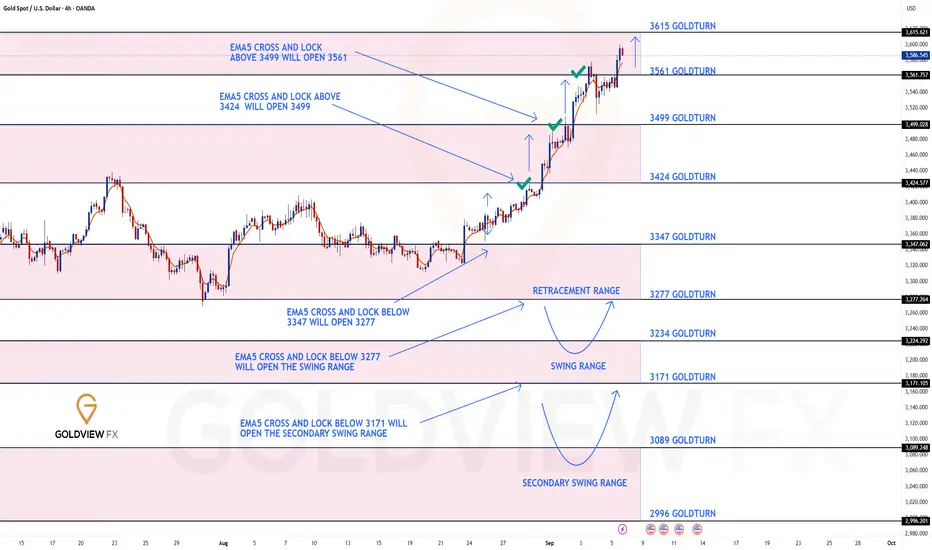
GOLD 4H CHART ROUTE MAP UPDATE & TRADING PLAN FOR THE WEEKHey Everyone,
This is still a follow up update on our 4chart idea which is still valid and in play with the final gap still in range.
Previously we had our Bullish target 3424 and finished off with ema5 cross and lock above this level opening 3499. This gap was filled last week just like we analysed followed with another cross and lock above 3499 opening 3561, which was also hit.
We now finished off last week with a cross and lock above 3561 leaving 3615 open. Failure to test this final target will see lower Goldturns tested for support and bounce.
We will keep the above in mind when taking buys from dips. Our updated levels and weighted levels will allow us to track the movement down and then catch bounces up.
We will continue to buy dips using our support levels taking 20 to 40 pips. As stated before each of our level structures give 20 to 40 pip bounces, which is enough for a nice entry and exit. If you back test the levels we shared every week for the past 24 months, you can see how effectively they were used to trade with or against short/mid term swings and trends.
The swing range give bigger bounces then our weighted levels that's the difference between weighted levels and swing ranges.
BULLISH TARGET
3424 - DONE
EMA5 CROSS AND LOCK ABOVE 3424 WILL OPEN THE FOLLOWING BULLISH TARGETS
3499 - DONE
EMA5 CROSS AND LOCK ABOVE 3499 WILL OPEN THE FOLLOWING BULLISH TARGET
3561 - DONE
EMA5 CROSS AND LOCK ABOVE 3561 WILL OPEN THE FOLLOWING BULLISH TARGET
2615 -
BEARISH TARGETS
3347
EMA5 CROSS AND LOCK BELOW 3347 WILL OPEN THE FOLLOWING BEARISH TARGET
3277
EMA5 CROSS AND LOCK BELOW 3277 WILL OPEN THE SWING RANGE
3234
3171
EMA5 CROSS AND LOCK BELOW 3171 WILL OPEN THE SECONDARY SWING RANGE
3089
2996
As always, we will keep you all updated with regular updates throughout the week and how we manage the active ideas and setups. Thank you all for your likes, comments and follows, we really appreciate it!
Mr Gold
GoldViewFX
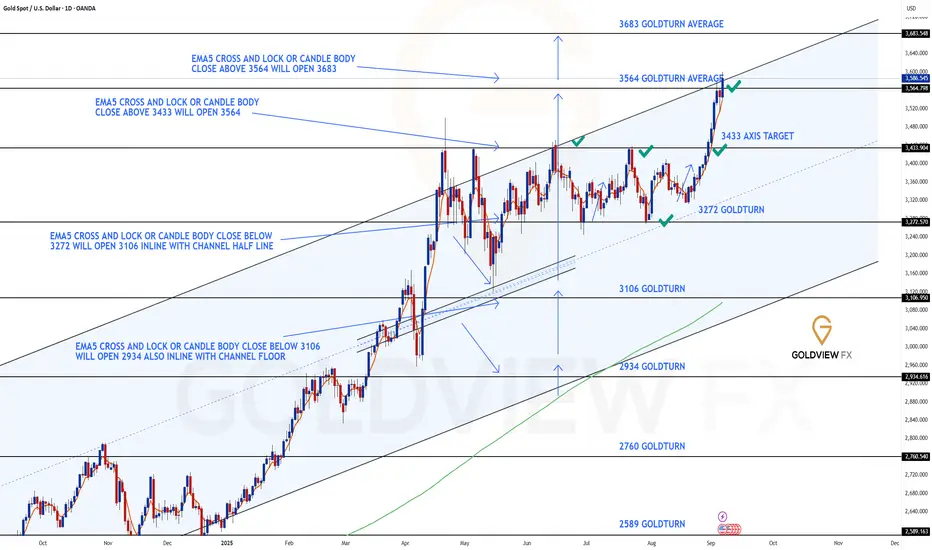
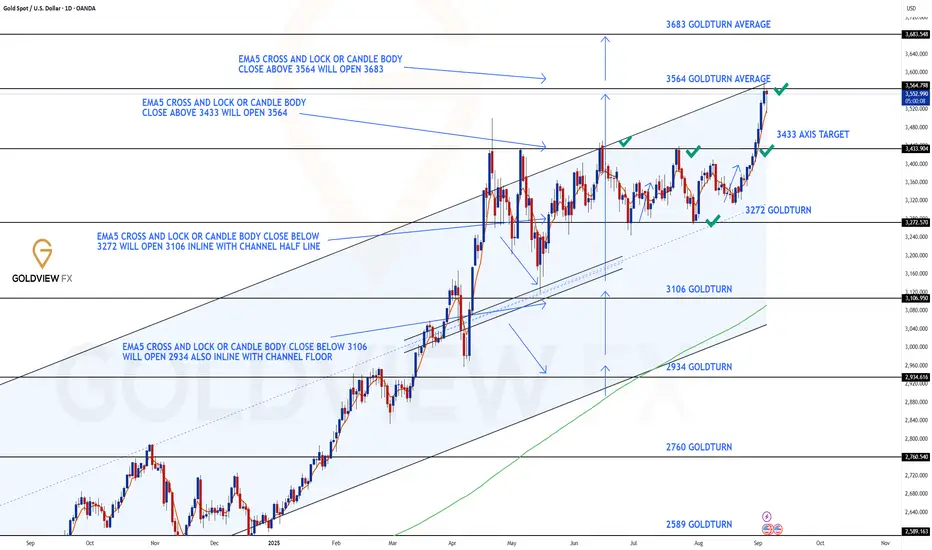
GOLD DAILY CHART ROUTE MAPDaily Chart Update
Range Break, Gap Confirmation & Next Target Achieved
As anticipated in our previous update, price finally pushed through for a test of 3433, confirming the strength of the upside momentum we discussed. This test produced a candle body close gap open for 3564, which has now been successfully achieved just as projected.
The close above 3564 further unlocks 3683 as the next long-term upside target. An EMA5 lock will serve as added confirmation for continuation toward this zone. Meanwhile, both 3564 and 3433 now transition into key support levels for this chart idea.
Current Outlook
🔹 3564 Target Reached
Our gap target has now been completed with a decisive candle body close above. This confirms bullish continuation and shifts focus to the next zone.
🔹 Next Objective – 3683
The successful 3564 break opens a fresh long-term target at 3683. EMA5 lock confirmation will strengthen the case for this move.
Updated Key Levels
📉 Support – 3272 (pivotal floor)
📉 Short Term Supports – 3433 & 3564
📈 Resistance / Next Upside Objective – 3683
Thanks as always for your continued support,
Mr Gold
GoldViewFX
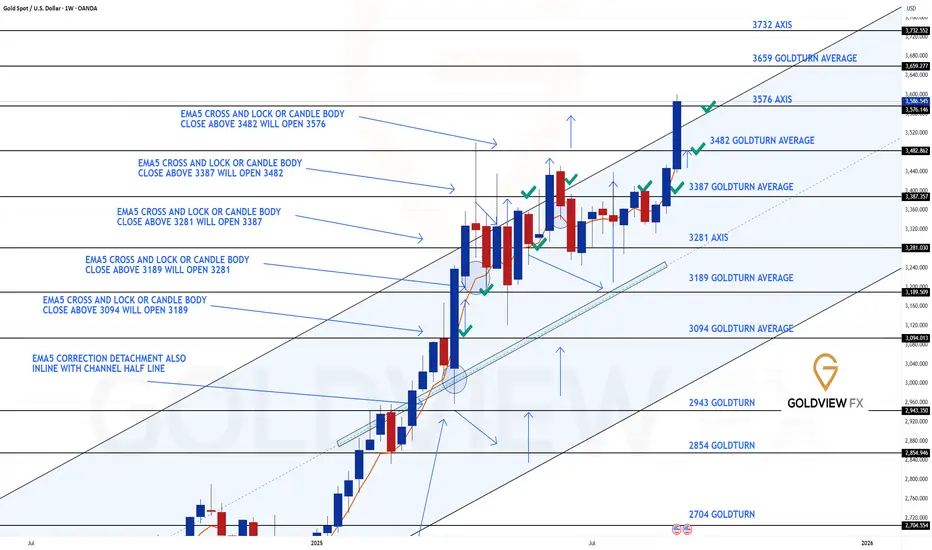
GOLD WEEKLY CHART MID/LONG TERM ROUTE MAPWeekly Chart Update
As anticipated, we got the 3482 gap target hit just as projected. Momentum carried further into the final channel top target at 3576, completing the upper channel move.
Current Outlook
🔹 Gap Targets Achieved
Both 3482 and 3576 have now been met. Price action delivered cleanly into these objectives, validating the prior bullish structure.
🔹 Candle Body Close Above 3576
The weekly body close above the channel top at 3576 has now opened the door to the larger 3659 long-term gap target. EMA5 would provide further confirmation if momentum sustains.
🔹 Channel Top Now Key Test
We need to see 3576 - 3482 (channel top) hold as support to confirm the new range zone play. If it holds, the 3659 - 3732 range becomes the next bullish zone. Failure to provide support above 3482 - 3576 will mean the breakout is short-lived, with risk of a swift correction back down.
🔹 Range Support Levels
3576 and 3482 now act as layered support levels to keep the bullish case intact within this range.
Updated Levels to Watch
📉 Support – 3482 & 3576
Key supports for this new range. Holding above 3576 strengthens the case for continuation toward 3659. A failure back below 3576 puts 3482 into play as the next defensive level.
📈 Resistance – 3659
The newly opened long-term gap target. This becomes the next upside objective if structure holds above 3576.
Plan
With 3482 and 3576 achieved, focus shifts to the 3659 gap. The bullish continuation depends on 3576 holding as support. If buyers defend it, the range extends upward into new territory. If not, expect a sharp corrective move back into the prior range.
Thanks as always for your support,
Mr Gold
GoldViewFX
Best Trend-Following Price Model For Gold XAUUSD Trading
In this article, I will show you a powerful chart setup for profitable trend following trading Gold. I will break down how it works with examples.
Here is how this price model looks:
It is based on 5 important conditions that should be strictly met.
1 - Gold should trade in a global bullish trend.
The price should consistently update Higher Highs HH and Higher Lows HL.
2 - Higher Lows should respect a rising trend line, acting as a support.
It should be respected by at least 3 consequent bullish movements from that.
3 - After a formation of a high above a trend line, the price should start a correctional movement in a minor trend in a bullish flag pattern.
It can be a horizontal, parallel or expanding channel.
4 - Correcting, Gold should test a major rising trend line, being within a flag.
5 - A bullish movement should initiate after a trend line test and the price should break and close above a resistance line of a flag.
When all these 5 conditions are met, we can expect a bullish movement on Gold at least to a level of a current high from where a correction started.
A broken resistance line of a flag and a major rising trend line will compose a safe zone to buy Gold from.
The best time frame for this model will be a daily.
Let's study a real example of such a price model on Gold chart on a daily.
Examine a price chart of Gold on a daily time frame above.
All 5 conditions are met, and we can anticipate a rise to the underlined red resistance.
Our buy zone will be based on a broken resistance of the flag and a major rising trend line.
You can see that our goal was successfully reached.
Here is the proof -
This price model will help you to predict strong bullish waves , trading Gold. A simple combination of a trend analysis and a price action are the 2 basic components that you need to study to identify that properly.
❤️Please, support my work with like, thank you!❤️
I am part of Trade Nation's Influencer program and receive a monthly fee for using their TradingView charts in my analysis.

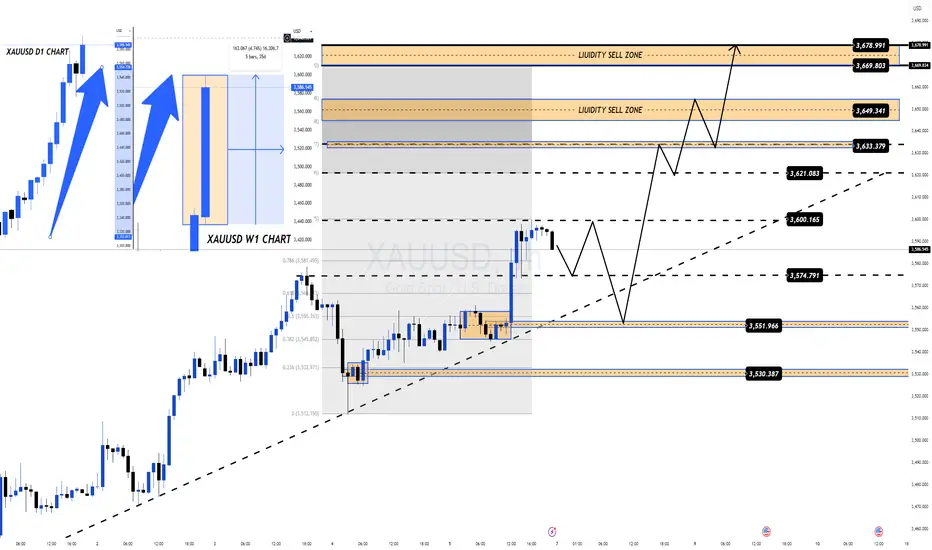
Weekly Outlook: Strong Bullish Momentum Meets Key US Data XAUUSD – Weekly Outlook: Strong Bullish Momentum Meets Key US Data | MMFLOW TRADING
Market View:
Gold (XAUUSD) ended the week with explosive momentum after Nonfarm Payrolls pushed price to a new ATH near $3600/oz. On the daily chart, the bullish candle closed with only ~30% wick, showing no signs of profit-taking. The weekly chart also printed a powerful bullish candle, confirming BUY dominance. This suggests that gold could see further upside in the coming week – and potentially throughout this month.
Macro & Fundamental Drivers (Week Ahead):
Key US data will drive volatility in XAUUSD:
Wed, Sep 10: Core PPI & PPI m/m → hotter-than-expected prints could support USD short term, weighing on gold.
Thu, Sep 11: CPI (Core, m/m, y/y) + Jobless Claims → the most critical release. Softer CPI + higher jobless claims would fuel gold’s rally, while hotter CPI keeps Fed hawkish.
Fri, Sep 12: UoM Consumer Sentiment & Inflation Expectations → inflation outlook could shape Fed expectations further.
Overall, fundamentals may create volatility, but the medium-term bias stays bullish.
Technical Outlook (H1 Chart):
Price is consolidating sideways after the Nonfarm breakout. Key levels to watch next week:
Support: 3574 – 3551 – 3530 – 3516
Resistance: 3600 – 3621 – 3633 – 3649 – 3669 – 3678
Trading Plan:
BUY bias (preferred):
Long on pullbacks around 3574–3550
SL: below 3530
TP: 3600 → 3621 → 3633 → 3649 → 3669 → 3678
SELL scalp (alternative):
Only if 3530 breaks with strong CPI upside surprise → target 3516/3527
Summary:
✅ Gold remains in a strong uptrend on both Daily and Weekly charts, with macro factors favouring further upside if inflation continues to ease.
👉 Watch 3592 (bullish trigger) and 3575 (bearish trigger) – these are the decision points for the next major move.
Follow MMFLOW TRADING for daily updates and trade setups.
GOLD WEEKLY CHART ROUTE MAP UPDATEHey Everyone,
After completing our 1h, 4h and daily chart ideas this week, please now see update on our weekly chart idea, which we also smashed into pips!!!
As anticipated -
This time, bulls followed through in full force:
✅ We got our Target Hit at 3482 after confirming the gap from the body close above 3387.
✅ To finish the week on a high, we also completed our long-range axis target at 3576, which has been highlighted on the chart since the beginning of our tracking on this chart idea.
🔹 3482 Gap Target Achieved
The upside gap has now been fully confirmed and met.
🔹 Axis Target 3576 Completed
The higher-timeframe target we’ve tracked since the start has been fulfilled, marking a strong close to the week.
With both the 3482 gap and 3576 axis target achieved, the bullish roadmap we’ve tracked has now played out to completion. Near-term, we’ll watch how price reacts around 3576. A strong close above could open fresh upside extensions, while failure here may trigger a healthy pullback toward 3387 for retest.
We will now come back Sunday with a full multi timeframe analysis to prepare for next week’s setups, including updated views on the higher timeframes, EMA5 alignments, and structure expectations going forward.
Thanks again for all your likes, comments, and follows.
Wishing you all a fantastic weekend!!
Mr Gold
GoldViewFX

XAUUSD – Post-NFP Big Win & Key Levels to Watch | MMFLOW TRADINGNonfarm Payrolls pushed gold (XAUUSD) to a new ATH near $3600/oz. After reacting sharply at the 3593–3595 liquidity sell zone, price dropped more than 200 pips before bouncing back quickly to retest the previous ATH and climbing again towards 359x, showing strong bullish momentum still in play.
Short-Term Outlook (US Session Close):
Upside momentum remains dominant, but the market now stands at two critical key levels that will define the next move.
Key Levels:
Bullish trigger: 3592 → A clean breakout above this zone could fuel further upside towards the next liquidity area around 362x.
Bearish trigger: 3575 → A break below this level may open a deeper pullback to fill the Nonfarm liquidity gap around 3550–3527.
Trading Plan:
BUY bias: Hold above 3592 → look for longs targeting 3610–362x.
SELL scalp: Break below 3575 → shorts towards 3550–3527.
Always apply strict risk management (SL just beyond the nearest key level).
Summary:
✅ After a 200+ pips BIGWIN on Nonfarm, gold retains strong momentum.
👉 Watch the 3592 & 3575 zones closely – they are the decision points for the next major move.
Follow MMFLOW TRADING for timely updates and trade setups!
XAUUSD – Gold Trading Plan Before NFP | MMFLOW TRADINGGold (XAUUSD) has been consolidating in a sideway range (355x–354x) after several days of sharp gains. Yesterday, price reacted strongly at the 357x liquidity zone, triggering a short-term correction before stabilising back into balance.
Now, the market is narrowing its range while waiting for the Non-Farm Payrolls (NFP) release later today — the key driver that will likely set the next directional move.
📊 Macro Context
If NFP comes in better than expected, Gold could extend its correction lower, filling liquidity gaps towards 352x – 350x before offering fresh long opportunities.
If NFP data disappoints, Gold may break ATH (357x) and push higher toward the next liquidity & FIBO extension levels near 3594+.
🔑 Key Resistance Levels
3560 – 3576 - 3594
🔑 Key Support Levels
3540 - 3528 – 3514 - 3502 – 3488 – 3478
📌 Trade Setups (MMFLOW Trading Plan)
🔵 BUY Zone: 3488 – 3486
🔴 SL: 3480
✔️ TP: 3492 – 3496 – 3500 – 3510 – 3520 – 3530 – 3540 – ????
🔵 BUY Scalp: 3528 – 3526
🔴 SL: 3520
✔️ TP: 3532 – 3536 – 3540 – 3550 – 3560 – ????
🔴 SELL Scalp: 3574 – 3576
🔴 SL: 3580
✔️ TP: 3570 – 3565 – 3560 – 3550 – 3540 – 3530 – ????
🔴 SELL Zone: 3593 – 3595
🔴 SL: 3600
✔️ TP: 3588 – 3584 – 3580 – 3570 – 3560 – 3550 – ????
📊 MMFLOW Trading View:
Gold is sideway ahead of NFP, and today’s breakout from the 3540–3565 range will decide the next major move. Liquidity remains key — watch how price reacts at 3515–3528 on the downside or 3576–3595 on the upside.

Brace Yourself: NFP May Send Markets Crashing AgainYesterday, gold rebounded after retreating to the 3537-3535 area, reaching a high of around 3561. Although gold has rebounded again, I believe its potential is limited. Because after gold retreated deeply from around 3578 to around 3511, its structure has been gradually changing, and the rebound was not strong. Judging from the current trend, 3578 is expected to form a temporary high point, and the withdrawal of large funds will easily stimulate gold selling sentiment in the short term, especially for those who are afraid of heights and are not firm.
There is an NFP market today. If gold cannot break through 3565 before NFP, then gold is likely to fall again and fall below the area around 3535.
Therefore, in terms of short-term trading, I will still insist on shorting gold on rallies. As long as gold does not exceed the area around 3565 during the rebound, 3578 may be successfully confirmed as the interim high point, and gold may usher in a good pullback again. We are looking forward to the reappearance of the deep pullback market during yesterday’s Asian session, which will bring us huge profits again.

DAILY CHART ROUTE MAP UPDATEHey Everyone,
After completing our 1h and 4H chart this week, please now see update on our daily chart idea that we have been tracking. This chart idea has also played out to perfection!!
Sunday we advised that 3433 had now produced a candle body close above this level leaving gap target open for 3564 - This target is now complete!!
🔹 GAP TARGET 3564 - DONE
We will now look for a body close and/or ema5 cross and lock above this level to confirm a continuation. Failure to lock will confirm a rejection into the lower Goldturns for support.
Thanks as always for your support.
Mr Gold
GoldViewFX
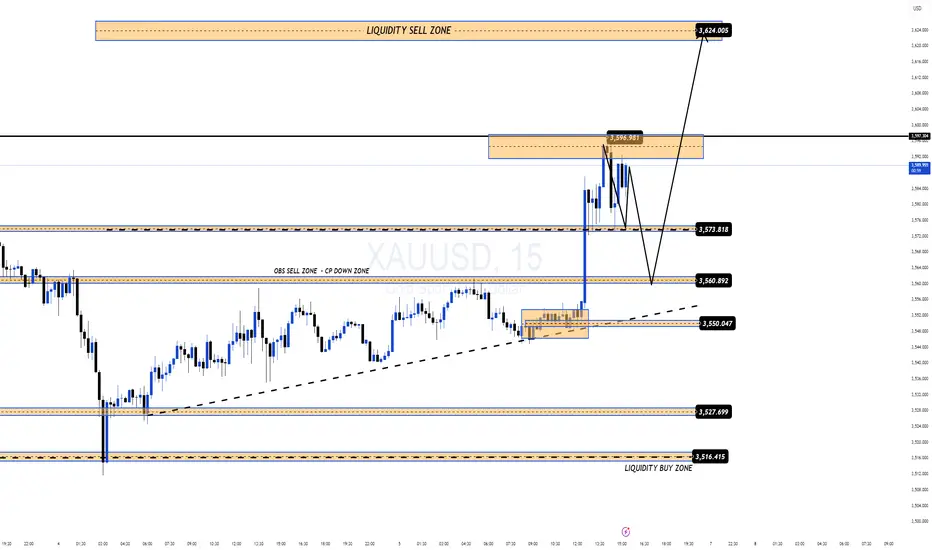
XAUUSD – Technical Outlook after ADP NONFARMGold (XAUUSD) attempted to recover but failed to break through the 3559 – 3561 (OBS Sell Zone – CP Down Zone). The sharp rejection from this resistance confirms that sellers remain in short-term control.
At present, price is retracing towards the 3528 – 3515 support zone – a key level to watch:
If buyers defend 3515, we could see a rebound back toward the 3550 – 3559 resistance zone.
A clear break below 3515 would signal stronger bearish pressure, opening the path toward 3486 – 3477 (Liquidity & OBS Buy Zone) where large orders are likely waiting.
Additionally, the 3537 – 3540 VPOC/Sideway Range remains a critical balance area where short-term market direction could be decided.
📌 Key Technical Levels
Major Resistance: 3550 – 3559
Near-term Support: 3528 – 3515
Liquidity & BUY Zone: 3486 – 3477
📊 MMFLOW Trading View:
Short-term momentum currently favours a corrective move lower after the rejection at 3559 – 3561. The reaction at 3515 will be crucial:
Holding above → potential rebound to retest 3550 – 3559
Breaking lower → extended downside towards 3486 – 3477 liquidity zone

XAUUSD – Liquidity Gap & Key Levels Before ADP/NFPAfter yesterday’s rally, Gold (XAUUSD) pulled back over 60 points, returning to the VPOC 3537 zone. This sharp move suggests a possible short-term ATH near 357x, where many SELLs were forced out while BUYs locked in profits.
Currently, Gold is in a correction phase ahead of ADP today and NFP tomorrow. With ADP expected at 73K vs. 104K prior, weaker data could support further upside if USD weakens.
The 60+ point drop shows profit-taking by big players and left liquidity gaps on both sides, bringing price back into the 353x–354x range. A breakout of this range will likely dictate today’s trend.
🔑 Key Resistance Levels
3540 - 3548 - 3560 - 3576
🔑 Key Support Levels
3526 - 3515 - 3502 - 3490 - 3476
📌 Trade Setups (MMFLOW Trading View)
BUY Scalp: 3502 – 3500
SL: 3494
TP: 3506 – 3510 – 3520 – 3530 – 3540 – ???
BUY Zone: 3477 – 3475
SL: 3470
TP: 3485 – 3495 – 3500 – 3510 – 3520 – 3530 – 3540 – 3550 – ???
SELL Scalp: 3559 – 3561
SL: 3566
TP: 3554 – 3550 – 3540 – 3530 – 3520 – 3510 – 3500 – ???
SELL Zone: 3574 – 3576
SL: 3580
TP: 3570 – 3560 – 3550 – 3540 – 3530 – ???
📊 MMFLOW TRADING View:
Today’s market context suggests continued correction before ADP/NFP. Sideway accumulation remains dominant in 353x–354x, but a decisive breakout will guide today’s direction.

Gold’s Next Move: DOWN!!!Although gold continues its strong upward trend, it still provides opportunities for pullbacks during the day. For example, it hit a low of 3470-3467 yesterday. Currently, the highest price of gold has reached around 3550. Gold continues to set new historical highs. There is no price behavior and technical resistance above it as a reference. But obviously, as long as gold remains above 3540, I will not choose to aggressively chase gold at high levels.
On the contrary, while gold is rising, I will still try to short gold at the top while setting protection. In terms of price behavior, gold started to rise from around 3322 and has reached around 3550 so far, with an increase of up to $228. Although there has been no decent retracement during this period, this strong momentum is indeed easy to form a combined force. However, once the market returns to rationality, the decline will definitely not be small. So at the current stage, I do not advocate going long on gold. On the contrary, I will actively look for opportunities to short gold!
In the short term, we first need to observe gold's performance in the 3540-3530 area. If gold cannot fall below this area during the retracement, it may have the potential to continue to rise. If gold falls below the 3540-3530 area, the first retracement target will be the 3525-3515 area. If this area is broken, it is likely to continue to 3500-3490.

GOLD London Session Update – Sideways Before the Big MoveGold (XAUUSD) continues to consolidate within the 354x – 352x range, building a clear sideways structure after its recent strong rally.
📊 MMFLOW VIEW (London Session Focus)
The market is now in accumulation mode as the London session develops – volatility is expected to increase as liquidity builds up.
If price breaks above ATH 3546, momentum could quickly push gold towards the Liquidity Sell Zone 357x.
On the other hand, if 3526 support fails, we may see a liquidity sweep with price retracing into the FVG & Liquidity Buy Zone 3508 – 3480 before resuming the bullish trend.
🔑 Key Levels (London Watchlist)
Resistance: 3546 | 3564 | 3576
Support: 3526 | 3508 | 3494 | 3480
⚠️ During the European session, gold often builds false breaks to collect liquidity before the real move.
👉 Stay patient and wait for a clean breakout confirmation before committing to a position.
🔥 Follow MMFLOW TRADING for real-time plans into the New York session – don’t miss the big move!
