XAUUSD Q4 is Coming; September Reset for Gold Traders
Summer is leaving its mark already. For some, it’s the heat of missed trades. For others, it’s the frustration of chop: false breaks, liquidity traps, the kind of price action that tests your patience more than your strategy. Another batch of traders comes back refreshed from their holidays...
But every year, like clockwork, September arrives.
And this month is different.
It’s the reset button. Liquidity returns as big players come back from summer. Volumes rise. Market makers shift gears. What looked like a bit of chaotic moves in July and August begin to make sense in September, because the context changes.
1️⃣ Why September Matters
Think of it as the gateway to Q4.
It’s not just “another month”, but the bridge between the summer ranges and the final push of the year.
• Institutions reposition.
• Central banks set the tone for year-end.
• Physical demand from India and China accelerates into festivals and holidays.
This is when the market stops drifting and starts building direction.
2️⃣ Q4: The Final Act
October to December is rarely quiet. It’s when portfolios get rebalanced, reports closed, and big narratives find their conclusion.
For Gold, Q4 often means:
• Volatility with a purpose. Not just random spikes, but moves that make a mark.
• Trends that can define the whole year. One or two big swings can make all the difference.
• Liquidity sweeps early, momentum later. September often tests both sides before revealing the path.
3️⃣ The Psychology of the Season
This is where traders win or lose more in their minds than on their charts.
• Patience over FOMO. September rewards those who wait for clarity.
• Confidence over ego. Don’t chase every move to “make up” for the passed summer.
• Preparation over reaction. Mark your levels, define your risk, and let the market come to you and your reaction zones.
It’s not about catching the first candle of the move. It’s about being ready for the real trend when it reveals itself.
4️⃣ How to Prepare
• Treat September as a filtering month. Don’t overtrade; study how XAUUSD reacts around key liquidity pools.
• When October–November come, be ready to scale into clean moves.
• In December, remember that thinner liquidity can still hide powerful setups — but choose them carefully.
✨ A Note for Serious Traders
The edge isn’t in chasing signals, it’s in building structure and a sure plan with a few great trades/week. Every trader stepping into Q4 should have:
• A clear bias based on higher timeframes, then move to the lower ones.
• Defined key levels & reaction zones marked in advance. Do your homework on the charts.
• Discipline to avoid impulsive trades and wait for price to come to the plan.
That’s how you survive September and thrive in Q4. Outlooks and daily bias updates — when done properly — bring in good/great results and fewer SL.
Let's get ready for XAUUSD fall trading!
If this article helped you today and brought you more clarity:
Drop a 🚀 and follow us✅ for more trading ideas and trading psychology.
Goldtradingstrategy

Bears’ Last Chance Before the Golden Bull AwakensToday, gold has held 3373 many times during the retracement process, proving that the current market is still dominated by bulls. Currently, gold has touched above 3390 again, showing that buying power is still continuing. This is also the reason why we have been long on gold in the 3378-3374 area many times today, mainly based on the fact that gold is currently in an obvious bullish structure.
But we need to note that although gold continues to rise, it is not strong. Most of the time it still fluctuates at a high level. It may be that the market is not highly unanimous in its agreement on the continuation of the strong bull market stimulated by the news, so the short-term volatility of gold will be exacerbated while it is rising.
In addition, gold is becoming more cautious as it approaches 3400. In comparison, there is still a certain amount of suppression in the area around 3400, so we must take into account that gold may still retreat after being under pressure in the short term, so I think it is necessary for us to try to short gold again in the 3395-3405 area; once gold retreats as expected, the first test will be the short-term support in the 3385-3375 area. If the support in the 3385-3375 area is effective during the test, then gold may be able to break through the 3400 mark in one fell swoop, or even continue to the 3410-3420 area.
So, in short-term trading. At present, we can consider shorting gold appropriately in the 3395-3405 area. If gold retreats as expected, we will first observe the performance of gold in the 3385-3375 area. If it cannot effectively fall below this area, we can adjust the trading strategy and re-enter the long trade!

GOLD ROUTE MAP UPDATEHey Everyone,
Great day on the charts as our analysis played out and we got the Bullish Target 3390 just like we said. For continuation, we will now need an EMA5 cross and lock above this level. Failure to lock will likely see price action play between 3390 and 3365 until one breaks, while also keeping the 3347 gap in mind.
We will keep the above in mind when taking buys from dips. Our updated levels and weighted levels will allow us to track the movement down and then catch bounces up.
We will continue to buy dips using our support levels taking 20 to 40 pips. As stated before, each of our level structures give 20 to 40 pip bounces, which is enough for a nice entry and exit. If you back test the levels we’ve shared every week for the past 24 months, you can see how effectively they were used to trade with or against short/mid-term swings and trends.
The swing ranges give bigger bounces than our weighted levels, that’s the key difference between them.
BULLISH TARGET
3390 – ✅ DONE
EMA5 CROSS AND LOCK ABOVE 3390 WILL OPEN THE FOLLOWING BULLISH TARGETS
3422
EMA5 CROSS AND LOCK ABOVE 3422 WILL OPEN THE FOLLOWING BULLISH TARGET
3439
BEARISH TARGETS
3365 – ✅ DONE
EMA5 CROSS AND LOCK BELOW 3365 WILL OPEN THE FOLLOWING BEARISH TARGET
3347
EMA5 CROSS AND LOCK BELOW 3347 WILL OPEN THE FOLLOWING BEARISH TARGET
3324
EMA5 CROSS AND LOCK BELOW 3324 WILL OPEN THE SWING RANGE
3304
3281
As always, we will keep you all updated with regular updates throughout the week and how we manage the active ideas and setups. Thank you all for your likes, comments and follows, we really appreciate it!
Mr Gold
GoldViewFX

GOLD BUY SETUP Hello Everyone!
Lets Take A Buy Trade Of XAUUSD
Buy Gold @3374
Stoploss / 3369
TP / @3378, 3385
Comment Your Opinion & Follow Us For More Trades

Final Bear Profit—Then Gold Turns BullishSupported by Trump's statement and geopolitical tensions, gold continued to rise to around 3394 and is currently fluctuating narrowly around 3390.
Although the upward momentum of gold seems strong, the bulls are not resolute during the rise. Instead, they will launch an attack again after repeatedly testing the support. It is expected that the market is not highly unanimous in its agreement on the continuation of the strong bull market stimulated by the news, so the short-term volatility of gold will be exacerbated during the rise.
As gold continues to rise, it is clearly under pressure in the 3400-3410 area in the short term. Moreover, the bullish sentiment of gold has obviously weakened before facing this area, so we must consider that gold may still retreat after being under pressure in the short term. Below, we should first note the short-term support area of 3385-3375. If gold fails to effectively break below this area during a pullback, it will likely retest 3400.
Therefore, in short-term trading. At present, we can consider shorting gold appropriately in the 3390-3400 area. If gold retreats as expected, we will first observe the performance of gold in the 3385-3375 area. If it cannot effectively fall below this area, we can adjust the trading strategy and re-enter the long trade!

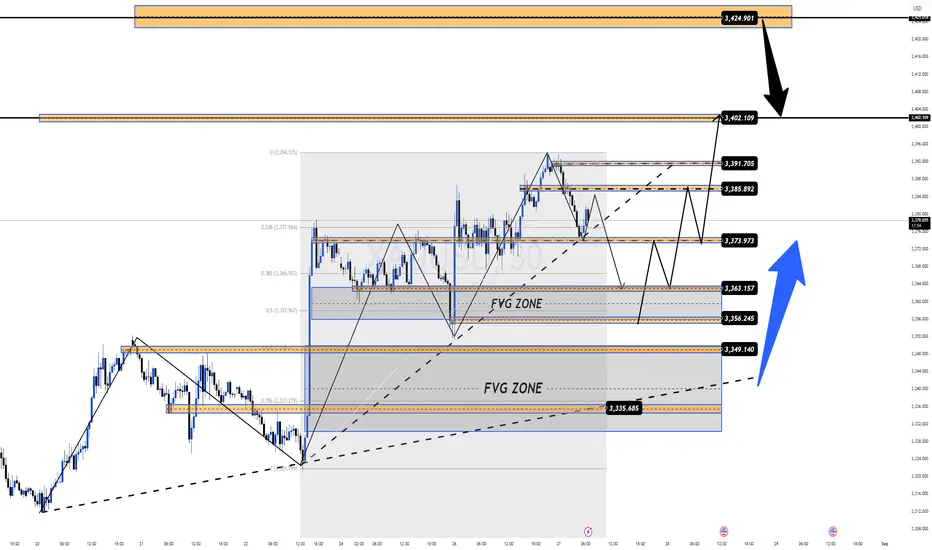
FOMO Buying Still Strong, Waiting for a Clean Pullback to BUY MMFLOW TRADING PLAN XAUUSD
Gold continues to hold its bullish momentum in the Asian session today, testing the 9x zone before pulling back towards the 7x level. Buyers remain in control, driven by strong FOMO sentiment as the USD shows signs of weakness.
👉 MMF’s outlook:
We remain bullish long-term – looking for cleaner pullbacks to secure safer BUY entries and hold positions towards higher targets.
🔎 Short-Term Outlook (1–2 days)
If price breaks the 337x structure, we may see a quick drop towards 335x – 334x liquidity zones before resuming the upside and potentially heading into NEW ATH territory.
Watch key support and resistance zones closely to identify high-probability entries.
📌 Key Levels to Watch
Support: 3363 – 3356 – 3349 – 3335
Resistance: 3385 – 3391 – 3402 – 3425
🎯 Today’s Trading Plan
🔵 BUY Scalp
Entry: 3356 – 3354
SL: 3350
TP: 3360 – 3365 – 3370 – 3375 – 3380 – 3390 – 3400 – ???
🔵 BUY Zone (Swing/Position)
Entry: 3336 – 3334
SL: 3330
TP: 3340 – 3345 – 3350 – 3360 – 3370 – 3380 – 3400 – ????
🔴 SELL Scalp
Entry: 3385 – 3387
SL: 3390
TP: 3380 – 3375 – 3370 – 3365 – 3360 – 3350
🔴 SELL Zone
Entry: 3401 – 3403
SL: 3407
TP: 3396 – 3390 – 3380 – 3370
📌 Summary:
Gold remains in a strong uptrend, but the best opportunities may come from waiting for deeper pullbacks to BUY. Traders can either scalp within today’s ranges or aim for long-term positions from the lower buy zones.
Explosive Rally Ahead: Gold Eyes a 3400 BreakoutThere is no doubt that as long as gold is above 3350, the current gold market will maintain a strong bullish structure. After today's sideways trading, gold has clearly established a support platform in the 3370-3360 area. Although it has repeatedly fallen back under pressure in the 3380-3390 area, it has rarely fallen below the short-term support platform of 3370-3360. In addition, the candlestick charts have repeatedly shown long lower shadows, proving that the buying momentum is strong and the market bullish enthusiasm is high! Therefore, in short-term trading, we can try to go long on gold based on the 3370-3360 support level.
However, it's important to note that gold has repeatedly come under pressure at the 3380-3390 resistance level. If gold consistently fails to break through this resistance level during its upward trend, bullish sentiment could be affected. Therefore, gold may need to retest support before any further gains. If it falls below the 3370-3360 level during this retest, it could extend to the 3355-3350 level, which is strong support in the short term. Therefore, if gold falls below the 3370-3360 level, it could retest the 3355-3350 level, prompting bulls to launch a counterattack.
Therefore, in the short term, given that gold maintains a bullish structure, I would primarily consider going long on gold.
1. Consider initiating a long position in gold in the 3370-3360 area; first, see if gold can break through the 3380-3390 area as expected.
2. If gold retests the support area, consider resuming a long position in the 3355-3350 area.

XAU/USD M15 Update – Breakout or Fakeout?Gold has been consolidating in a tight 336x – 337x range throughout the day. Now, price is showing signs of pushing back towards the short-term high at 3377 – 3382.
👉 Two possible scenarios are on the table:
1️⃣ Liquidity Grab (Fake Breakout): Price retests the high → triggers FOMO buys → sharp rejection back down towards 3363 – 3355 liquidity zones.
2️⃣ Clean Breakout: If buyers hold control and break above 3382 – 3384, momentum could accelerate into the 3400 – 3402 resistance zone.
📌 Key Levels on M15:
Resistance: 3377 – 3384 | Major: 3400
Support: 3363 – 3354 – 3341
⚡ Trading Notes:
Don’t chase price into resistance.
Wait for clear confirmation around 3382 – 3384 before committing.
Scalpers can look for quick plays at 3363 – 3355 (buy zone) or fade rejection at 3382 – 3384 if breakout fails.
🔥 Gold is at a decision point – will it break higher into 3400 or trap longs before a deeper correction?
What’s your take? Drop your view below 👇

Downtrend Broken! Watch These Liquidity Zones for Big MoveMMFLOW Trading Plan | 26 Aug 2025 ⚡️
💰Gold is gearing up for a strong move!
Gold has broken the H4 downtrend line, showing strong buying momentum and liquidity sweeps, signaling a potential bullish continuation.
⚠️Warning: wide support zones below may trigger quick pullbacks to collect liquidity.
📊Market Context
USD is weakening amid political and Fed uncertainty
Trump attempting to influence lower interest rates, supporting gold
H4 downtrend line broken → buyers in control
Short-term: expect sideways movement + liquidity tests
Watch for quick spikes – FOMO buy zones are often targeted
⚡️Key Levels
Resistance: 3378 → 3384 → 3400
Support: 3363 → 3354 → 3340
🔥Trading Scenarios
✅BUY SCALP (Quick Moves – Short-term)
🔵Entry: 3355 – 3353
🔴Stop Loss: 3349
✔️Targets: 3360 → 3365 → 3370 → 3380 → 3390 → 3400+
✅BUY ZONE (Longer Setup – Swing)
🔵Entry: 3341 – 3339
🔴Stop Loss: 3335
✔️Targets: 3345 → 3350 → 3355 → 3360 → 3365 → 3370 → 3380 → 3390 → 3400+
💠SELL SCALP (Quick Reversals)
🔵Entry: 3382 – 3384
🔴Stop Loss: 3388
✔️Targets: 3378 → 3374 → 3370 → 3365 → 3360 → 3350
💠SELL ZONE (High Risk – Big Moves)
🔵Entry: 3400 – 3402
🔴Stop Loss: 3406
✔️Targets: 3395 → 3390 → 3385 → 3380 → 3370 → 3360
⚠️Risk Notes
Expect fast drops or spikes – stops can trigger quickly
Sideways movement likely in sessions + retests of highs
Only trade when price action confirms key zones
🎯Key Takeaways
Gold is poised for strong bullish continuation, but pullbacks will occur to collect liquidity
Use support/liquidity zones for entries, resistance zones for exits
MMFLOW = Market Rule | Key Levels = Profit

Gold’s Next Move = Your Next ProfitOn Friday, gold prices soared due to Powell's dovish remarks, reaching a high of around 3379, and the candle chart showed signs of a V-shaped reversal. From a technical perspective, gold still has the potential to continue to rise, and as of now, gold has not effectively fallen below 3360. While effectively curbing the downward space, it also shows that a certain amount of buying momentum is still continuing.
However, gold has not yet effectively broken through the 3380-3390 area, and the upper space has not been completely opened. If gold cannot break through this area, the bullish momentum may gradually weaken in the short term. In order to accumulate enough momentum to break through this area, gold may usher in a pullback in the short term.
First, we should focus on the 3355-3345 area below. As long as gold remains above this area, the overall bullish pattern will remain. Therefore, this area is the entry area where we should try to go long on gold for the first time after gold pulls back.
Therefore, we currently have two trading options:
1. When gold first hits the 3380-3390 area, consider shorting gold.
2. When gold first hits the 3355-3345 area, consider longing gold.

Gold (XAUUSD) – Bullish Bias, Watching 3366–3364 Mitigation ZoneGold (XAUUSD) Analysis – 26 August
Market Structure
H4 Trend: Bullish
M15 Trend: Bullish
Both higher and lower timeframes are in sync, showing overall bullish market structure.
Context
On 22 August, Powell’s speech triggered strong bullish momentum.
Following the move, price consolidated within 3378 – 3360 .
Today, market showed downside manipulation , followed by a strong upside break — a classic Manipulation → Initiation → Mitigation sequence.
Key Zone (POI)
3366 – 3364 : This is the potential mitigation zone of interest.
If price respects this area, it could provide a high-probability long setup in line with the prevailing uptrend.
Execution Plan
Bullish Scenario:
Wait for price to retest 3366 – 3364 .
Look for confirmation (LTF price action reaction).
Enter long if conditions align.
Alternative Scenario:
If the 3366 – 3364 zone is not respected, stand aside and re-analyze the structure before planning new entries.
Bias for Today
Bullish, favoring long setups if the mitigation zone holds.
📘 Shared by @ChartIsMirror

GOLD PLAN – Post-Jackson Hole: Correction or Breakout Ahead?Last week, Gold exploded higher after the Jackson Hole Symposium and dovish tones from the FED. The weaker USD fueled bullish momentum, and many investors are now eyeing new ATHs in the near future. But here’s the catch: after such a sharp rally, markets often need a healthy pullback before the next leg higher.
📊 Technical Outlook (H4)
Gold is consolidating inside a tightening triangle structure, signaling that a major breakout is on the horizon.
Friday’s strong bullish candle confirms buyers’ control, but history shows: before every strong breakout, Gold loves to create a deeper liquidity sweep to shake out weak hands.
Key levels from FIBO and previous supply/demand zones will be crucial for decision-making this week.
📌 Key Levels to Watch
Resistance: 3370 – 3383 – 3400 – 3425
Support: 3350 – 3340 – 3326 – 3315
🔥 Trade Plan
BUY ZONE
Entry: 3340 – 3338
SL: 3334
TP: 3345 – 3350 – 3355 – 3360 – 3370 – 3380 – 3390 – 3400+
SELL ZONE 🔴
Entry: 3400 – 3402
SL: 3407
TP: 3395 – 3390 – 3385 – 3380 – 3375 – 3370
⚠️ MMF Insights
Priority: Buy on corrections rather than chasing highs.
Wait for confirmation at Key Levels before entering – don’t let emotions dictate your trades.
Remember: Gold’s game is always psychology + patience – only disciplined traders will hold their edge.
✨ The market is gearing up for a big move – do you see a breakout coming this week? 🚀
👉 Drop your thoughts in the comments below!

XAU/USD – M30: Short-Term Pullback Before the Next Move?Gold has shown strong bullish momentum recently, but on the M30 chart price is now retesting the 3376 resistance level, which aligns with a descending trendline. This confluence makes it a critical zone where a temporary pullback may occur before the market decides its next direction.
📊 Technical Outlook (M30)
3376 → Key resistance + trendline retest.
Price may reject this area and retrace back into the FVG Zone (3363 – 3351).
This zone will be crucial for potential long opportunities in line with the broader bullish trend.
📌 Key Levels
Resistance: 3376 – 3383
Support: 3363 – 3351
🔥 Trading Plan (MMFlow Style)
Scenario 1 – Short-Term SELL
Entry: 3375 – 3377
Stop Loss: 3383
Targets: 3363 – 3355 – 3351
Scenario 2 – BUY from FVG Zone
Entry: 3363 – 3351
Stop Loss: 3345
Targets: 3368 – 3375 – 3383 – 3390
⚠️ Risk Notes
This is an M30 setup → best suited for short-term traders.
If price breaks above 3383 with momentum, Gold could quickly push towards 3400+.
Watch out for volatility and stop-hunts, especially around news events – patience and confirmation are key.
✨ Question for the community:
Do you expect Gold to dip into the FVG zone for accumulation 🏦, or will it break 3383 straight away and head for 3400+? 🚀

GOLD M15 MARKET STRUCTURE Gold Bullish Structure !
Gold Buy Zones : 3373 (CISD)
Gold Buy Zone : 3362 , 3358 (BASE BUY)
Gold Buy Zine : 3368 , 3364 (IFVG + FVG)
Manage Your Trade With Risk Management
Good Luck With Your Trading

GOLD ROUTE MAP UPDATEHey Everyone,
Strong start to the week on our 1H chart route map. We first saw our bearish target at 3365 hit, followed by a no cross and a lock below the Goldturn, confirming rejection. This set up the perfect bounce, aligning with our buy-the-dip strategy and giving us a solid catch. The bullish gap 3390 still remains open for the test.
We will see levels tested side by side until one of the weighted levels break and lock to confirm direction for the next range.
We will keep the above in mind when taking buys from dips. Our updated levels and weighted levels will allow us to track the movement down and then catch bounces up.
We will continue to buy dips using our support levels taking 20 to 40 pips. As stated before each of our level structures give 20 to 40 pip bounces, which is enough for a nice entry and exit. If you back test the levels we shared every week for the past 24 months, you can see how effectively they were used to trade with or against short/mid term swings and trends.
The swing range give bigger bounces then our weighted levels that's the difference between weighted levels and swing ranges.
BULLISH TARGET
3390
EMA5 CROSS AND LOCK ABOVE 3390 WILL OPEN THE FOLLOWING BULLISH TARGETS
3422
EMA5 CROSS AND LOCK ABOVE 3422 WILL OPEN THE FOLLOWING BULLISH TARGET
3439
BEARISH TARGETS
3365 - DONE
EMA5 CROSS AND LOCK BELOW 3365 WILL OPEN THE FOLLOWING BEARISH TARGET
3347
EMA5 CROSS AND LOCK BELOW 3347 WILL OPEN THE FOLLOWING BEARISH TARGET
3324
EMA5 CROSS AND LOCK BELOW 3324 WILL OPEN THE SWING RANGE
3304
3281
As always, we will keep you all updated with regular updates throughout the week and how we manage the active ideas and setups. Thank you all for your likes, comments and follows, we really appreciate it!
Mr Gold
GoldViewFX

Gold at a Critical Turning Point – CHoCH Wait Area or TrapPrice has tapped into the 4H Liquidity Area after breaking above resistance, now consolidating around the CHoCH wait zone. A decisive move from here could set the tone – either continuation towards new highs or a sharp rejection back below. Traders eyeing this setup should watch liquidity grabs and confirmation signals closely before entering.

THE KOG REPORTTHE KOG REPORT
In last week’s KOG Report we said we would be looking for price to test that 3550-55 region and hopefully get a rejection there taking us downside into the lower levels and targets. This move worked well, although we got 3358 it completed into the red box defence. It’s at that defence level and the one below that we said opportunities to long may arise, which as you can see they did.
We then released the back test and report for Jackson hole mid-week. In this report we said we would be looking for a test on the low, and as long as it held we should see price push upside into the red box target levels. Again, a point to point, level to level move on this report hitting that target to a tee on the close!
So, what can we expect in the week ahead?
For this week we’re going to stick with the Jackson Hole report for the first couple of days of the week.
As you can see from last week the low held us well and the move completed into the red box that we wanted. We did have a arrow down here suggesting a short, and there was a reaction from this point, however, it’s a new week now so we’ll play price up here.
We have resistance above at the 3385-90 level with support below at the 3365-70 level. These are the levels that need to be watched hence we’ve put a range box on the chart. What we’re looking for here is price to attempt to play between the red boxes and inside this range due to there being now news in the early part of the week.
If we break above and support 3370, we’re likely to see this attempt the break of 3400 but the first destination is only slightly above 3420-25. A break below and we would hope to see price correct the whole move from Jackson Hole before then again attempting to rise, which for us is the ideal scenario here.
What we want traders to understand is that although we saw volume for Jackson Hole, we’re still playing the same range we’ve been in for the last two months. Price is simply in one huge accumulation before a bigger breakout!
That’s all for this report, as always, we’ll update as we go along through the week.
RED BOX TARGETS:
Break above 3375 for 3378, 3383, 3385, 3388 and 3392 in extension of the move
Break below 3365 for 3355, 3351, 3345 and 3335 in extension of the move
Please do support us by hitting the like button, leaving a comment, and giving us a follow. We’ve been doing this for a long time now providing traders with in-depth free analysis on Gold, so your likes and comments are very much appreciated.
As always, trade safe.
KOG

XAUUSD NEXT WEEK ? Greetings 👋
Thats My Gold View Next Week !
Recently Gold Pump At My QM Buy Setup And Now We Have Zones For Selling And Buying
Selling ZONE : 3390 / 3410 Buy Side Liquidity Zone When Its Take Liquidity Then It Will Drop
Buying ZONE : 3352 / 3349 CISD Another Buy Zone : 3338 / 3327 Buy Trendline + IFVG Setup
BEST OF LUCK 🤞

GOLD 4H CHART ROUTE MAP UPDATE & TRADING PLAN FOR THE WEEKHey Everyone,
Please see our updated 4h chart levels and targets for the coming week.
We are seeing price play between two weighted levels with a gap above at 3424 and a gap below at 3347. We will need to see ema5 cross and lock on either weighted level to determine the next range.
We will see levels tested side by side until one of the weighted levels break and lock to confirm direction for the next range.
We will keep the above in mind when taking buys from dips. Our updated levels and weighted levels will allow us to track the movement down and then catch bounces up.
We will continue to buy dips using our support levels taking 20 to 40 pips. As stated before each of our level structures give 20 to 40 pip bounces, which is enough for a nice entry and exit. If you back test the levels we shared every week for the past 24 months, you can see how effectively they were used to trade with or against short/mid term swings and trends.
The swing range give bigger bounces then our weighted levels that's the difference between weighted levels and swing ranges.
BULLISH TARGET
3424
EMA5 CROSS AND LOCK ABOVE 3424 WILL OPEN THE FOLLOWING BULLISH TARGETS
3499
EMA5 CROSS AND LOCK ABOVE 3499 WILL OPEN THE FOLLOWING BULLISH TARGET
3561
BEARISH TARGETS
3347
EMA5 CROSS AND LOCK BELOW 3347 WILL OPEN THE FOLLOWING BEARISH TARGET
3277
EMA5 CROSS AND LOCK BELOW 3277 WILL OPEN THE SWING RANGE
3234
3171
EMA5 CROSS AND LOCK BELOW 3171 WILL OPEN THE SECONDARY SWING RANGE
3089
2996
As always, we will keep you all updated with regular updates throughout the week and how we manage the active ideas and setups. Thank you all for your likes, comments and follows, we really appreciate it!
Mr Gold
GoldViewFX

GOLD 1H CHART ROUTE MAP UPDATE & TRADING PLAN FOR THE WEEKHey Everyone,
Please see our updated 1h chart levels and targets for the coming week.
We are seeing price play between two weighted levels with a gap above at 3390 and a gap below at 3365. We will need to see ema5 cross and lock on either weighted level to determine the next range.
We will see levels tested side by side until one of the weighted levels break and lock to confirm direction for the next range.
We will keep the above in mind when taking buys from dips. Our updated levels and weighted levels will allow us to track the movement down and then catch bounces up.
We will continue to buy dips using our support levels taking 20 to 40 pips. As stated before each of our level structures give 20 to 40 pip bounces, which is enough for a nice entry and exit. If you back test the levels we shared every week for the past 24 months, you can see how effectively they were used to trade with or against short/mid term swings and trends.
The swing range give bigger bounces then our weighted levels that's the difference between weighted levels and swing ranges.
BULLISH TARGET
3390
EMA5 CROSS AND LOCK ABOVE 3390 WILL OPEN THE FOLLOWING BULLISH TARGETS
3422
EMA5 CROSS AND LOCK ABOVE 3422 WILL OPEN THE FOLLOWING BULLISH TARGET
3439
BEARISH TARGETS
3365
EMA5 CROSS AND LOCK BELOW 3365 WILL OPEN THE FOLLOWING BEARISH TARGET
3347
EMA5 CROSS AND LOCK BELOW 3347 WILL OPEN THE FOLLOWING BEARISH TARGET
3324
EMA5 CROSS AND LOCK BELOW 3324 WILL OPEN THE SWING RANGE
3304
3281
As always, we will keep you all updated with regular updates throughout the week and how we manage the active ideas and setups. Thank you all for your likes, comments and follows, we really appreciate it!
Mr Gold
GoldViewFX

GOLD 4H CHART ROUTE MAP UPDATE & TRADING PLAN FOR THE WEEKHey Everyone,
Please see our updated 4h chart levels and targets for the coming week.
We are seeing price play between two weighted levels with a gap above at 3361 and a gap below at 3293. We will need to see ema5 cross and lock on either weighted level to determine the next range.
We will see levels tested side by side until one of the weighted levels break and lock to confirm direction for the next range.
We will keep the above in mind when taking buys from dips. Our updated levels and weighted levels will allow us to track the movement down and then catch bounces up.
We will continue to buy dips using our support levels taking 20 to 40 pips. As stated before each of our level structures give 20 to 40 pip bounces, which is enough for a nice entry and exit. If you back test the levels we shared every week for the past 24 months, you can see how effectively they were used to trade with or against short/mid term swings and trends.
The swing range give bigger bounces then our weighted levels that's the difference between weighted levels and swing ranges.
BULLISH TARGET
3361
EMA5 CROSS AND LOCK ABOVE 3361 WILL OPEN THE FOLLOWING BULLISH TARGETS
3424
EMA5 CROSS AND LOCK ABOVE 3424 WILL OPEN THE FOLLOWING BULLISH TARGET
3499
BEARISH TARGETS
3293
EMA5 CROSS AND LOCK BELOW 3293 WILL OPEN THE SWING RANGE
3236
3171
EMA5 CROSS AND LOCK BELOW 3171 WILL OPEN THE SECONDARY SWING RANGE
3089
2996
As always, we will keep you all updated with regular updates throughout the week and how we manage the active ideas and setups. Thank you all for your likes, comments and follows, we really appreciate it!
Mr Gold
GoldViewFX

GOLD DAILY CHART ROUTE MAPDaily Chart Update
Range Still in Control: Push Toward Resistance
Nothing has changed from last week’s update, price remains firmly trapped within the 3272–3433 range. The structure continues to hold, but last week we did start to see momentum push higher, with the market leaning toward another test of the 3433 ceiling.
Current Outlook
🔹 Range Still Active
Price continues to respect the 3272–3433 boundaries. Until we get a decisive break and hold, the range remains the play.
🔹 Upside Pressure Building
While still contained, price action is beginning to tilt upward, targeting a fresh challenge of 3433.
🔹 Support Holding Firm
3272 remains intact as the key floor. As long as this level holds, the bias within the range stays neutral-to-bullish.
Updated Key Levels
📉 Support – 3272
Still the pivotal buy zone. A breakdown would change the picture, but for now, it’s secure.
📈 Resistance – 3433
The critical ceiling remains. Bulls are pressing for another retest; only a break and hold above will shift market dynamics.
Thanks as always for your support,
Mr Gold
GoldViewFX

XAUUSD – The Calm Before the Storm (D1 Weekly Plan)🔥 Market Pulse
Last week closed with a powerful bullish D1 candle, fueled by FED’s policy hints & Trump’s latest remarks.
This wasn’t just news-driven – it was a liquidity shift, a signal that the next big directional play is loading.
⚔️ Key Battle Zones (MMFLOW View)
End Game Demand Zone (3273) → The last stronghold for buyers.
Power Reaction Zone (3316 – 3340) → First defense line where bulls are likely to step in hard.
Key Mid Zone (3357 – 3372) → The “gateway” level that decides if momentum will sustain.
Power Reaction Zone (3399) → Bears will strike back here.
End Game Supply Zone (3435) → The final battlefield – where the big game ends.
📈 Scenarios for the Week Ahead
Primary Plan (Bullish bias):
Gold may dip into 3316 – 3340 before resuming its upward leg.
Holding this zone opens the path to 3399 → 3435.
Alternative Plan (Risk case):
A break below 3316 could drag price back to 3273 before any bigger move.
🎯 Trading Approach
Buy on dips inside reaction zones.
Targets: 3399 – 3435.
Protective stop: Below 3273.
🚨 Final Takeaway:
Gold is entering a critical phase – this isn’t just another bounce, it could be the start of a medium-term breakout cycle.
Bulls have the upper hand, but both sides are preparing for the showdown. Stay ready for a volatility spike.
