XAU/USD Price Action Zones & Trade Setup (Aug 20, 2025)Analysis:
The market recently made a CHoCH (Change of Character), signaling a possible bearish structure.
First Selling Zone (3340 – 3350): Strong resistance area where sellers may push price down.
Second Selling Zone (3350 – 3360): A deeper liquidity grab area for confirmation shorts.
First Buying Area (3308 – 3320): Demand zone where buyers might step in for a short-term bounce.
Second Buying Area (3270 – 3280): Stronger demand, ideal for swing buy opportunities if price dips further.
Price is currently around 3323, hovering near equilibrium, likely to retest selling zones before dropping to buying areas.
📈 Trade Plan:
Sell Entries
🔹 First Short: Around 3340 – 3350 (First Selling Zone).
🔹 Second Short (confirmation): Around 3350 – 3360 (Second Selling Zone).
🎯 Targets:
TP1: 3320 (First Buying Area)
TP2: 3280 (Second Buying Area)
🛑 Stop Loss: Above 3365
Buy Entries
🔹 First Buy: Around 3310 – 3320 (First Buying Area) for a small bounce.
🔹 Second Buy (stronger): Around 3270 – 3280 (Second Buying Area).
🎯 Targets:
TP1: 3340 (back to resistance)
TP2: 3355 (liquidity above first selling zone)
🛑 Stop Loss: Below 3260
Goldtradingstrategy

XAUUSD – Gold in Tight Consolidation | Weekend Trading PlanGold is currently showing the classic sequence: accumulation – breakout – consolidation again. Price is moving within a narrowing triangle pattern, preparing for the next explosive move.
From both a technical perspective and the macro–geopolitical backdrop, Gold is hesitating to choose a clear direction in the short term. But remember: the tighter the range, the stronger the breakout.
👉 Strategy: Wait for the breakout, then follow the direction with clear key levels for reactions and take-profit setups.
🔑 Key Levels
Resistance: 3337 – 3343 – 3350 – 3356 – 3365
Support: 3325 – 3320 – 3314
📌 Scenario 1 – Buy Setup
Buy Zone: 3316 – 3314
SL: 3309
TP: 3320 – 3325 – 3330 – 3335 – 3340 – 3345 – 3350 – 3360 – 3370
📌 Scenario 2 – Sell Setup
Sell Scalp: 3348 – 3350
SL: 3355
TP: 3344 – 3340 – 3335 – 3330
Sell Zone (Main Reaction): 3365 – 3367
SL: 3372
TP: 3360 – 3355 – 3350 – 3345 – 3340
🎯 MMFLOW Notes
Price compression = incoming volatility.
Always prepare two scenarios when trading narrow ranges.
Patience is profit – wait for market confirmation at key levels.

GOLD ROUTE MAP UPDATEHey Everyone,
Quick follow up update on our 1H chart idea:
After completing both our Bullish target at 3352 and Bearish target at 3327, we saw a lock below 3327 which opened the swing range down towards 3304. Price did drop, but not the full test of 3304 before turning back up.
From there, we got the break back above 3327 and another retest of 3352. As expected, price rejected perfectly from 3352, came back down to 3327, and once again gave us a bounce. Now price is heading back up towards 3352.
At the moment, price is clearly rangebound between 3327 and 3352. To confirm the next breakout move, we will need to see the EMA5 cross and lock above or below either of these levels.
We also need to keep in mind the swing range gap left open yesterday in the 3304 region, which remains a possible target before higher moves continue.
So while we continue to buy dips, we must stay mindful that open swing ranges can extend moves further in either direction. Our updated levels and weighted levels allow us to track moves down and then catch the bounces up, as we’ve been doing.
We will continue to buy dips from our support levels, targeting 20 to 40 pips per bounce. As stated before, every level structure we share gives that range consistently, and the swing ranges give even bigger moves than the weighted levels.
BULLISH TARGET
3352 - DONE
EMA5 CROSS AND LOCK ABOVE 3352 WILL OPEN THE FOLLOWING BULLISH TARGETS
3374
EMA5 CROSS AND LOCK ABOVE 3374 WILL OPEN THE FOLLOWING BULLISH TARGET
3398
EMA5 CROSS AND LOCK ABOVE 3398 WILL OPEN THE FOLLOWING BULLISH TARGET
3422
BEARISH TARGETS
3327 - DONE
EMA5 CROSS AND LOCK BELOW 3327 WILL OPEN THE SWING RANGE
3304
3281
As always, we will keep you all updated with regular updates throughout the week and how we manage the active ideas and setups. Thank you all for your likes, comments and follows, we really appreciate it!
Mr Gold
GoldViewFX

XAUUSD: Channel Ride to the Top or Fakeout Incoming?Gold is moving inside an uptrend channel, building momentum after bouncing from support. Right now, price is testing the key zone 3344 – 3348 – this is where the market will decide its next move.
📊 MMFLOW Outlook
✅ Scenario 1: Trend continuation (main bias)
Holding above 3344 – 3348 keeps the bullish structure intact.
A clean breakout over 3348.7 opens the path to:
→ Target 1: 3361.2
→ Target 2: 3369.8 (top of the channel)
⚠️ Scenario 2: Deeper retest before the move
If price rejects 3348 – 3351, a dip back to 3334 is likely.
Buyers may step in here to reload positions and push price higher.
A break below 3334 would weaken the bullish setup short-term.
📌 Key Levels (NY Session):
Support: 3334 | 3344 – 3348
Resistance: 3361.2 | 3369.8
✨ MMFLOW Note:
👉 Bias stays bullish, but patience at liquidity zones is key.
👉 Follow the flow – manage risk before the market makes the move.

Gold Breakout Ahead of FOMC – Next Step Trading PlanGold Breakout Ahead of FOMC – Key Levels & Trading Plan
Gold surged strongly in line with MMFLOW’s previous outlook, breaking through short-term resistances and the descending trendline within just one session. This early breakout ahead of the FOMC meeting signals that bullish momentum is firmly in play.
Even though price moved before the actual FOMC release, the market confirmed our directional bias: after clearing liquidity below, Gold quickly bounced back, reclaiming higher zones. With positive fundamentals supporting the metal in the long run, the bullish case for XAUUSD remains intact.
Currently, structure shows a clean breakout of the bearish channel, and we are waiting for a retest of KeyLevels today to fuel the next bullish leg.
📊 MMFLOW Market Outlook
Primary Bias: Bullish – Buy the dips
Scenarios:
🔹 Buy opportunities near strong support levels
🔹 Tactical sells only at confirmed resistance with rejection
Daily chart left a strong bullish confirmation candle, suggesting that pullbacks are opportunities to reload long positions.
🔥 Trading Plan – Buy/Sell Zones & Scalp Strategy
✅ BUY SCALP
Entry: 3333 – 3331
Stop Loss: 3327
Take Profit: 3338 – 3343 – 3348 – 3352 – 3356 – 3360 – ???
✅ BUY ZONE (Swing/Position)
Entry: 3316 – 3314
Stop Loss: 3310
Take Profit: 3320 – 3325 – 3330 – 3335 – 3340 – 3350 – 3360 – ???
🔻 SELL ZONE
Entry: 3368 – 3370
Stop Loss: 3375
Take Profit: 3364 – 3360 – 3355 – 3350 – 3345 – 3340 – 3330
📌 Key Levels to Watch
Supports: 3332 – 3323 – 3315
Resistances: 3348 – 3362 – 3370 – 3383
🚨 Risk Note:
If price dips too deep into 331x, beware of potential liquidity traps. Always respect your TP/SL as volatility remains high around FOMC events.
✨ MMFLOW Reminder:
👉 KeyLevels = Profits.
👉 Buy the dips, ride the bullish pump.

THE KOG REPORT - Jackson Hole Pt 2Jackson Hole 2025:
Here’s what to expect from the 2025 Jackson Hole Economic Policy Symposium, held August 21–23 in Jackson Hole, Wyoming:
Event Overview & Theme
• The 48th annual symposium is hosted by the Federal Reserve Bank of Kansas City from August 21 to 23, 2025.
• The theme is “Labour Markets in Transition: Demographics, Productivity, and Macroeconomic Policy.” It focuses on structural changes like aging populations, fertility declines, declining labour mobility, and the evolving role of AI in labour markets.
• The full agenda will be released on Thursday evening, August 21, with Federal Reserve Chair Jerome Powell’s speech scheduled for Friday morning (U.S. time): 10 a.m. EDT / 8 a.m. MDT.
Key Participants & Format
• A select group of around 120 invitees will attend, including central bankers, policymakers, academics, and journalists.
• Formats include research paper presentations, panels, Q&As, and the keynote address. All presentations and transcripts will be published online during and after the event
What to Watch For
1. Powell’s Speech & Policy Signals
Powell’s keynote—titled "Economic Outlook and Framework Review"—is expected to outline possible interest-rate decisions, update the Federal Reserve’s policy framework, and respond to critiques that its 2020 approach delayed necessary responses to inflation.
This is likely one of his most consequential speeches, delivered amid mounting political pressure, internal Fed disagreements, and a contested labour market environment.
2. Global Central Bankers & International Engagement
Notable international participants include ECB President Christine Lagarde and likely the Bank of England’s Andrew Bailey, expected to join panels on Saturday.
Their contributions will underscore the symposium’s global reach and offer comparative perspectives on monetary policy challenges.
3. Market Expectations & Reactions
Markets anticipate a 25 basis-point rate cut in September, with several sources placing the probability at ~85%.
Simultaneously, investor caution is elevated due to geopolitical tensions—especially around Trump’s influence, Ukraine talks, and tech policy developments.
4. Broader Economic Context
The symposium takes place amid mixed U.S. data: weak job growth and rising producer prices raise concerns about both slowing labour markets and persistent inflation.
Retail earnings (e.g. Target, Walmart, Home Depot) and recent CPI data also add to the backdrop, offering clues on consumer resilience and inflation trends.
GOLD:
Based on the back test of the event they tend to test the low of the range which in this scenario is around the 3280-90 region, however, if we look at the structure we do have a reversal in play here with the support level being the 3330-25 level. Above 3330 we have that extension of the move we spoke about last week 3360-65 which is still untouched. So, if we that in mind and they support that lower level in the coming session, there is a possibility they take us up into that region sitting around 3360-75 due to the volume that is expected, and if rejected they correct that move downside to again attempt to break through the 3300 level. The key level in this scenario is 3375 which needs to be broken to go higher taking us above 3400.
On the flip. 3330-20 breaks forcefully, in this scenario there is possibility that for price to attempt the range low sitting around the 3280 level which needs to hold in order to go back up. Please note, an aggressive swing here can break through that level resulting in a move all the way back down into the 3230-50 levels before then exhausting.
The range is huge and where we’ve seen 500-700pip movement over the years, we’re seeing over a couple of days lately, so we need to exaggerate every move and only look at the extreme levels.
RED BOX TARGETS:
Break above 3350 for 3360, 3365, 3374, 3390 and 3420 in extension of the move
Break below 3335 for 3320, 3310, 3305, 3297, 3280 and 3265 in extension of the move
What we’re trying to show you here is that its going to be a very difficult event to trade for new traders. Its going to be choppy, its going to be volatile, its going to whipsaw and its likely to move. If you’re caught the wrong side of it its going to kill your account. Best practice here is to let the market make the moves it wants to, wait for the price to settle in whatever level they want to drive it to, once this has happened then look for the setup to get in to the trade.
Please do support us by hitting the like button, leaving a comment, and giving us a follow. We’ve been doing this for a long time now providing traders with in-depth free analysis on Gold, so your likes and comments are very much appreciated.
As always, trade safe.
KOG
The link below will take you to the previous report on this event:

GOLD ROUTE MAP UPDATEHey Everyone,
Quick follow up update on our 1H chart idea:
After completing both our Bullish target at 3352 and Bearish target at 3327, we now have a lock below 3327 which opened the swing range down towards 3304. We did get the drop, but not the full test of 3304 before price turned back up.
Right now, we are seeing a break back above 3327 and heading towards a retest of 3352 once again. This is in line with our ongoing plan to buy dips, but we must also keep in mind that the swing range remains open. This means any swings can still clear the gap left in that 3304 region before moving higher.
So, while we continue to buy dips, we need to be mindful that open swing ranges can extend moves in either direction.
We will keep the above in mind when taking buys from dips. Our updated levels and weighted levels will allow us to track the movement down and then catch bounces up.
We will continue to buy dips using our support levels taking 20 to 40 pips. As stated before each of our level structures give 20 to 40 pip bounces, which is enough for a nice entry and exit. If you back test the levels we shared every week for the past 24 months, you can see how effectively they were used to trade with or against short/mid term swings and trends.
The swing range give bigger bounces then our weighted levels that's the difference between weighted levels and swing ranges.
BULLISH TARGET
3352 - DONE
EMA5 CROSS AND LOCK ABOVE 3352 WILL OPEN THE FOLLOWING BULLISH TARGETS
3374
EMA5 CROSS AND LOCK ABOVE 3374 WILL OPEN THE FOLLOWING BULLISH TARGET
3398
EMA5 CROSS AND LOCK ABOVE 3398 WILL OPEN THE FOLLOWING BULLISH TARGET
3422
BEARISH TARGETS
3327 - DONE
EMA5 CROSS AND LOCK BELOW 3327 WILL OPEN THE SWING RANGE
3304
3281
As always, we will keep you all updated with regular updates throughout the week and how we manage the active ideas and setups. Thank you all for your likes, comments and follows, we really appreciate it!
Mr Gold
GoldViewFX

Gold Break Strong After Liquidity Sweep Next Target Before FOMCXAUUSD Update | Gold Breaks Strong After Liquidity Sweep – Next Target Before FOMC
Gold has made a powerful bullish comeback, exactly as anticipated in the MMFLOW Trading Plan. After clearing liquidity below, price quickly reversed and is now showing strong buying pressure. This move was no surprise, as the current market structure clearly supports a bullish breakout – and today we may even see price break above the H1 downtrend line ahead of the FOMC statement.
📈 Active Buy Entries from Plan:
✅ Buy 3314 → Now +340 PIPS
✅ Buy 3318 (DCA) → Now +300 PIPS
✅ Buy 3325 (DCA) → Now +230 PIPS
👉 For now, traders should stick with the bullish momentum. Short positions should only be considered if there is confirmed sell volume.
🔑 Key Trading Levels:
📍 3370 – Major level to watch for potential SELL setups.
Market reaction around this zone will be crucial, especially before FOMC, which is expected to bring high volatility.
⚡️ Trading Tip: Follow the trend, respect KeyLevels, and manage risk carefully. With FOMC around the corner, the market could deliver explosive opportunities.
✨ Once again – KeyLevels = Profits ✅

XAUUSD Daily Plan | Gold Awaits FOMC – Liquidity Hunt in ActionXAUUSD Daily Plan | Gold Awaits FOMC – Liquidity Hunt in Action
Gold continued to move lower into liquidity during the late US session yesterday and reacted strongly at the BUY ZONE 3314 – 3316 (MMFLOW Entry), already giving more than +70 pips profit so far ✅.
On the M5 – M15 short-term structure, Gold is showing a mild recovery. However, for buyers to take control, price must break the resistance at 3320 – 3322 with strong volume. A confirmed breakout here can trigger further upside momentum and retest higher KeyLevels.
📈 Upside Targets (Intraday): 333x and 334x – these levels may act as Take-Profit zones for longs or potential SELL opportunities in line with the corrective channel on M30 – H1.
🔔 Fundamental Focus – FOMC Meeting Ahead
Today, the FOMC meeting will be the key event during the US session. Traders are waiting for clues about the Fed’s rate decision. Any dovish signals about a possible rate cut in September could be the catalyst for a strong Gold rally, breaking the current bearish channel.
👉 During the Asia – Europe sessions, intraday bias remains bullish towards 333x – 334x, where we will also watch for selling opportunities.
⚠️ During the US session, expect high volatility with FOMC, so manage risk carefully.
📉 Technical Trading Plan
🔹 BUY Scalp Setup
Entry: 3311 – 3309
SL: 3305
TP: 3315 → 3320 → 3325 → 3330 → 3340 → 3350 → 3360+
🔹 BUY Zone (FOMC Plan)
Entry: 3290 – 3288
SL: 3282
TP: 3295 → 3330 → 3335 → 3340 → 3350 → 3360 → 3370+
🔸 SELL Scalp Setup
Entry: 3342 – 3344
SL: 3348
TP: 3338 → 3332 → 3328 → 3324 → 3320
🔸 SELL Zone (FOMC Plan)
Entry: 3360 – 3362
SL: 3368
TP: 3355 → 3350 → 3345 → 3340 → 3330
⚠️ Trading Notes
FOMC will bring high-impact volatility – stay alert.
Stick to TP/SL discipline and risk management to protect capital.
Remember: KeyLevels = Profits ✅

XAUUSD Update | Gold Builds Energy Ahead of FOMCGold continues to consolidate within a tight range, with selling pressure becoming more visible. With just over a day left until the FOMC meeting – a key event that could set the tone for the next major trend – the market seems to be loading up for a liquidity sweep.
👉 While price action may look messy and indecisive, for KeyLevel traders, this is the perfect hunting ground. Liquidity zones are being respected with precision, offering clean setups for those who understand MMFLOW structures.
📉 Market Outlook
Primary Bias: Short-term corrective downside.
Possible Play: Liquidity grab into the 331x area before a strong rebound higher.
🔑 Key Trading Levels
Sell Zone: 3340 – 3345 | Tight SL: 4 – 5 pts
🎯 Targets: 3325 → 3317 → stretch 3310
📌 Note: Stay disciplined around these KeyLevels. One sharp BreakOut post-FOMC could trigger the next big directional move.
✨ As always with MMFLOW: KeyLevels = Profits ✅
🔥 Follow MMFLOW TRADING to catch daily setups, smart money footprints, and precision KeyLevels.

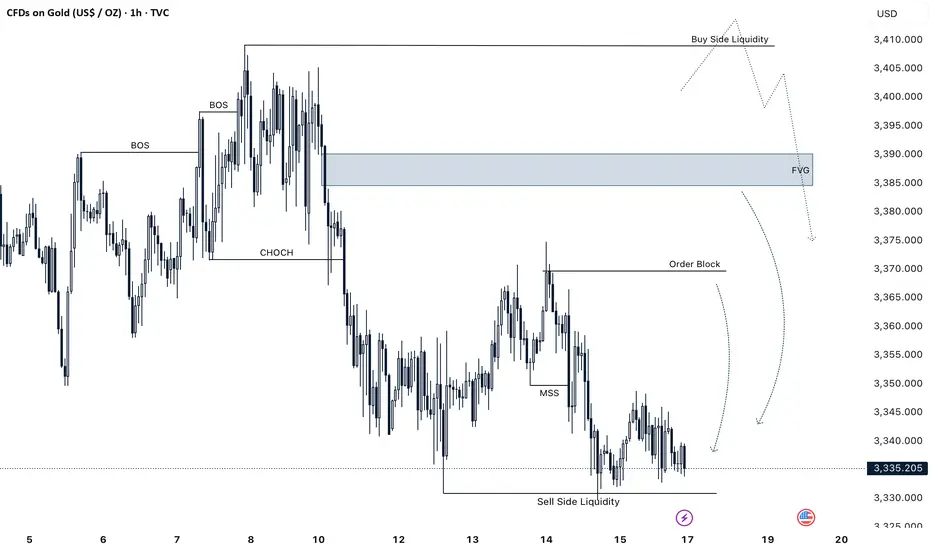
GOLD H2 MAPPINGGold Taking Sell Sides Liquidity In Today Range So We Are Expecting Also The Below Liquidities
Then We Are Expecting A Bullish Rally Setup On Order Block A High Probability Setup With 90% Accuracy
So Lets Talk About Entry And Target , SL
ENTRY OB BOX AREA : 3300 , 3285
TP LEVELS 200 / 700 PIPS HOLD TARGET
SL AREA : 3267 , 3255
Manage Your Trade Properly And Follow Us For More Trades

Gold in Tight Range | Waiting for the Big BreakOut After FOMC!Gold is currently consolidating within a narrow range, building momentum for a potential major BreakOut.
After Monday’s liquidity sweep, price has been moving strongly between 332x – 335x, but on the H1 timeframe it still remains locked in a descending channel.
Last week’s CPI & PPI data failed to set a clear direction, which is why this week’s focus will shift to the FOMC meeting. This is expected to deliver the decisive signal for gold’s next big move.
⏳ Early–Mid Week: With fewer major events, gold is likely to continue sideways within the narrow range or remain under mild selling pressure until the FOMC release.
🔑 Key Market Levels
Resistance: 3357 – 3369 – 3383 – 3398
Support: 3335 – 3317 – 3309
📌 Trading Setup
✅ BUY Zone: 3334 – 3332
SL: 3328
TP: 3338 – 3342 – 3346 – 3350 – 3355 – 3360 – 3370 – 3380
👉 A breakout above 336x could trigger a strong rally towards 3383 – 3398.
✅ SELL Zone: 3383 – 3385
SL: 3390
TP: 3378 – 3374 – 3370 – 3360 – 3350
👉 If gold fails at high resistance and reverses, it could sweep liquidity back to 333x – 331x, and potentially deeper towards 329x.
⚠️ Summary
Gold is at a critical decision point: BreakOut or BreakDown.
Before FOMC: expect sideways / mild downside inside H1 channel.
After FOMC: anticipate a strong Pump or Dump that will set the next trend.
🔥 Watch key levels 333x – 336x – 338x closely for market reactions and adjust strategy accordingly.
Gold on Fire: Bulls Eye an Unrelenting Surge to 3365–3375Although gold has been weak recently, we have still achieved impressive results in gold long trading because it touched 3375 and 3358 twice during the rebound process. We have made a total profit of more than 900 pips in the long trading, which can be said to be a very successful transaction in the short term.
At present, gold maintains an overall volatile market, but in the short term, gold has never effectively fallen below the 3330-3320 area. What is more obvious is that the dense trading area below is concentrated in the 3330-3310 area, so the buying support below is strong, which greatly limits the downward space of gold; in addition, gold touched around 3358 during today's rebound, and once broke through Friday's intraday high, which to a certain extent strengthened the market bullish sentiment. Therefore, when gold retreats again, there may be more buying funds willing to enter the market.
In terms of fundamentals, the ceasefire and peace between Russia and Ukraine have not yet been settled, and the geopolitical situation remains tense; and the market's expectations for the Federal Reserve to cut interest rates are gradually strengthening. Against this background, gold still has the possibility of rising again.
Therefore, in the short term, I still prefer to trade gold long. We can consider buying gold in the 3340-3330 area, first looking at the target 3365-3375 area, and even continuing the upward trend to around 3380.

GOLD ROUTE MAP UPDATEHey Everyone,
Great start to the week with our chart idea playing out as analysed.
We got our Bullish target hit at 3352 followed with no ema5 cross an d lock confirming the rejection. We are now seeing price head towards the bearish target.
We will see levels tested side by side until one of the weighted levels break and lock to confirm direction for the next range.
We will keep the above in mind when taking buys from dips. Our updated levels and weighted levels will allow us to track the movement down and then catch bounces up.
We will continue to buy dips using our support levels taking 20 to 40 pips. As stated before each of our level structures give 20 to 40 pip bounces, which is enough for a nice entry and exit. If you back test the levels we shared every week for the past 24 months, you can see how effectively they were used to trade with or against short/mid term swings and trends.
The swing range give bigger bounces then our weighted levels that's the difference between weighted levels and swing ranges.
BULLISH TARGET
3352 - DONE
EMA5 CROSS AND LOCK ABOVE 3352 WILL OPEN THE FOLLOWING BULLISH TARGETS
3374
EMA5 CROSS AND LOCK ABOVE 3374 WILL OPEN THE FOLLOWING BULLISH TARGET
3398
EMA5 CROSS AND LOCK ABOVE 3398 WILL OPEN THE FOLLOWING BULLISH TARGET
3422
BEARISH TARGETS
3327
EMA5 CROSS AND LOCK BELOW 3327 WILL OPEN THE SWING RANGE
3304
3281
As always, we will keep you all updated with regular updates throughout the week and how we manage the active ideas and setups. Thank you all for your likes, comments and follows, we really appreciate it!
Mr Gold
GoldViewFX

GOLD NEXT WEEK IDEA Hello Its ZGM
Next Week Gold Setups Looking 👀
Gold Takes Sell Side Liquidity
Now We Are Expecting Gold Next Move Will Be Bullish Then We Are Going To Sell At Order Block Price : 3368/3375 Selling Area
Next Zone For Sell At FVG Price : 3383/3390
Low Risk Sell Zone BSL Area Price : 3404/3412
Manage Your Trade Properly And Follow Us For More Trades
GOLD 1H CHART ROUTE MAP UPDATE & TRADING PLAN FOR THE WEEKHey Everyone,
Please see our updated 1h chart levels and targets for the coming week.
We are seeing price play between two weighted levels with a gap above at 3352 and a gap below at 3327. We will need to see ema5 cross and lock on either weighted level to determine the next range.
We will see levels tested side by side until one of the weighted levels break and lock to confirm direction for the next range.
We will keep the above in mind when taking buys from dips. Our updated levels and weighted levels will allow us to track the movement down and then catch bounces up.
We will continue to buy dips using our support levels taking 20 to 40 pips. As stated before each of our level structures give 20 to 40 pip bounces, which is enough for a nice entry and exit. If you back test the levels we shared every week for the past 24 months, you can see how effectively they were used to trade with or against short/mid term swings and trends.
The swing range give bigger bounces then our weighted levels that's the difference between weighted levels and swing ranges.
BULLISH TARGET
3352
EMA5 CROSS AND LOCK ABOVE 3352 WILL OPEN THE FOLLOWING BULLISH TARGETS
3374
EMA5 CROSS AND LOCK ABOVE 3374 WILL OPEN THE FOLLOWING BULLISH TARGET
3398
EMA5 CROSS AND LOCK ABOVE 3398 WILL OPEN THE FOLLOWING BULLISH TARGET
3422
BEARISH TARGETS
3327
EMA5 CROSS AND LOCK BELOW 3327 WILL OPEN THE SWING RANGE
3304
3281
As always, we will keep you all updated with regular updates throughout the week and how we manage the active ideas and setups. Thank you all for your likes, comments and follows, we really appreciate it!
Mr Gold
GoldViewFX

GOLD DAILY CHART ROUTE MAPDaily Chart Update
Range Still in Control: Same Boundaries, Same Play
Not much has changed since last week. Price continues to rotate within the 3272–3433 range, respecting the structure with precision. The week’s action stayed contained inside this 170+ pip zone, reinforcing the dominance of the range.
As we head into the new week, the outlook remains the same: watching 3433 as upside resistance, while 3272 continues to anchor support. Until one side breaks and holds, range trading strategies remain the focus.
Current Outlook
🔹 Range Still Active
Price is firmly contained between 3272 and 3433. A decisive break outside this box is still required for a trend shift.
🔹 Same Rejections
The market has yet to sustain above 3433. Resistance stands firm.
🔹 Support Holding
As long as 3272 holds, bias stays neutral-to-bullish within the range, with eyes on another potential 3433 retest.
Updated Key Levels
📉 Support – 3272
Still the key pivot and buy zone unless a confirmed breakdown occurs.
📈 Resistance – 3433
Unchanged as the main ceiling. A break and hold above would shift dynamics, but until then, sellers remain in control at this level.
Thanks as always for your support,
Mr Gold
GoldViewFX

GOLD WEEKLY CHART MID/LONG TERM ROUTE MAPHey Everyone,
Please see our weekly chart update.
3387 Rejected, 3482 Gap Still Open
Following up on last week’s close above 3387, price has since shown rejection at that same level, leaving the 3482 gap still unfilled from the previous candle body. This pullback now highlights the 3281 gap below as support, keeping the broader structure intact but tempering the immediate upside momentum.
We’re watching for a potential re-challenge of 3387 before the path toward 3482 can resume. Until then, the market remains range-bound within these structural pivots.
Current Outlook
🔹 3387 Rejection
Despite previous week’s close above, price could not sustain higher, confirming 3387 as a tough barrier in the short term.
🔹 3281 as Key Support
The gap below sits at 3281, which remains the anchor pivot. As long as it holds, buyers have the chance to reload.
🔹 3482 Still Open
The unfilled gap to 3482 remains the long-term upside target. A re-test and hold above 3387 is needed before momentum can extend toward that objective.
Updated Levels to Watch
📉 Support – 3281
Critical base. A breakdown here would shift structure bearish.
📈 Resistance – 3387
Now the immediate barrier. Expect this to be re-challenged before further upside can develop.
📈 Upside Gap Target – 3482
Still open from previous structure. Comes into play only if 3387 can be cleared decisively.
Plan:
Price is consolidating between 3281 and 3387, with 3482 waiting above. Until 3387 is reclaimed on a closing basis, range trading remains the play. A clean break above flips bias bullish toward 3482, while failure at 3281 risks a deeper rotation.
Thanks as always for your support,
Mr Gold
GoldViewFX

GOLD ROUTE MAP UPDATEHey Everyone,
Great finish to the week with our chart idea playing out as analyzed. In yesterday’s update, we stated that the 3329 full gap remained open and that we had another cross-and-lock confirming this.
That gap has now been completed perfectly and also gave the reaction and bounce in line with our plan to buy dips. As long as this level holds, we should continue to see bounces. A cross-and-lock below this level, however, will open up the swing range.
We will keep the above in mind when taking buys from dips. Our updated levels and weighted levels will allow us to track the movement down and then catch bounces up.
We will continue to buy dips using our support levels taking 20 to 40 pips. As stated before each of our level structures give 20 to 40 pip bounces, which is enough for a nice entry and exit. If you back test the levels we shared every week for the past 24 months, you can see how effectively they were used to trade with or against short/mid term swings and trends.
The swing range give bigger bounces then our weighted levels that's the difference between weighted levels and swing ranges.
BULLISH TARGET
3403
EMA5 CROSS AND LOCK ABOVE 3403 WILL OPEN THE FOLLOWING BULLISH TARGETS
3422
EMA5 CROSS AND LOCK ABOVE 3422 WILL OPEN THE FOLLOWING BULLISH TARGET
3439
BEARISH TARGETS
3377 - DONE
EMA5 CROSS AND LOCK BELOW 3377 WILL OPEN THE FOLLOWING BEARISH TARGET
3354 - DONE
EMA5 CROSS AND LOCK BELOW 3354 WILL OPEN THE FOLLOWING BEARISH TARGET
3329 - DONE
EMA5 CROSS AND LOCK BELOW 3329 WILL OPEN THE SWING RANGE
3304
3281
We will now come back Sunday with a full multi timeframe analysis to prepare for next week’s setups, including updated views on the higher timeframes, EMA alignments, and structure expectations going forward.
Thanks again for all your likes, comments, and follows.
Wishing you all a fantastic weekend!!
Mr Gold
GoldViewFX

Last chance to go long on goldAlthough the initial jobless claims and PPI data were bearish for gold, it still failed to break below 3340-3330 area. After touching 3340, it rebounded to around 3356, demonstrating that a significant amount of buying capital was still entering the gold market during the pullback, limiting the downside while also providing strong support.
Although gold has experienced several setbacks in its short-term upward trend, the bullish pattern has not completely failed. It remains within an ascending triangle structure in the short term. As long as this structure remains intact, gold could potentially rebound to the 3365-3375 area, or even to the 3380-3390 area, leveraging structural support.
Currently, there is a fierce game between bulls and bears in the short term for gold, which brings considerable difficulties to our short-term trading, but why do I keep insisting on going long on gold? What I want to say is that when you are uncertain in the short term, you can zoom in on the chart period and observe. In fact, the trend is clear at a glance, but there are some twists and turns in the short term!
Therefore, in the short term, I still advocate seeking to go long on gold with the 3345-3335 area as support, first looking at the target 3365-3375 area. If gold breaks through this area strongly during the rebound, the upward trend can continue to around 3380.

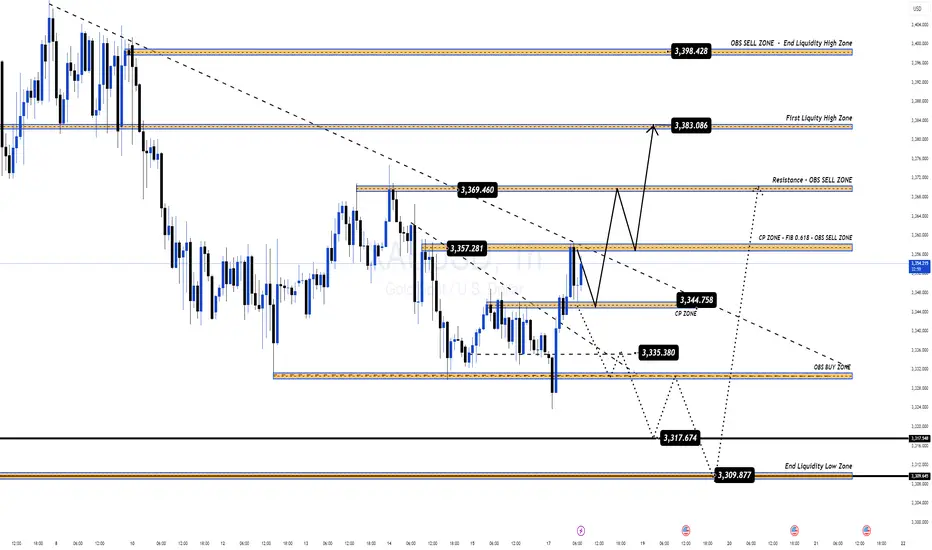
GOLD HOLDS 3330 LIQUIDITY ZONE – BULLISH REVERSAL IN PLAY!📌 Market Overview
Gold has firmly held the 3330 liquidity support zone and bounced back strongly, now trading around 334x, forming a clean bullish structure on the M30 chart.
If the current momentum continues, price is likely to target the FIB resistance & CP Zones above at 335x and 336x in the short term.
On higher timeframes, the corrective wave is still present, but intraday traders must stay alert – today’s geopolitical headlines from the Trump–Putin meeting could inject volatility. Friday’s usual liquidity sweeps also add risk, so stay adaptive and avoid getting trapped by false breaks.
🧐 Key Technical Insights (MMFLOW Analysis)
CP Resistance 3355 aligns with a strong OBS SELL ZONE – watch for reaction here.
Further upside resistance near the 0.62 FIB level. If price reaches this early in the Asian or early London session, it’s a valid short setup. Late London or NY session tests could be false break traps due to the confluence with the downtrend line.
BUY Entries are still valid from 3334–3336 for early intraday longs, with SL below 3330. If 3330 breaks, wait for deeper liquidity at 331x before buying again.
🎯 Trading Plan – MMFLOW Strategy
🔹 BUY ZONE
Entry: 3334 – 3336
SL: 3330
TP: 3340 – 3345 – 3350 – 3355 – 3360 – 3365 – 3370 – 3380
🔹 SELL ZONE
Entry: 3355 (OBS SELL) or 0.62 FIB confluence
SL: Above 3362
TP: 3350 – 3345 – 3340 – 3335 – 3330
📊 Key Levels
Resistance: 3355 – 3362 – 3370
Support: 3336 – 3330 – 331x
💡 MMFLOW Comment:
The best approach today is trend-following buys from liquidity zones while monitoring intraday resistance for short scalps. Geopolitical headlines and Friday liquidity sweeps may trigger traps – trade smart, not just fast.

Fed Set to Cut 50bps: Gold Benefits as the Bullish Wave Reforms📌 Market Overview
Gold surged as high as $3,370/oz before closing at $3,355.9 (+0.24%), fuelled by growing expectations that the Federal Reserve could deliver a 50bps rate cut in September.
US Treasury Secretary Bessent signalled strong support for such a move, while July CPI remained soft — weighing on the USD and pushing bond yields lower, giving gold a clear upside path.
However, upside momentum was capped by US equities hitting fresh record highs and a cooling in geopolitical tensions.
Markets now turn their focus to the upcoming PPI data, jobless claims, and the Trump–Putin meeting to gauge gold’s next move.
🧐 Technical Outlook – MMFLOW Perspective
The recovery wave is becoming increasingly evident after recent corrective moves. Price action is now poised to revisit liquidity zones from previous pullbacks.
Strategy remains to:
Buy early in pre-identified liquidity zones to ride the bullish wave within the current channel.
Sell from continuation or exhaustion zones once the next liquidity sweep is in play.
🎯 Trading Plan – MMFLOW
🔹 BUY ZONE – Early Long Setup
Entry: 3336 – 3334
Stop Loss: 3330
Take Profit: 3340 – 3345 – 3350 – 3355 – 3360 – 3365 – 3370 – 3380 – ???
🔹 SELL ZONE – Liquidity Grab Short Setup
Entry: 3394 – 3396
Stop Loss: 3400
Take Profit: 3390 – 3385 – 3380 – 3370 – 3360
📊 Key Levels
Resistance: 3365 – 3370 – 3395
Support: 3334 – 3330 – 3315
💡 MMFLOW Comment:
The technical structure supports a tactical buy-on-dip approach, with 334x being a key pivot zone for the bulls. If price accelerates towards 339x, watch for a liquidity sweep to trigger high-probability short setups.

GOLD ROUTE MAP UPDATEHey Everyone,
We are still seeing price action within the retracement range. The full gap below at 3329 remains open from the previous cross-and-lock, and we now have another cross-and-lock confirming this.
We expect a bounce at this level unless we see a further cross-and-lock below 3329, which would open the swing range. Until then, we also expect this level to provide a reaction.
We will keep the above in mind when taking buys from dips. Our updated levels and weighted levels will allow us to track the movement down and then catch bounces up.
We will continue to buy dips using our support levels taking 20 to 40 pips. As stated before each of our level structures give 20 to 40 pip bounces, which is enough for a nice entry and exit. If you back test the levels we shared every week for the past 24 months, you can see how effectively they were used to trade with or against short/mid term swings and trends.
The swing range give bigger bounces then our weighted levels that's the difference between weighted levels and swing ranges.
BULLISH TARGET
3403
EMA5 CROSS AND LOCK ABOVE 3403 WILL OPEN THE FOLLOWING BULLISH TARGETS
3422
EMA5 CROSS AND LOCK ABOVE 3422 WILL OPEN THE FOLLOWING BULLISH TARGET
3439
BEARISH TARGETS
3377 - DONE
EMA5 CROSS AND LOCK BELOW 3377 WILL OPEN THE FOLLOWING BEARISH TARGET
3354 - DONE
EMA5 CROSS AND LOCK BELOW 3354 WILL OPEN THE FOLLOWING BEARISH TARGET
3329
EMA5 CROSS AND LOCK BELOW 3329 WILL OPEN THE SWING RANGE
3304
3281
As always, we will keep you all updated with regular updates throughout the week and how we manage the active ideas and setups. Thank you all for your likes, comments and follows, we really appreciate it!
Mr Gold
GoldViewFX
