GOLD 1H CHART ROUTE MAP UPDATEHey everyone,
Please see update on our 1h chart idea.
After completing our Bullish targets yesterday, at 3236 and 3278; we stated that we would look for ema5 to lock above 3278 to open 3308.
- We got the lock above 3278, confirming 3308, which was hit perfectly today. We now have a ema5 cross and lock above 3308, opening the range above. Any rejections in this zone and we may see a retest of lower Goldturns for the usual weighted level bounces, inline with our plans to buy dips.
We will keep the above in mind when taking buys from dips. Our updated levels and weighted levels will allow us to track the movement down and then catch bounces up.
We will continue to buy dips using our support levels taking 20 to 40 pips. As stated before each of our level structures give 20 to 40 pip bounces, which is enough for a nice entry and exit. If you back test the levels we shared every week for the past 24 months, you can see how effectively they were used to trade with or against short/mid term swings and trends.
The swing range give bigger bounces then our weighted levels that's the difference between weighted levels and swing ranges.
BULLISH TARGET
3236 - DONE
EMA5 CROSS AND LOCK ABOVE 3236 WILL OPEN THE FOLLOWING BULLISH TARGETS
3278 - DONE
EMA5 CROSS AND LOCK ABOVE 3278 WILL OPEN THE FOLLOWING BULLISH TARGET
3308 - DONE
EMA5 CROSS AND LOCK ABOVE 3308 WILL OPEN THE FOLLOWING BULLISH TARGET
3343
EMA5 CROSS AND LOCK ABOVE 3343 WILL OPEN THE FOLLOWING BULLISH TARGETS
3373
EMA5 CROSS AND LOCK ABOVE 3373 WILL OPEN THE FOLLOWING BULLISH TARGETS
3418
BEARISH TARGETS
3184
EMA5 CROSS AND LOCK BELOW 3184 WILL OPEN THE FOLLOWING BEARISH TARGET
3146
EMA5 CROSS AND LOCK BELOW 3146 WILL OPEN THE SWING RANGE
3103
3069
EMA5 CROSS AND LOCK BELOW 3069 WILL OPEN THE SECONDARY SWING RANGE
3030
2981
As always, we will keep you all updated with regular updates throughout the week and how we manage the active ideas and setups. Thank you all for your likes, comments and follows, we really appreciate it!
Mr Gold
GoldViewFX
Goldtradingstrategy

GOLD 1H CHART ROUTE MAP UPDATEHey everyone,
It’s been another piptastic day in the markets with our 1H chart setup playing out beautifully.
We began with our bullish target at 3236, which was successfully hit. This was followed by EMA5 cross and lock that opened 3278, also reached perfectly. The entire range played out smoothly, giving ample time after confirmation for entries.
Looking ahead, we’ll be watching for an EMA5 cross and lock above 3278, which could open the path to 3308. A further lock above 3308 would open the potential for extended upside.
However, if price fails to lock above these key levels, we may see a retest of lower Goldturns for a potential bounce.
We will keep the above in mind when taking buys from dips. Our updated levels and weighted levels will allow us to track the movement down and then catch bounces up.
We will continue to buy dips using our support levels taking 20 to 40 pips. As stated before each of our level structures give 20 to 40 pip bounces, which is enough for a nice entry and exit. If you back test the levels we shared every week for the past 24 months, you can see how effectively they were used to trade with or against short/mid term swings and trends.
The swing range give bigger bounces then our weighted levels that's the difference between weighted levels and swing ranges.
BULLISH TARGET
3236 - DONE
EMA5 CROSS AND LOCK ABOVE 3236 WILL OPEN THE FOLLOWING BULLISH TARGETS
3278 - DONE
EMA5 CROSS AND LOCK ABOVE 3278 WILL OPEN THE FOLLOWING BULLISH TARGET
3308
EMA5 CROSS AND LOCK ABOVE 3308 WILL OPEN THE FOLLOWING BULLISH TARGET
3343
EMA5 CROSS AND LOCK ABOVE 3343 WILL OPEN THE FOLLOWING BULLISH TARGETS
3373
EMA5 CROSS AND LOCK ABOVE 3373 WILL OPEN THE FOLLOWING BULLISH TARGETS
3418
BEARISH TARGETS
3184
EMA5 CROSS AND LOCK BELOW 3184 WILL OPEN THE FOLLOWING BEARISH TARGET
3146
EMA5 CROSS AND LOCK BELOW 3146 WILL OPEN THE SWING RANGE
3103
3069
EMA5 CROSS AND LOCK BELOW 3069 WILL OPEN THE SECONDARY SWING RANGE
3030
2981
As always, we will keep you all updated with regular updates throughout the week and how we manage the active ideas and setups. Thank you all for your likes, comments and follows, we really appreciate it!
Mr Gold
GoldViewFX

GOLD 4H CHART ROUTE MAP UPDATEHey Everyone,
Great start tot he week with all our chart ideas playing out as analysed. This is an update on our 4H chart idea.
We began the week hitting our bullish target at 3235. Moving forward, we will monitor for a confirmed EMA5 cross and lock above 3235 to validate a potential move toward the next target at 3298.
If price fails to hold above 3235, we anticipate a retest of lower Goldturn support levels. These levels will serve as potential zones to identify bullish reversal opportunities.
We will keep the above in mind when taking buys from dips. Our updated levels and weighted levels will allow us to track the movement down and then catch bounces up.
We will continue to buy dips using our support levels taking 20 to 40 pips. As stated before each of our level structures give 20 to 40 pip bounces, which is enough for a nice entry and exit. If you back test the levels we shared every week for the past 24 months, you can see how effectively they were used to trade with or against short/mid term swings and trends.
The swing range give bigger bounces then our weighted levels that's the difference between weighted levels and swing ranges.
BULLISH TARGET
3235 - DONE
EMA5 CROSS AND LOCK ABOVE 3235 WILL OPEN THE FOLLOWING BULLISH TARGET
3298
EMA5 CROSS AND LOCK ABOVE 3298 WILL OPEN THE FOLLOWING BULLISH TARGET
3344
EMA5 CROSS AND LOCK ABOVE 3344 WILL OPEN THE FOLLOWING BULLISH TARGET
3394
EMA5 CROSS AND LOCK ABOVE 3394 WILL OPEN THE FOLLOWING BULLISH TARGET
3439
BEARISH TARGETS
3170
EMA5 CROSS AND LOCK BELOW 3170 WILL OPEN THE FOLLOWING BEARISH TARGET TARGET
3120
EMA5 CROSS AND LOCK BELOW 3120 WILL OPEN THE FOLLOWING BEARISH TARGET TARGET
3077
EMA5 CROSS AND LOCK BELOW 3077 WILL OPEN THE SWING RANGE
SWING RANGE
3236 - 3176
EMA5 CROSS AND LOCK BELOW 3176 WILL OPEN THE SECONDARY SWING RANGE
SWING RANGE
3033 - 2988
As always, we will keep you all updated with regular updates throughout the week and how we manage the active ideas and setups. Thank you all for your likes, comments and follows, we really appreciate it!
Mr Gold
GoldViewFX

THE KOG REPORTTHE KOG REPORT:
In last week’s KOG Report we said we would be looking for the price to attempt the higher resistance level shown on the chart which was slightly higher than the red box. We wanted this level to reject price and give us the move down into the level which was shown on the chart. As you can see this move worked from the open, respecting the red box active level instead and completing all the bias level bearish targets in one swoop after the break.
We then updated the KOG Report with the move we wanted in order to then long into immediate resistance to again test the short trade, which again worked while we suggested traders look for the lower red box levels to attempt the long trades.
There was slight stretch again downside, but those red boxes played their part giving us the move on confirmation for the longs towards the end of the week, ending the week on a high.
It was a difficult week to trade with aggressive movement across the markets, however, the levels are reacting well and although there is a stretch on price, we’re getting the movement we want.
So, what can we expect in the week ahead?
We have key level now on the daily also aligning with the EMA50 at 3162 on the daily chart, while that 4H shows us a possible reversal on the flip. For this reason we have given the immediate red box levels of 3225-30 resistance and 3190-85 support. We have also plotted the potential range of play for the early part of the week, where we feel price may stabilise until a further move.
We’re looking for two possible moves here, one in order to continue to short and then look for the longer trade lower down, or, a break of the red box and bias level into higher resistance upon which we’ll trade level to level and then look higher for a potential short again. The bias level for this week has a huge extension of the move so it will be tradeable both directions. We have applied filters to the algo which is under test so we’ll also want to see if that works in our favour.
So, for now, support below can give us the move into the 3225-30 region which is the level to watch for the break, if rejected there may be an opportunity to short but that short must break below the 3185 level to continue and complete the move downside into the 3150-55 and below that 3130 levels. That’s where we feel the opportunity to long for the swing may come from but please remember, it’s changed structure until we break and hold above the 3265 level. That will be this week’s key level.
KOG’s bias of the week:
Bearish below 3235 with targets below 3196, 3185, 3177, 3165 and 3155
Bullish on break of 3230 with targets above 3242, 3250, 3255 and 3262
RED BOXES:
Break above 3210 for 3118, 3220, 3225, 3230, 3235 and 3247 in extension of the move
Break below 3195 for 3187, 3179, 3165, 3155, 3150 and 3137 in extension of the move
Please do support us by hitting the like button, leaving a comment, and giving us a follow. We’ve been doing this for a long time now providing traders with in-depth free analysis on Gold, so your likes and comments are very much appreciated.
As always, trade safe.
KOG

GOLD set for another drop?As expected in our previous analysis XAUUSD bounced to daily resistance and started to get rejected with a strong momentum in the major direction of the trend. As we see series of lower high formation XAUUSD may continue to drop to daily support level following the long term trend.

GOLD 4H CHART ROUTE MAP UPDATE & TRADING PLAN FOR THE WEEKHey Everyone,
Please see our updated 4h chart levels and targets for the coming week.
We are seeing price play between two weighted levels with a gap above at 3215 and a gap below at 3170. We will need to see ema5 cross and lock on either weighted level to determine the next range. We have a bigger range in play then usual.
We will see levels tested side by side until one of the weighted levels break and lock to confirm direction for the next range.
We will keep the above in mind when taking buys from dips. Our updated levels and weighted levels will allow us to track the movement down and then catch bounces up.
We will continue to buy dips using our support levels taking 20 to 40 pips. As stated before each of our level structures give 20 to 40 pip bounces, which is enough for a nice entry and exit. If you back test the levels we shared every week for the past 24 months, you can see how effectively they were used to trade with or against short/mid term swings and trends.
The swing range give bigger bounces then our weighted levels that's the difference between weighted levels and swing ranges.
BULLISH TARGET
3215
EMA5 CROSS AND LOCK ABOVE 3215 WILL OPEN THE FOLLOWING BULLISH TARGET
3298
EMA5 CROSS AND LOCK ABOVE 3298 WILL OPEN THE FOLLOWING BULLISH TARGET
3344
EMA5 CROSS AND LOCK ABOVE 3344 WILL OPEN THE FOLLOWING BULLISH TARGET
3394
EMA5 CROSS AND LOCK ABOVE 3394 WILL OPEN THE FOLLOWING BULLISH TARGET
3439
BEARISH TARGETS
3170
EMA5 CROSS AND LOCK BELOW 3170 WILL OPEN THE FOLLOWING BEARISH TARGET TARGET
3120
EMA5 CROSS AND LOCK BELOW 3120 WILL OPEN THE FOLLOWING BEARISH TARGET TARGET
3077
EMA5 CROSS AND LOCK BELOW 3077 WILL OPEN THE SWING RANGE
SWING RANGE
3236 - 3176
EMA5 CROSS AND LOCK BELOW 3176 WILL OPEN THE SECONDARY SWING RANGE
SWING RANGE
3033 - 2988
As always, we will keep you all updated with regular updates throughout the week and how we manage the active ideas and setups. Thank you all for your likes, comments and follows, we really appreciate it!
Mr Gold
GoldViewFX

GOLD 1H CHART ROUTE MAP & TRADING PLAN FOR THE WEEKHey Everyone,
Please see our updated 1h chart levels and targets for the coming week.
We are seeing price play between two weighted levels with a gap above at 3236 and a gap below at 3184. We will need to see ema5 cross and lock on either weighted level to determine the next range.
We will see levels tested side by side until one of the weighted levels break and lock to confirm direction for the next range.
We will keep the above in mind when taking buys from dips. Our updated levels and weighted levels will allow us to track the movement down and then catch bounces up.
We will continue to buy dips using our support levels taking 20 to 40 pips. As stated before each of our level structures give 20 to 40 pip bounces, which is enough for a nice entry and exit. If you back test the levels we shared every week for the past 24 months, you can see how effectively they were used to trade with or against short/mid term swings and trends.
The swing range give bigger bounces then our weighted levels that's the difference between weighted levels and swing ranges.
BULLISH TARGET
3236
EMA5 CROSS AND LOCK ABOVE 3236 WILL OPEN THE FOLLOWING BULLISH TARGETS
3278
EMA5 CROSS AND LOCK ABOVE 3278 WILL OPEN THE FOLLOWING BULLISH TARGET
3308
EMA5 CROSS AND LOCK ABOVE 3308 WILL OPEN THE FOLLOWING BULLISH TARGET
3343
EMA5 CROSS AND LOCK ABOVE 3343 WILL OPEN THE FOLLOWING BULLISH TARGETS
3373
EMA5 CROSS AND LOCK ABOVE 3373 WILL OPEN THE FOLLOWING BULLISH TARGETS
3418
BEARISH TARGETS
3184
EMA5 CROSS AND LOCK BELOW 3184 WILL OPEN THE FOLLOWING BEARISH TARGET
3146
EMA5 CROSS AND LOCK BELOW 3146 WILL OPEN THE SWING RANGE
3103
3069
EMA5 CROSS AND LOCK BELOW 3069 WILL OPEN THE SECONDARY SWING RANGE
3030
2981
As always, we will keep you all updated with regular updates throughout the week and how we manage the active ideas and setups. Thank you all for your likes, comments and follows, we really appreciate it!
Mr Gold
GoldViewFX

GOLD DAILY CHART ROUTE MAP Hey Everyone,
Please see the daily chart update. As shown, the Goldturn channel is still being respected by price action. After a failed breakout attempt above the channel alongside the EMA5, we saw a rejection back toward the channels half line, a level we've identified as a potential support zone.
This support held, resulting in a bounce that aligns with our strategy of buying dips. As long as price continues to hold above this level and the EMA5 remains supportive, we could see a gradual move back toward higher levels. However, if the midline is retested and fails, and the EMA5 crosses below the half line, this could signal a potential move toward the lower boundary of the channel.
This is the beauty of our Goldturn channels, drawn using weighted averages instead of pure price action. This unique approach helps us clearly identify fake-outs and real breakouts, cutting out much of the noise that usually confuses traders.
Moving forward, we’ll focus on smaller timeframes (1H and 4H) to buy dips off the weighted Goldturns, aiming for clean 30–40 pip moves. Ranging markets are perfect for this style, allowing us to capitalize on quick moves without getting caught in the chop of larger swings.
Thank you all again for your continued likes, comments, and follows, we truly appreciate your support!
Mr Gold
GoldViewFX

GOLD 4H CHART ROUTE MAP UPDATE Hey Everyone,
Another productive session on the charts, with our strategy of buying dips delivering solid results once again.
This is a follow up on our 4-hour chart setup. The week began with our initial bearish targets being achieved, each confirmed by decisive candle body closures. Additionally, momentum conditions allowed for EMA5 lock confirmations at key levels, reinforcing the validity of the moves.
Today, price action tested the secondary swing range following a confirmed break and EMA5 lock below the primary swing zone. This led to a clean retracement and a reaction from the secondary swing range, with price covering the full range of the swing, a strong technical sign of structure respecting prior levels.
Looking ahead, we are closely monitoring for one of two scenarios:
1. Primary swing range completion – If price continues its upward momentum and completes the move back to the primary range, this could set the stage for a potential breakout.
2. Rejection at current zone – Should price fail to reclaim the primary swing range, we anticipate a retest of the lower Goldturn zones as support. A successful hold and bounce from this level would reinforce the broader range dynamics and offer renewed long opportunities.
We'll remain reactive to price structure and momentum alignment, especially in relation to key support/resistance levels.
Mr Gold
GOLDVIEWFX

GOLD WEEKLY CHART MID/LONG TERM ROUTE MAPHey Everyone,
Here’s the latest follow-up on our weekly chart setup and as anticipated, it’s playing out as analysed with the test into the top of our Goldturn Ascending Channel and rejection.
Price tested the upper boundary but failed to secure a sustained breakout. The EMA5 did not cross and lock outside the channel, signaling a lack of confirmation for bullish continuation. Instead, the top of the channel acted as a clean resistance zone, resulting in a firm rejection.
We are now seeing price pull back toward our identified support zones at 3281 and 3189, of which price can slowly align with the channel’s midline with either price finding support here, or we look for it to gradually sync up with the half-line of the channel for structural support.
As always, patience and precision are key. We'll continue using the 1H and 4H timeframes to buy dips on retracements into these support zones, targeting clean 30–40 pip moves. These levels and pullbacks offer ideal opportunities, especially in ranging conditions where our Goldturn method truly shines.
This is exactly why we rely on our Goldturn Channels, our proprietary system built on weighted averages. It filters the noise, helps us spot real breakouts vs. fake-outs, and gives us the confidence to act with clarity and discipline.
Thanks again for all the support, your likes, comments and follows.
MR GOLD
GOLDVIEWFX

Gold has recently broke through the call entry!Market Analysis Update: Gold Price Movement
Gold has recently broken through the Call Entry (CE) level of the 1-hour Fair Value Gap (FVG), indicating a possible continuation of upward momentum in the short term. Based on current price action and technical indicators, we are expecting gold to continue moving higher. This move may potentially target the liquidity resting above previous swing highs, as traders' stop losses in those areas are likely to be triggered, fueling the upward trend.
Once this liquidity is cleared, there is a notable resistance zone marked in the 3270–3274 range, commonly referred to as the "black zone." This area is likely to act as a key decision point. If price reaches this zone and exhibits signs of bearish confirmation (such as rejection candles, divergence, or other reversal signals), there may be a potential selling opportunity from that level.
Additionally, it is worth noting that there is a trendline drawn below the current market structure, which may also attract price action. This trendline represents another area where liquidity might be collected before any significant directional move occurs.
Thank you for your attention to this analysis. If there is anything in the explanation that you find unclear or if you have questions about specific terms or concepts, feel free to ask for clarification.

GOLD ROUTE MAP UPDATEHey Everyone,
After completing the bearish targets yesterday, confirmed by the EMA-5 cross and lock, we continued to buy dips. We noted that the swing range was active, but the full swing hadn't played out yet.
Today, that full swing completed, reaching 3254, marking a perfect move within the expected range.
Now, the price is likely to fluctuate between 3233/3201lower Goldturns and 3254 as the upper Goldturn.
We will keep the above in mind when taking buys from dips. Our updated levels and weighted levels will allow us to track the movement down and then catch bounces up.
We will continue to buy dips using our support levels taking 30 to 40 pips. As stated before each of our level structures give 20 to 40 pip bounces, which is enough for a nice entry and exit. If you back test the levels we shared every week for the past 24 months, you can see how effectively they were used to trade with or against short/mid term swings and trends.
The swing range give bigger bounces then our weighted levels that's the difference between weighted levels and swing ranges.
BULLISH TARGET
3341
EMA5 CROSS AND LOCK ABOVE 3341 WILL OPEN THE FOLLOWING BULLISH TARGETS
3372
EMA5 CROSS AND LOCK ABOVE 3372 WILL OPEN THE FOLLOWING BULLISH TARGET
3414
EMA5 CROSS AND LOCK ABOVE 3414 WILL OPEN THE FOLLOWING BULLISH TARGET
3447
EMA5 CROSS AND LOCK ABOVE 3447 WILL OPEN THE FOLLOWING BULLISH TARGETS
3478
EMA5 CROSS AND LOCK ABOVE 3478 WILL OPEN THE FOLLOWING BULLISH TARGETS
3502
POTENTIALLY 3525
BEARISH TARGETS
3307 - DONE
EMA5 CROSS AND LOCK BELOW 3307 WILL OPEN THE RETRACEMENT RANGE
3281 - DONE
3254 - DONE
EMA5 CROSS AND LOCK BELOW 3254 WILL OPEN THE SWING RNGE (SWING ACTION COMPLETE)
3233 - DONE
3201
As always, we will keep you all updated with regular updates throughout the week and how we manage the active ideas and setups. Thank you all for your likes, comments and follows, we really appreciate it!
Mr Gold
GoldViewFX

XAUUSD Analysis todayHello traders, this is a complete multiple timeframe analysis of this pair. We see could find significant trading opportunities as per analysis upon price action confirmation we may take this trade. Smash the like button if you find value in this analysis and drop a comment if you have any questions or let me know which pair to cover in my next analysis.

GOLD ROUTE MAP UPDATEHey Everyone,
Strong start to the week for our chart setup. Despite initial bearish momentum, price action aligned well with our dip buying strategy.
The session began with the bearish target at 3307 being achieved, triggering a key price reaction. This was followed by a ema5 cross and lock, confirming the activation of the retracement zone, which was also tested and respected with precision. We have now observed a confirmed breakout from the retracement range, opening the swing range. This move delivered our textbook swing bounce, again supporting our dip buying strategy.
The full extent of the swing range remains active, indicating continued opportunity for strategic dip entries while the range structure holds.
We will keep the above in mind when taking buys from dips. Our updated levels and weighted levels will allow us to track the movement down and then catch bounces up.
We will continue to buy dips using our support levels taking 30 to 40 pips. As stated before each of our level structures give 20 to 40 pip bounces, which is enough for a nice entry and exit. If you back test the levels we shared every week for the past 24 months, you can see how effectively they were used to trade with or against short/mid term swings and trends.
The swing range give bigger bounces then our weighted levels that's the difference between weighted levels and swing ranges.
BULLISH TARGET
3341
EMA5 CROSS AND LOCK ABOVE 3341 WILL OPEN THE FOLLOWING BULLISH TARGETS
3372
EMA5 CROSS AND LOCK ABOVE 3372 WILL OPEN THE FOLLOWING BULLISH TARGET
3414
EMA5 CROSS AND LOCK ABOVE 3414 WILL OPEN THE FOLLOWING BULLISH TARGET
3447
EMA5 CROSS AND LOCK ABOVE 3447 WILL OPEN THE FOLLOWING BULLISH TARGETS
3478
EMA5 CROSS AND LOCK ABOVE 3478 WILL OPEN THE FOLLOWING BULLISH TARGETS
3502
POTENTIALLY 3525
BEARISH TARGETS
3307 - DONE
EMA5 CROSS AND LOCK BELOW 3307 WILL OPEN THE RETRACEMENT RANGE
3281 - DONE
3254 - DONE
EMA5 CROSS AND LOCK BELOW 3254 WILL OPEN THE SWING RNGE
3233 - DONE
3201
As always, we will keep you all updated with regular updates throughout the week and how we manage the active ideas and setups. Thank you all for your likes, comments and follows, we really appreciate it!
Mr Gold
GoldViewFX

THE KOG REPORTTHE KOG REPORT:
Last week’s KOG Report didn’t really go the way we wanted! We got the move we wanted initially into the low, then the long upside, but the levels we wanted to short from again were smashed through. We managed to navigate and adapt to the move and after changing the plan on the FOMC KOG Report we ended again with an extremely decent week on Gold.
As we’ve always said, when markets don’t go our way, don’t hold on to hope. If you're in the wrong way, accept your wrong and change your bias, this will not only save your account but together with the right risk management, you’ll be able to come out of the market in positive for the week.
So, what can we expect from the week ahead?
We have some news over the weekend that can open us up with gaps, otherwise Monday should be a ranging day and we’ll see some action Tuesday onwards. For this week we’ve added the red boxes for everyone, the indicator is working like a dream and allowing our traders to scalp, swing trade and day trade across the 15min/1h/4h timeframes. So please take note of them!
The problem we have this week is the structure entails two possible moves by the way they’ve set this up. For that reason, we’ll look at the key levels on the red boxes for the break and close together with KOG’s red box targets and bias of the week, before we commit to the market other than scalping.
We have the key level below 3306-10 support which if held again can push upside this time in attempt to break through the 3330 level and target the 3350-55 and above that 3365 region before a RIP. 3360 is the level to watch, if broken above and supported, we can start again with longs into that 3400+ region, but only on confirmation.
The ideal scenario here for us is a break of this symmetrical pattern in one direction, then applying our trading strategy to it which will confirm the move, we can only do this once it’s broken and then update you with the plan.
For now, we’ll play the red boxes and of course wait for our trusted algo Excalibur to guide us. As always, we will update the wider community as we go through the week.
KOG’s bias of the week:
Bullish above 3310 with targets above 3335, 3345, 3350, 3350, 3362 and 3370
Bearish below 3310 with targets below 3306, 3301, 3297, 3285 and 3274
RED BOXES (TAKE NOTE)
Break above 3335 for 3342, 3350, 3354, 3365, 3370. 3373 and 3385 in extension of the move
Break below 3320 for 3310, 3306, 3298, 3293, 3285 and 3279 in extension of the move
Please do support us by hitting the like button, leaving a comment, and giving us a follow. We’ve been doing this for a long time now providing traders with in-depth free analysis on Gold, so your likes and comments are very much appreciated.
As always, trade safe.
KOG

GOLD 4H CHART ROUTE MAP UPDATE & TRADING PLAN FOR THE WEEKHey Everyone,
Please see our updated 4h chart levels and targets for the coming week.
We are seeing price play between two weighted levels with a gap above at 3344 and a gap below at 3297. We will need to see ema5 cross and lock on either weighted level to determine the next range. We have a bigger range in play then usual.
We will see levels tested side by side until one of the weighted levels break and lock to confirm direction for the next range.
We will keep the above in mind when taking buys from dips. Our updated levels and weighted levels will allow us to track the movement down and then catch bounces up.
We will continue to buy dips using our support levels taking 20 to 40 pips. As stated before each of our level structures give 20 to 40 pip bounces, which is enough for a nice entry and exit. If you back test the levels we shared every week for the past 24 months, you can see how effectively they were used to trade with or against short/mid term swings and trends.
The swing range give bigger bounces then our weighted levels that's the difference between weighted levels and swing ranges.
BULLISH TARGET
3344
EMA5 CROSS AND LOCK ABOVE 3344 WILL OPEN THE FOLLOWING BULLISH TARGET
3394
EMA5 CROSS AND LOCK ABOVE 3394 WILL OPEN THE FOLLOWING BULLISH TARGET
3438
EMA5 CROSS AND LOCK ABOVE 3438 WILL OPEN THE FOLLOWING BULLISH TARGET
3486
BEARISH TARGETS
3297
EMA5 CROSS AND LOCK BELOW 3297 WILL OPEN THE SWING RANGE
SWING RANGE
3236 - 3176
EMA5 CROSS AND LOCK BELOW 3176 WILL OPEN THE SECONDARY SWING RANGE
SWING RANGE
3088 - 3046
EMA5 CROSS AND LOCK BELOW 3046 WILL OPEN THE SECONDARY SWING RANGE
SECONDARY SWING RANGE
3130 - 3078
As always, we will keep you all updated with regular updates throughout the week and how we manage the active ideas and setups. Thank you all for your likes, comments and follows, we really appreciate it!
Mr Gold
GoldViewFX

GOLD 1H CHART ROUTE MAP & TRADING PLAN FOR THE WEEKHey Everyone,
Please see our updated 1h chart levels and targets for the coming week.
We are seeing price play between two weighted levels with a gap above at 3341 and a gap below at 3307. We will need to see ema5 cross and lock on either weighted level to determine the next range.
We will see levels tested side by side until one of the weighted levels break and lock to confirm direction for the next range.
We will keep the above in mind when taking buys from dips. Our updated levels and weighted levels will allow us to track the movement down and then catch bounces up.
We will continue to buy dips using our support levels taking 30 to 40 pips. As stated before each of our level structures give 20 to 40 pip bounces, which is enough for a nice entry and exit. If you back test the levels we shared every week for the past 24 months, you can see how effectively they were used to trade with or against short/mid term swings and trends.
The swing range give bigger bounces then our weighted levels that's the difference between weighted levels and swing ranges.
BULLISH TARGET
3341
EMA5 CROSS AND LOCK ABOVE 3341 WILL OPEN THE FOLLOWING BULLISH TARGETS
3372
EMA5 CROSS AND LOCK ABOVE 3372 WILL OPEN THE FOLLOWING BULLISH TARGET
3414
EMA5 CROSS AND LOCK ABOVE 3414 WILL OPEN THE FOLLOWING BULLISH TARGET
3447
EMA5 CROSS AND LOCK ABOVE 3447 WILL OPEN THE FOLLOWING BULLISH TARGETS
3478
EMA5 CROSS AND LOCK ABOVE 3478 WILL OPEN THE FOLLOWING BULLISH TARGETS
3502
BEARISH TARGETS
3307
EMA5 CROSS AND LOCK BELOW 3307 WILL OPEN THE RETRACEMENT RANGE
3281
3254
EMA5 CROSS AND LOCK BELOW 3254 WILL OPEN THE SWING RNGE
3233
3201
As always, we will keep you all updated with regular updates throughout the week and how we manage the active ideas and setups. Thank you all for your likes, comments and follows, we really appreciate it!
Mr Gold
GoldViewFX

GOLD DAILY CHART ROUTE MAP UPDATEHey Everyone,
After completing our previous daily chart idea, we’ve now updated and identified a new Goldturn ascending channel on this updated chart.
Price had temporarily broken above the upper boundary of the channel; however, the EMA5 remains within the channel, indicating that this may be a false breakout rather than a confirmed move higher.
The 3433 resistance level was tested, aligning with our prior axis target. While price did reach this level, it failed to close above it, resulting in only a wick rejection. For a confirmed bullish continuation, we need to see a clear candle close above 3433, accompanied by the EMA5 crossing and holding above the channel boundary.
Further confirmation would come from a successful retest and hold above the channel, establishing new support at higher levels.
At present, 3433 remains key resistance, while 3272 acts as support. In the short term, we may observe sideways consolidation, with price potentially gravitating toward the midline of the ascending channel half line, which could act as dynamic swing support.
This is the beauty of our Goldturn channels, drawn using weighted averages instead of pure price action. This unique approach helps us clearly identify fake-outs and real breakouts, cutting out much of the noise that usually confuses traders.
Moving forward, we’ll focus on smaller timeframes (1H and 4H) to buy dips off the weighted Goldturns, aiming for clean 30–40 pip moves. Ranging markets are perfect for this style, allowing us to capitalize on quick moves without getting caught in the chop of larger swings.
Thank you all again for your continued likes, comments, and follows, we truly appreciate your support!
Mr Gold
GoldViewFX

GOLD WEEKLY CHART MID/LONG TERM ROUTE MAPHey Everyone,
Here’s the latest update on our weekly chart setup, which has continued to play out in line with our previous projections.
Recently, price broke above the upper boundary of our Goldturn Ascending Channel a proprietary channelling method designed for greater precision and reduced noise. However, the EMA5 remains within the channel, suggesting the breakout lacks confirmation. For a true continuation to the upside, we’ll need to see the EMA5 close and hold above the channel boundary, which would validate a structural shift in trend strength.
At the moment, price is hovering above the channel, showing signs of support and minor bullish bounces. However, until the EMA5 exits and stabilizes outside the channel, we treat this move with caution.
Price is currently testing the upper channel resistance, a critical decision point on the weekly timeframe. The 3482 level remains key resistance, having previously been rejected via upper wick with no candle body close above. On the downside, 3281 and 3189 are the primary support levels to monitor, both of which align with the channel's midline, a potential zone for consolidation or swing support if price moves sideways and gradually ascends.
In summary, while early bullish momentum is visible, full confirmation of trend continuation requires alignment between price action and the EMA5 behaviour relative to the channel structure.
This is the beauty of our Goldturn channels, drawn using weighted averages instead of pure price action. This unique approach helps us clearly identify fake-outs and real breakouts, cutting out much of the noise that usually confuses traders.
Moving forward, we’ll focus on smaller timeframes (1H and 4H) to buy dips off the weighted Goldturns, aiming for clean 30–40 pip moves. Ranging markets are perfect for this style, allowing us to capitalize on quick moves without getting caught in the chop of larger swings.
Thanks again for all your likes, comments, and follows, we really appreciate the support!
Mr Gold
GoldViewFX

GOLD ROUTE MAP UPDATEHey Everyone,
Great finish to the week with our chart idea playing out, as analysed.
After completing our Bullish targets 3282, 3343 and 3404 yesterday; we stated that no further cross and lock above 3404 confirmed the rejection and that price will find support at lower Goldturns for the bounces.
- This played out perfectly inline with our plans to buy dips. Price found support at 3282 Goldturn and gave the weighted bounce just like we analysed.
BULLISH TARGET
3282 - DONE
EMA5 CROSS AND LOCK ABOVE 3282 WILL OPEN THE FOLLOWING BULLISH TARGET
3343 - DONE
EMA5 CROSS AND LOCK ABOVE 3343 WILL OPEN THE FOLLOWING BULLISH TARGET
3404 - DONE
We will now come back Sunday with our updated Multi time-frame analysis, Gold route map and trading plans for the week ahead.
Have a smashing weekend!! And once again, thank you all for your likes, comments and follows, we really appreciate it!
Mr Gold
GoldViewFX

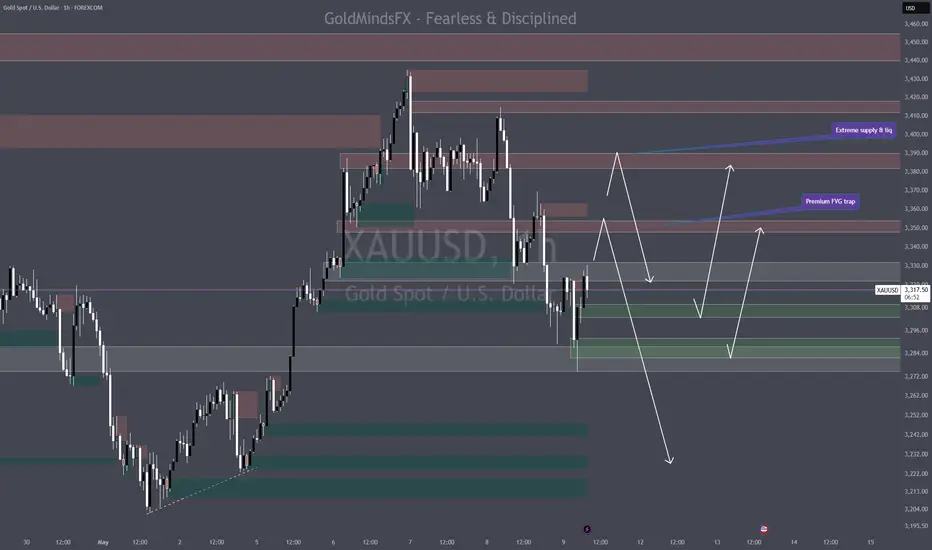
Gold Daily Sniper Plan - XAUUSD May 9🔹 XAUUSD – Daily Sniper Plan | May 9, 2025
🎯 Precision Mode: Activated. No recycled zones. Only real-time flow.
🧠 Macro Context:
• Market digested FOMC + Powell ✅
• Price dipped into 3284 sniper zone (✅ Reaction Confirmed)
• Asia printed fresh CHoCH from discount → Now retesting
• Bias: HTF bullish — LTF shift confirmed after deep mitigation
• Today = Thursday → Keep eyes on volume traps before NY
🔍 Structure Summary:
• D1–H4: Bullish trend intact, reaction from strong OB near 3284
• H1–M15: Internal BOS + CHoCH + FVGs filled, clean transition
• Major HL defended. New short-term HH printed → demand forming below.
🔻 SELL SETUPS (only from premium)
1. Sell Setup 1 – Premium FVG Trap
📍 Zone: 3348–3354
🎯 Confluence: M15 imbalance + weak high + LTF CHoCH area
🛑 SL: 3362
TP1: 3335
TP2: 3318
TP3: 3304
2. Sell Setup 2 – Extreme Supply + Liquidity
📍 Zone: 3382–3390
🎯 Confluence: Unmitigated M30 OB + Equal highs + HTF inefficiency
🛑 SL: 3401
TP1: 3360
TP2: 3335
TP3: 3310
🟢 BUY SETUPS (only after confirmation)
1. Buy Setup 1 – CHoCH Retest + OB
📍 Zone: 3303-3310
🎯 Confluence: M15 OB + previous CHoCH + demand reaction
🛑 SL: 3292
TP1: 3324
TP2: 3340
TP3: 3354
2. Buy Setup 2 – Deep Discount Sniper Zone
📍 Zone: 3284–3292
🎯 Confluence: H4 OB + FVG + 61.8% FIB retracement
🛑 SL: 3268
TP1: 3310
TP2: 3333
TP3: 3350
Bias Today: HTF bullish | LTF flipped bullish after Asian CHoCH
Scalps and reentries only from refined zones. No countertrend unless clear CHoCH/weak high is grabbed.
💬 Note:
Don’t buy or sell from the middle of nowhere. Wait for price to deliver to the zones. If price flies without you? That’s not your train. You’re waiting at your sniper station.
👇 Like the plan?
Drop a 🚀 Follow, comment, and share with your trading crew — let’s build the sharpest Gold team on TradingView
📌 Important Notice!!!
The above analysis is for educational purposes only and does not constitute financial advice. Always compare with your plan and wait for confirmation before taking action.
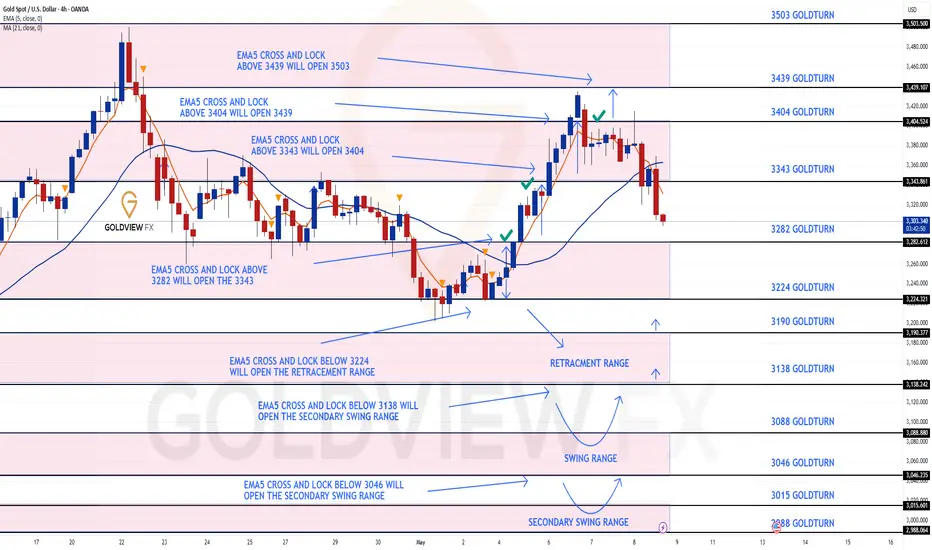
GOLD 4H CHART ROUTE MAP UPDATEHey Everyone,
Once again another smashing day on the charts today. After sharing updates and completing targets on our 1h chart idea; please now see update on our 4H chart idea, which is also playing out as analysed.
We started with our Bullish target hit at 3282, followed with ema5 cross and lock opening 3343, which was hit perfectly. We then got ema5 cross and lock above 3342 opening 3404, also got completed. The cross and lock confirmation gave plenty of time to get in for the action.
No further cross and lock with ema5 above 3404 confirmed the perfect rejection, which we are seeing now, with price testing the lower Goldturns for support.
We will continue to buy dips using our support levels taking 30 to 40 pips. As stated before each of our level structures give 20 to 40 pip bounces, which is enough for a nice entry and exit. If you back test the levels we shared every week for the past 24 months, you can see how effectively they were used to trade with or against short/mid term swings and trends.
The swing range give bigger bounces then our weighted levels that's the difference between weighted levels and swing ranges.
BULLISH TARGET
3282 - DONE
EMA5 CROSS AND LOCK ABOVE 3282 WILL OPEN THE FOLLOWING BULLISH TARGET
3343 - DONE
EMA5 CROSS AND LOCK ABOVE 3343 WILL OPEN THE FOLLOWING BULLISH TARGET
3404 - DONE
EMA5 CROSS AND LOCK ABOVE 3404 WILL OPEN THE FOLLOWING BULLISH TARGET
3439
EMA5 CROSS AND LOCK ABOVE 3439 WILL OPEN THE FOLLOWING BULLISH TARGET
3503
BEARISH TARGETS
3224
EMA5 CROSS AND LOCK BELOW 3224 WILL OPEN THE FOLLOWING RETRACEMENT RANGE
3190
3138
EMA5 CROSS AND LOCK BELOW 3138 WILL OPEN THE SWING RANGE
SWING RANGE
3088 - 3046
EMA5 CROSS AND LOCK BELOW 3046 WILL OPEN THE SECONDARY SWING RANGE
SECONDARY SWING RANGE
3015 - 2988
As always, we will keep you all updated with regular updates throughout the week and how we manage the active ideas and setups. Thank you all for your likes, comments and follows, we really appreciate it!
Mr Gold
GoldViewFX
THE KOG REPORT - FOMCTHE KOG REPORT – FOMC
This is our view for FOMC, please do your own research and analysis to make an informed decision on the markets. It is not recommended you try to trade the event if you have less than 6 months trading experience and have a trusted risk strategy in place. The markets are extremely volatile, and these events can cause aggressive swings in price.
Our NFP KOG Report worked pretty well apart from it being a Friday and us closing out positions for the weekend only for the move to complete on Monday. For this FOMC we’ll share the levels and potential reaction points on the red boxes as well as the red box target levels. Due to the range, it’s best to wait for the break and also for them to move the price to where they want, then hunt the trade once price has settled.
We have the immediate support level below 3360-55 which if held can push this upside to break the recent high and that 3480-90 level again. Break of that level we have red box region 3330-20 which is where we could get a RIP but that will give us the flip with potential for the order region 3350-55 to turn into resistance unless broken. For that reason, a down move for now could only give scalps for decent captures on tap and bounces.
3320 is the line in the sand, if broken below we’ll get the long from the 3290-95 region which will come next week.
Note, these days it’s only Trump that manages to move the markets aggressively, so this FOMC is most likely already priced in. Not worth attempting the immediate levels so we’ll rather wait for the extreme levels.
RED BOXES INDI LEVELS:
Break above 3395 for 3406, 3410, 3420, 3430 and 3435 in extension of the move
Break below 3375 for 3370, 3366, 3356, 3351 and 3345 in extension of the move
Please do support us by hitting the like button, leaving a comment, and giving us a follow. We’ve been doing this for a long time now providing traders with in-depth free analysis on Gold, so your likes and comments are very much appreciated.
As always, trade safe.
KOG
