10.17 Gold Short-Term Operation Technical Guide!!!Recently, as the expectation of the Federal Reserve's interest rate cut has become more and more intense, and there is an expectation of an increase, the loose atmosphere, coupled with the expectation of inflation and the impact of the economic and trade turmoil, gold has once again become the darling of the market. Every day, it witnesses new highs in history, and the trend has become more and more crazy. There is no top in sight, and it is also impossible to say when a dive will come. Today, the Asian session hit a high near 4378 and then fell back quickly to touch around 4278, a range of US$100, and then quickly rebounded to above 4370 again. Subsequently, the European session jumped back and forth. Today, Friday, we need to be wary of the possible profit-taking trend in the market. In terms of operation, the rebound depends on shorting at 4360/70, and pay attention to the gains and losses of 4300. If it falls below 4300, we will see adjustments. Otherwise, we will continue to see bullish fluctuations if it falls back.
Goldtradingstrategy
Trap Alert: Gold’s Pullback Could Fuel the Next Bounce!Gold continues to retreat in the short term, currently testing the strength of support at 4300. From the current technical perspective, although gold has repeatedly come under pressure at the 4370-4380 area, forming a multiple top structure in the short term, limiting upside potential in the short term, as gold continues to decline, the current resistance area has shifted down to 4235-4245.
Although gold is retreating under pressure, the overall bullish trend remains strong until it breaks below this key area. The current support structure after the top-bottom conversion lies in the 4290-4280 area. If gold cannot fall below this area during the pullback, then gold still has the potential to rebound to the 4230-4240 area. Therefore, even if we see gold prices continue to retreat, we should not rush to short gold during this pullback.
Instead, consider short-term trading:
We can continue to try to go long on gold with the 4290-4280 area as support. Of course, for short-term trading, the rebound target can be aimed at the 4320-4330 area!

GOLD Awaiting Sell Reaction at Peak & Buy Pullback Support🔍 Market Context
After a series of strong Break of Structure (BoS) , gold has reached a new ATH at 4,385 USD – marking a sustainable uptrend over the past 3 sessions.
However, this peak area is currently acting as a significant psychological and technical barrier . Buying momentum is temporarily slowing as the price reacts to the Liquidity Zone around 4,351 – 4,385 USD .
The market is in a phase of liquidity rebalancing .
The major trend remains upward, but the current price area may see a short-term correction before further wave expansion.
💎 Technical Analysis
ATH GOLD: 4,385 USD
Sell Liquidity Zone: 4,430 – 4,435 USD → high liquidity resistance zone, potential for short-term sell reactions.
Liquidity Zone $$$: 4,284 – 4,282 USD → nearby support zone, confluence with trendline.
Order Block | Fibonacci Zone: 4,226 – 4,230 USD → deep discount zone confluencing with Fibo 0.618, high reversal potential.
Overall Structure: remains bullish , but showing short-term signs of weakness as the price fails to hold above 4,360.
📈 Trading Scenarios
1️⃣ SELL Setup – Rejection at peak area 4,385 – 4,433 USD
Entry: 4,430 - 4,435
SL: 4,440
TP: 4,425 → 4,420 →4,415→4,410→4405
✅ Condition: Appearance of rejection or strong bearish engulfing candles at high Liquidity zone.
➡️ This is a liquidity reaction setup – sell when the price sweeps the peak and clear sell signals from major players appear.
2️⃣ BUY Setup #1 – Pullback at 4,284 – 4,282 USD
Entry: 4,284 – 4,282
SL: 4,272
TP: 4,290 → 4,300 → 4,310/Open
✅ Condition: Strong H1 candle reaction at support or minor reversal structure.
➡️ Buy with the main trend, taking advantage of a slight pullback around the support Liquidity zone.
3️⃣ BUY Setup #2 – OB Deep Zone 4,226 – 4,230 USD
Entry: 4,226 – 4,230
SL: 4,190
TP: 4,235 → 4,240 → 4,250/Open
✅ Condition: Appearance of bullish BoS or confirming bullish engulfing candle.
➡️ This is a deep discount zone, suitable for swing orders following the main trend.
⚠️ Risk Management
Avoid FOMO buying at high zones (4,360+).
Prioritize observing price behavior at 4,284 and 4,226 before entering orders.
Sell orders at 4,385–4,430 are only triggered if there is a clear confirmation signal.
Maintain moderate volume, avoid averaging down without confirmation.
💬 Conclusion
Gold is accumulating after reaching the peak of 4,385 USD , this is a crucial phase to determine the correction before the new upward wave.
The most effective strategy now is sell reaction at the high peak area 4,385 – 4,430 and buy with the trend at 4,284 – 4,226 USD when confirmation appears.
👉 Reasonable Strategy:
Sell Reaction: 4,385 – 4,430 → TP 4,284 – 4,226
Buy Pullback: 4,284 – 4,282
Buy OB Deep: 4,226 – 4,230

Relentless Rally:Gold Won’t Rest Until 4500!?The 4300 series chapter has begun as expected, with gold continuing its strong upward trend, currently reaching a high near 4381. However, it is clear that after encountering resistance in the 4370-4380 area three times, gold has shown clear signs of a pullback. This could lead to the formation of a triple top structure in the short term, suppressing gold prices in the short term.
However, relatively speaking, as gold continues to rise, testing the 4280 area during the pullback before rebounding again, technical support has shifted to the 4320-4310 area. Furthermore, the validation of the pullback and the current strong upward trend will strengthen the support in this area to a certain extent, thus supporting gold's rebound.
Therefore, for the current short-term trade:
1. First, try to continue shorting gold with resistance at 4370-4380, targeting a pullback to the 4350-4340 area.
2. Once gold retraces to the 4320-4310 area, consider going long on gold, targeting the 4340-4350 area.

10.17 Gold bulls rose sharply and are about to enter the 4400 erLooking at the 4-hour market trend, the short-term support at 4290-4300 is currently under consideration, with a focus on 4270. The bulls are rising strongly and there is no end in sight. Trading strategies should focus on buying on pullbacks. For intermediate positions, be cautious in following orders and patiently wait for key entry points. I will provide detailed trading strategies during the trading session, so please pay attention.

Gold Retests All-Time Highs – Bulls Still in Full Control📊 Market Overview
Gold experienced a sharp intraday drop during the Asian session, testing the 4,280 – 4,279 USD zone before quickly recovering. Despite short-term volatility, it continues to close the week in green for the ninth consecutive time — confirming the strength of the ongoing bullish cycle.
The broader fundamentals remain supportive:
💥 Persistent geopolitical tensions keep safe-haven demand high.
⚖️ US–China trade uncertainty and the risk of a prolonged US government shutdown weaken risk appetite.
💵 Fed rate-cut expectations and USD softness continue to favor gold upside.
In short — Smart Money remains positioned long, and every dip still looks like a liquidity grab for re-accumulation.
🧠 Technical Structure (MMFLOW View)
On the M30 timeframe, gold continues to respect an ascending channel, currently forming a liquidity trap and breakout setup around 4,280 – 4,330.
Price action suggests gold may be completing a short-term corrective wave (B) before resuming the larger bullish impulse.
The structure remains technically bullish, with all pullbacks showing strong rejections from demand zones.
🔑 Key Levels to Watch
🟢 BUY ZONE (Primary Setup)
Zone: 4,230 – 4,228
SL: 4,220
TP: 4,240 – 4,250 – 4,260 – 4,270 – ???
🔵 CP ZONE BUY (Secondary Support)
Zone: 4,284 – 4,285
SL: 4,275
TP: 4,300 – 4,315 – 4,330 – 4,340 – ???
🔴 SCALP SELL (Liquidity Reaction Zone)
Zone: 4,438 – 4,440
SL: 4,448
TP: 4,420 – 4,410 – 4,390 – ???
⚙️ MMFLOW Scenarios
1️⃣ Primary Bullish Scenario:
If gold holds above 4,280 – 4,284, expect continuation toward 4,380 – 4,438 (Liquidity Sell Zone).
The 4,284 level is the key control point where Smart Money may look to re-enter long positions.
2️⃣ Alternative Correction Scenario:
A clean break below 4,280 could drive price toward 4,249 – 4,243 (CP Buy Zone) before another bullish push higher.
This structure still aligns with a Healthy Correction Pattern within a broader uptrend.
⚡ MMFLOW Insights
Gold remains in a mid-term expansion phase, with both macro and technical alignment favoring continued upside.
The 4,280 – 4,330 range acts as a Smart Money accumulation zone, preparing for a liquidity sweep higher.
Medium-term upside target: 4,438 – 4,445 USD/oz (Liquidity Sell Zone).
⚠️ Trading Notes
✅ Always use a protective Stop Loss — volatility can spike during liquidity hunts.
✅ Avoid chasing entries at highs; wait for reaction around BUY ZONES.
✅ Focus on liquidity confluence zones (Fibo + CP Zone + Order Block) for the highest-probability setups.
🧭 Quick Summary
Gold remains resilient despite early-session volatility.
Watch BUY ZONES at 4,230 – 4,228 and 4,284 – 4,285 for possible long re-entries.
Short-term target: 4,380 – 4,438 USD/oz.
Bias: Bullish – Buy the dips, not the breakouts.

Farewell to 4200 — The 4300 Era Begins!Gold has currently reached a high near 4295, just shy of 4300. Given the current upward momentum, it's easy for gold to continue its upward trend and test 4300. Because gold continues to hit new highs and break through the trend channel, there's currently no clear resistance zone above it, making it difficult to enter a short position in gold. Furthermore, a break above 4300 could significantly ignite bullish market sentiment and increase expectations for continued gold gains, pushing the price higher.
Therefore, we're primarily focusing on relatively significant support areas below. As gold's center of gravity continues to shift upward, its lows are gradually rising. Short-term support is concentrated in the 4265-4255 area, while further strong support lies in the 4240-4230 area. These two areas will be the long entry areas that we will focus on next.
Therefore, in short-term trading:
1. If gold first retreats to the 4265-4255 area, we can consider starting a long position in gold.
2. If gold continues to retreat to the 4240-4230 area, we can consider increasing our long position in gold.
3. If you still want to try to profit from the pullback, you can consider shorting gold in the 4298-4308 area. You must set a protection level (SL: 4300-4310) for counter-trend trading.
If you’re following this rally, don’t just watch — prepare your next move.
💬 Like & Follow for real-time updates and in-depth gold insights.
📈 Follow me for real-time gold insights &to my traders' channel for exclusive setups in bio!

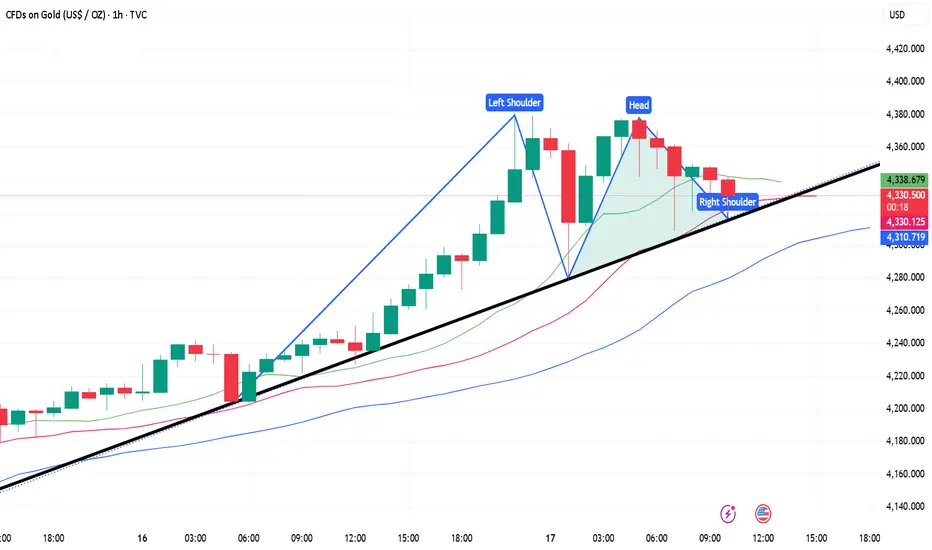
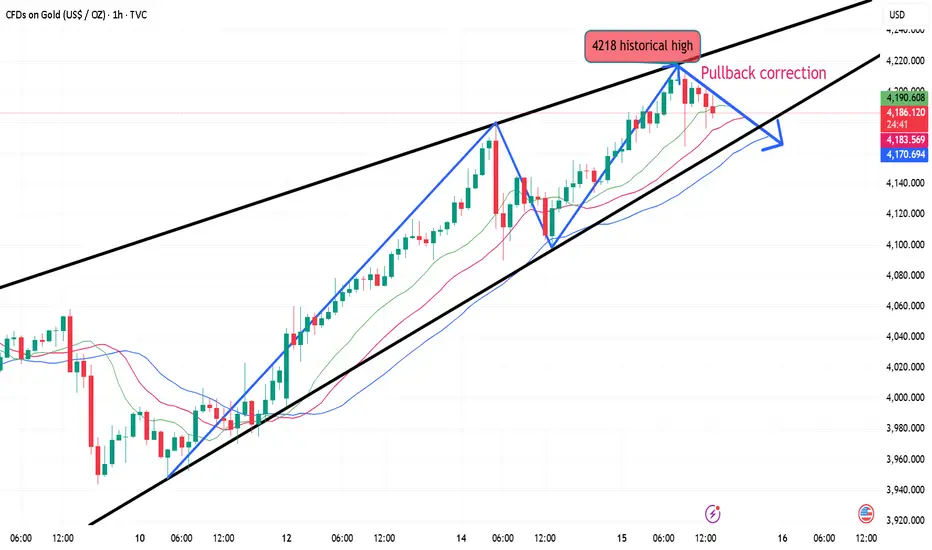
The Golden Triangle is coming to an end, beware of profit takingGold Hourly Chart: The overnight close was relatively high, and today's Asian session continued its upward trend. The European session saw a sharp drop below the upper channel line at 4242. This trend resistance line is the same one that held pressure at 4218 in yesterday's European session. The market then closed with a large, plump, bearish candlestick pattern at 2:00 PM, reaching the target of 4210. Since it was a large bearish candlestick pattern, not a long lower shadow candlestick pattern, a rebound confirming the 5-day moving average at 4230-34 is sufficient, so a further downward push is warranted.
The European session saw consecutive positive days, testing the bottom and rallying to a new all-time high. However, caution is advised in the US session. On the one hand, the 4250 level is a resistance point in the channel, and on the other hand, it is nearing the end of an ascending converging triangle, leaving little room for further movement and a potential reversal. Therefore, support remains at the middle line at 4230. Only a significant break below this level would trigger a potential for a significant short-term correction. Resistance is at 4265. Be cautious about blindly chasing rallies below this level. Consider the gains and losses at both levels and wait for signals.
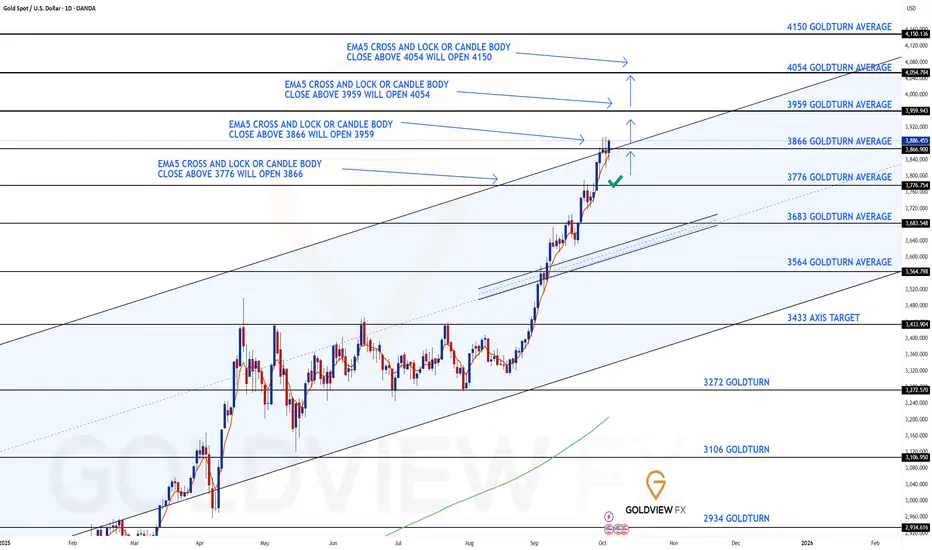
GOLD DAILY CHART ROUTE MAP UPDATEDaily Chart Update – Goldturn Channel Analysis
Hey Traders,
After successfully completing our previous Daily chart projection, we’re excited to share our latest Goldturn Channel update and Daily chart idea, our proprietary method of identifying structural turning points within Golds ascending channel formation.
Price action has now reached the upper boundary of the Goldturn channel, following a precise move to the 3866 target, triggered by the body close above 3776. With a new body close above 3866, we now have the 3959 gap open.
The 3866 channel top area remains a critical inflection point:
A confirmed EMA5 cross and lock above the channel top would strengthen the bullish breakout structure.
Conversely, an EMA5 rejection or close back below this level may indicate a fake out or short-term exhaustion.
On the downside, 3766 now acts as the nearest dynamic support, while 3683 aligns with the channel midline and remains a key structural pivot should deeper correction unfold.
As always, we will keep you all updated with regular updates throughout the week and how we manage the active ideas and setups. Thank you all for your likes, comments and follows, we really appreciate it!
Mr Gold
GoldViewFX
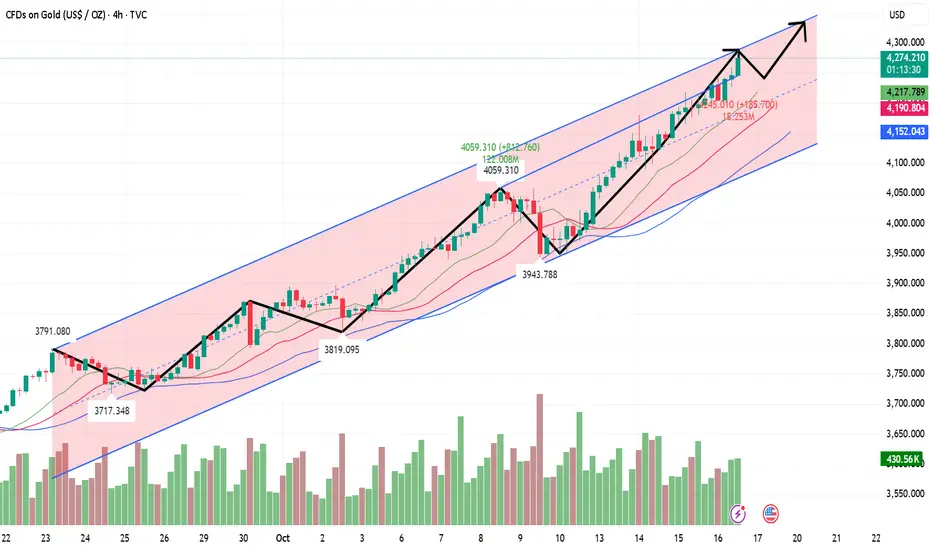
Mission Complete: 4245-4250:Time to Flip Short on Gold!Gold has already reached a high of around 4246, and its upward momentum has relatively weakened. To be honest, under the current market conditions, I do not advocate aggressively chasing gold above 4240, because as gold continues to rise, more and more callback risks are accumulated! We can also see that each surge in gold is followed by a clear pullback. So even if we choose to short gold, we can still get a good profit margin in the short term!
Although gold is on an overall upward trend, I still divide the rising channel into three areas; the first area: 4250-4220; the second area: 4220-4190, and the third area: 4190-4160. As gold rises, the technical traction of the lower area on the gold price becomes stronger. Therefore, according to the first area division, in the short term, gold has the need to at least retreat to the area near 4220. Even after falling below the area near 4220, it may continue the downward trend to the 4220-4190 area.
Therefore, in terms of short-term trading, I would prioritize trying to short gold in the 4245-4255 area, first targeting the short-term retracement area: 4230-4220 as the target.
If you’re following my trading strategy, don’t just watch — prepare your next move.
💬 Like & Follow for real-time updates and in-depth gold insights.
📈 Follow me for real-time gold insights &to my traders' channel for exclusive setups in bio!

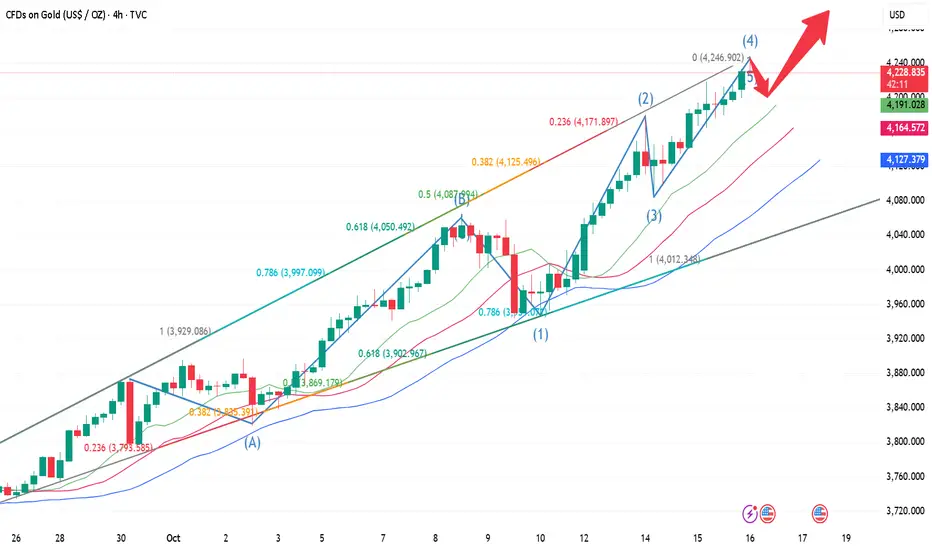
The Charge Sounds Again — Marching Toward 4240–4250!Currently, gold has once again hit a new high in a volatile upward manner and touched around 4228. Although the bullish momentum has slowed down compared with before, it still has enough strength to control the situation and dominate. Coupled with the support of multiple safe-haven factors, the market bulls can still continue to move upward after a brief rest!
It can be clearly seen from the current technical form and structure that gold has rebounded again after retreating to the area near 4180 several times. There are many obvious lower shadows in the candle chart. It can be seen that gold has built a new rising relay platform near 4180 in the short term. Gold may use this as a springboard to continue to rise and launch a charge towards the 4240-4250 area in the short term!
According to the trend structure, as the center of gravity of gold continues to move up, the support area has moved up to the 4215-4205 area in the short term. If gold cannot fall below this area during the retracement, gold may continue to rise with this as support. Then, the first thing we need to pay attention to is the 4240-4250 area.
So, for short-term trading:
1. If gold first retreats to the 4215-4205 area, we can consider going long on gold in small quantities. Since the entry level is relatively high, it's important to set up protection measures during the trade.
2. If gold continues to rise to the 4240-4250 area, if gold first touches this area, we can consider going short on gold in small quantities. Since this is a counter-trend trade, it's also important to set up protection measures during the trade.

Gold Pulls Back From All-Time High – Correction Looks Limited📊 Market Overview
Gold slightly corrected from its all-time high near $4,239, showing early signs of a short-term pullback, but the overall trend remains bullish.
Despite the correction, fundamental sentiment still supports Gold:
💬 US–China trade tensions and geopolitical risks continue to fuel demand for safe-haven assets.
💵 The US Dollar remains under pressure amid expectations of a Federal Reserve rate cut later this year.
⚖️ Ongoing concerns about a possible US government shutdown further enhance Gold’s attractiveness.
These factors suggest that the current dip is likely a healthy correction within a strong uptrend, not a reversal.
🧠 Technical Structure (MMFLOW Wave View)
Gold has likely completed a minor Wave (V) on the M30 chart, forming a new ATH Zone near 4,239.
Currently, price is unfolding a corrective A–B–C pattern, expected to find support at key liquidity zones before resuming the uptrend.
Our model highlights two potential BUY setups and a short-term SELL scalp opportunity for today’s trading session.
🔑 Key Levels to Watch
🔵 BUY Setup 1
Zone: 4,184 – 4,182
SL: 4,178
TP: 4,188 – 4,192 – 4,196 – 4,200 – 4,210 – 4,220 – ???
🟢 BUY Setup 2 (Deeper Retrace)
Zone: 4,148 – 4,146
SL: 4,140
TP: 4,152 – 4,156 – 4,160 – 4,170 – 4,180 – 4,190 – 4,200
🔴 SELL SCALP Opportunity
Zone: 4,230 – 4,234
SL: 4,238
TP: 4,220 – 4,215 – 4,210 – 4,200 – 4,190 – ???
⚙️ MMFLOW Trading View
📈 Price is currently respecting Wave (A) of the correction.
We expect a possible (B) retracement toward 4,220 – 4,230, followed by (C) decline completing near 4,147 – 4,150 (Fibo 0.618 / CP Buy Zone).
From there, Smart Money may re-enter long positions targeting a fresh liquidity sweep toward the 4,285 SELL ZONE.
In short:
The uptrend remains intact, only a short-term correction is unfolding.
Patience is key — best opportunities will likely appear around 4,150 – 4,180 range.
The structure aligns perfectly with both technical confluence (Elliott + Liquidity Zones) and macro sentiment.
If the market holds above 4,140, Gold could aim for new highs toward 4,285 – 4,300 in the next few sessions.
However, traders should:
✅ Always use Stop Loss — volatility is high near record highs.
✅ Avoid overtrading in narrow pullback zones.
✅ Focus on reaction at key liquidity levels before entering.
⚡ Summary
Gold remains technically bullish with limited downside correction.
Watch for price reaction around 4,184 and 4,147 — both zones represent strong liquidity areas where Smart Money may look to buy again.
After completing this correction, a new impulsive leg up toward 4,285+ could unfold, potentially marking the next all-time high.

XAUUSD – Safe-Haven Flows Continue to Support GoldMarket Context:
Gold has attracted strong buying for the fourth consecutive session, supported by a mix of global risk factors: renewed US–China trade tensions, rising geopolitical uncertainty, and growing fears of a prolonged US government shutdown.
Meanwhile, dovish expectations from the Federal Reserve are keeping the USD under pressure — further enhancing the appeal of gold as a non-yielding safe-haven asset.
During the Asian session, XAU/USD printed a fresh all-time high, with bulls now eyeing a potential extension toward the 4,200 USD/oz region amid escalating global concerns.
Technical Outlook (M30):
Gold continues to respect its ascending channel structure, maintaining dynamic support between 4,167 – 4,154.
As long as price holds above 4,139, the broader trend remains bullish, with the next liquidity target sitting at 4,240 – 4,241.
Key Zones to Watch:
Liquidity Sell Zone: 4,240 – 4,242
ATH Zone / Short-Term Resistance: 4,190 – 4,200
OBS Buy Zone – CP Trendline Support: 4,141 – 4,139
Secondary Buy Zone: 4,114 – 4,112
Trading Plan:
🔹 BUY Zone
Entry: 4.141 – 4.139
SL: 4.134
TP: 4.145 → 4.150 → 4.155 → 4.160 → 4.170 → 4.180
🔹 BUY Zone
Entry: 4.114 – 4.112
SL: 4.106
TP: 4.120 → 4.125 → 4.130 → 4.140 → 4.150
🔹 SELL Zone (Scalp Reaction)
Entry: 4.240 – 4.242
SL: 4.248
TP: 4.235 → 4.230 → 4.225 → 4.220 → 4.210 → 4.200
Summary:
The bullish market structure remains intact as long as price holds above the 4,139 zone.
Watch for potential long opportunities from 4,141 – 4,139, where the confluence of trendline and order block support could trigger fresh demand.
Bulls remain in control, targeting the 4,240 – 4,241 liquidity area in the coming sessions.
📊 What’s your take — will gold break above 4,200 or pause for a correction first?
👉 Follow MMFLOW TRADING for daily market structure insights and institutional-style setups.
🟣 Chart: XAUUSD M30 – Smart Money Flow structure highlighting liquidity pools, CP confluence and key buy/sell zones.

10.16 Gold maintains the upward trend in the Asian session!!!From a multi-period analysis perspective, first observe the monthly chart's rhythm. From a long-term perspective, 3130 represents a watershed in the long-term trend. Above this level, consider a long-term bullish approach. From a weekly perspective, the current bull-bear watershed is 3585. Above this level, consider a medium-term bullish approach. From a daily perspective, focus on the 3997 support area for now. Above this level, consider a short-term bullish approach. From a four-hour perspective, which we've consistently emphasized, support currently lies at 4175. Above this level, consider a short-term bullish approach. On an hourly basis, prices are also currently bullish, but short-term divergence is occurring. Therefore, be mindful of short-term bullish risks in the event of further upward movement. Meanwhile, today's early trading session saw another surge in gains, with the early morning low serving as a watershed for the day. Above this level, consider a short-term bullish approach. Focus on the 4235-4266 area as an upward move.
Gold's Asian session low of 4199.73 marks the intraday watershed. Above this level, bullish momentum is expected to continue. (Also, a divergence is occurring in the hourly chart, so be aware of the risks associated with a short-term rally.)
XAU/USD – Buyers Reclaim Structure, Targeting Liquidity Zone🔍 Market Context
After a strong Liquidity Sweep yesterday, gold has rebounded and formed consecutive Break of Structure (BoS) , confirming buyers are back in control.
The price has now filled the Fair Value Gap (FVG 4,191 – 4,202) and is heading towards the Sell Liquidity Zone 4,237 – 4,240 USD — where many sell orders and stop-losses from previous short positions are concentrated.
The current structure indicates strong upward momentum , however, the possibility of a pullback from this high liquidity area is noteworthy.
💎 Technical Analysis
Liquidity Sweep: Completed, clearing liquidity below 4,070.
FVG (Fair Value Gap): 4,191 – 4,202 → filled, confirming price balance.
Sell Liquidity Zone: 4,237 – 4,240 → potential resistance area, likely strong reaction.
OB Zone | Buy: 4,143 – 4,145 → nearby support, expected first reaction on price pullback.
OB Deep | Buy: 4,110 – 4,115 → deep demand zone, confluence with Premium Zone 4,156 – 4,118.
Overall Structure: The main trend remains bullish , with strong upward momentum but requires technical pullback for re-accumulation.
📈 Trading Scenarios
1️⃣ Main Scenario – Sell reaction at liquidity zone
When the price approaches the Sell Liquidity Zone 4,237 – 4,240 USD , observe candle reactions (rejection, bearish engulfing).
If confirmation signals appear, open short-term sell orders .
Target: OB Buy Zone 4,145 → 4,110 USD.
Stop Loss: above 4,245 USD.
➡️ This is a liquidity reaction setup, high probability when the market encounters resistance confluence with Fibonacci zone 0.786–1.0.
2️⃣ Alternative Scenario – Buy with trend from OB
If the price pulls back to the OB Zone 4,143 – 4,145 USD and shows clear reaction (strong rejection or minor structure break),
→ consider opening buy orders with the main trend .
Target: return to 4,200 → 4,235 USD.
Stop Loss: below 4,130 USD.
If the price drops further, the OB Deep Buy 4,110 – 4,115 USD will be the final “liquidity draw” zone for a new upward bounce.
⚠️ Risk Management
Avoid FOMO buying at 4,200+ as it is near the liquidity resistance zone.
Prioritize short-term selling at 4,237 if clear signals are present.
When price pulls back to OB, wait for reaction before buying, do not bottom-fish early.
💬 Conclusion
After completing the liquidity sweep, gold has confirmed a return to bullish structure with multiple consecutive BoS.
Currently, the price is nearing the liquidity zone 4,237 USD – a short-term pullback is highly likely.
The 4,145 – 4,110 USD area will be where buyers await reaction to accumulate orders and continue the medium-term uptrend.
👉 Reasonable Strategy:
Short sell at 4,237 USD if reversal signals appear.
Wait to buy at OB zone 4,145 – 4,110 USD when clear reaction occurs.

10.15 Gold continues to rise, beware of a pullbackGold 4-hour chart level: Asian session directly pulled up strongly. The overnight closing itself was not at a relatively high level, and it was still 40 meters away from the previous high. After a short squeeze and strong pull, it did not stop until the European session reached the upper track of the yellow channel 4218 in the figure, and then there was a sharp drop, with the lowest point at 4165. The high point of this wave of suppression was predicted in place (4215 was prompted in advance to pay attention to the resistance pressure), but the low of 4165 was only touched for a few seconds, so only 4180-4190 can be chosen; Judging from the current trend, the US session tends to see a strong consolidation at a high level. The resistance is still the derivative of the upper track of the yellow channel, which will move up to 4220-25. The support is the middle track 4170, which is also the retracement point of the previous red channel line; after approaching both sides, we will look for pressure or support signals to try to make a shock;
Sell the Rip, Buy the Dip —Double Profit on Gold’s MoveGold currently hit a high of around 4218 and is currently retreating slightly. However, it quickly rebounded to above 4200 after just retreating to around 4164. It can be clearly seen that it is still far from the level of panic selling, so the current retreat is only regarded as a healthy technical retreat.
The market has a high degree of recognition and participation in the current continued rise in gold prices, and expectations for a pullback in the short term should not be too large. With the support of multiple risk-averse factors in the market, and the resonance of news and technical factors, the market's bullish sentiment is high. It is not ruled out that every effective technical pullback in gold is a good time to participate in long trading.
Judging from the current morphological structure, gold is under pressure from the resistance zone of the trend channel and has not been able to stand above 4200 in the short term. There is a technical need for a retracement, so gold is likely to continue to fall and test the support of the 4155-4145 area. If gold fails to fall below this support area during its downward exploration, gold may continue to rebound based on this support area and hit the area around 4230.
So for short-term trading:
1. First, we can try shorting gold in the 4185-4195 area, initially targeting the 4160-4150 area.
2. After gold retraces to the 4155-4145 area, we can try going long again, initially targeting the 4200-4210 area.
We first consider shorting gold, and after gold effectively retreats, we will wait for an opportunity to go long on gold. In this way, we can capture every volatile profit as much as possible and avoid profit loss!

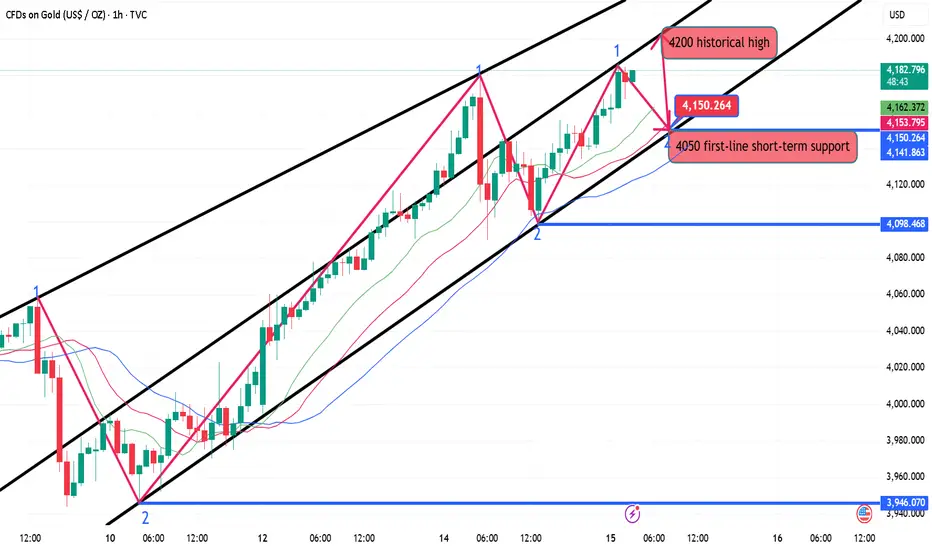
The 4200 Era Is Coming — Where Will the Next Bull Run Begin?Gold has reached new highs during its rebound, breaking through the recent technical resistance at 4180. In the short term, there is no significant resistance above, and no clear peak signal has emerged, demonstrating the continued strength of the bulls.
From the current technical perspective, gold has formed a clear W-shaped double bottom structure in the short term, combining the 4090 and 4097 levels, providing support for further gains. Therefore, the deep pullback that occurred yesterday is only regarded as a technical pullback in a strong pattern, and does not change its inherent bullish logic; coupled with the support of multiple risk-averse factors in the market, under the resonance of technical and news aspects, according to the previous fluctuation range, gold is expected to continue to rise to the 4210-4230 area.
As the center of gravity of gold continues to rise, the key now is to find the next reliable support level. The current short-term support has clearly moved up to the 4155-4140 area, which is the best position for bulls to re-accumulate strength before the next breakthrough. Therefore, the 4155-4140 area is the entry area for us to focus on building long positions in gold in batches; the short-term upward target area is 4200-4210.
If you’re following this rally, don’t just watch — prepare your next move.
💬 Like & Follow for real-time updates and in-depth gold insights.
📈 Follow me for real-time gold insights &to my traders' channel for exclusive setups in bio!

10.15 Gold breaks high again, looking for retracement to continuAfter a significant bearish candlestick pattern, the gold price's hourly chart immediately took off with a bullish candlestick pattern in the Asian session, signaling a rebound from a bottoming out. The large bullish candlestick pattern at the bottom solidified the base, and the moving average took off again, also trending almost vertically upward. The candlestick pattern remained above the moving average throughout, demonstrating the unstoppable bullish momentum. The upper limit remains at 4200.
Intraday short-term trading strategy:
BUY: 4150 Stop-loss: 4142
Top 1: 4185
Top 2: 4200
Explosive Battle Ahead — Can Gold Smash Through 4180 Again?Gold retreated $90 from 4180 to around 4090, then hit the 4100-4090 area twice before rebounding, and is currently consolidating around 4150. Although the short-term retracement of gold is not small, it is obvious that it has not destroyed the upward trend and pattern structure. However, it has exacerbated market differences to a certain extent and also increased short-term volatility. First, 4160 represents the 23.6% retracement level. Next, we must closely monitor two areas. First, 4160 represents the 23.6% retracement level of the recent short-term rally. If gold fails to break through this area during its subsequent rebound, it could form a technical M-shaped double top with the 4180 high in the short term, favoring a downward trend for gold and potentially leading to a further correction.
Second, we must pay close attention to the area around 4125, which represents the 61.8% retracement level of the recent short-term rally. If gold remains above 4125 during its subsequent pullback, it indicates that the bullish trend in gold has not ended and that it may continue to reach new highs.
Based on the above considerations, regarding short-term trading:
1. First, we can consider shorting gold in small quantities in the 4150-4160 area, and then patiently wait for gold to retrace.
2. Once gold retreats to the 4125-4115 area, we can try to go long again, and then patiently wait for gold to rebound further, or even retest the recent high near 4180.

10.14Gold bulls continue to exert their strength!!!Gold is currently stabilizing after a broad range-bound consolidation on the 4-hour chart. It experienced an unexpected intraday plunge, but the momentum has been minimal. A rapid intraday rise followed by a sustained decline could present an opportunity for a short position. The price has rebounded after retracing to previous support levels, and the K-line charts are still trading above the short-term moving average, suggesting a relatively strong trend in the short term. There are currently no significant technical patterns on the hourly chart. On the smaller timeframes, pressure is building on the short-term moving average, maintaining a weak trend. There may be some room for correction in the short term. Focus on the support level around 4005 in the short term.
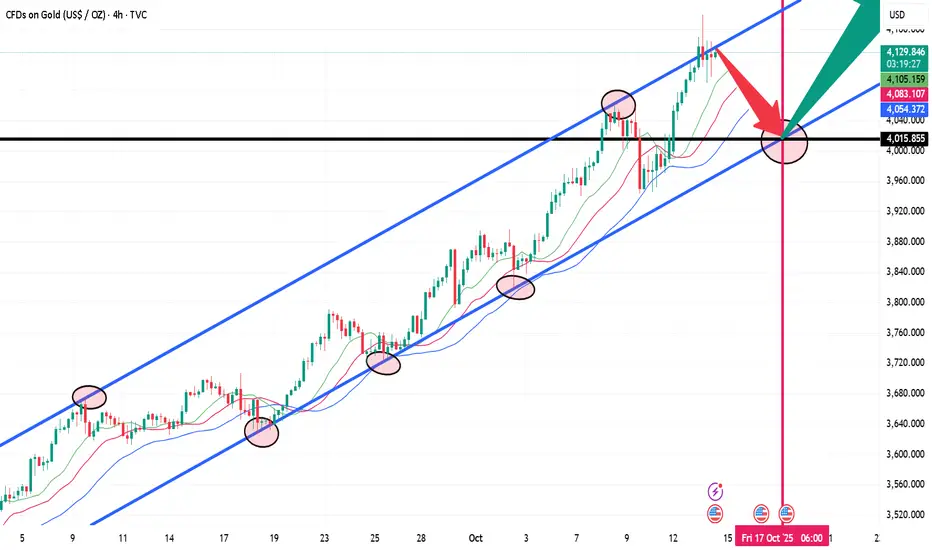
GOLD 4H CHART ROUTE MAP UPDATE & TRADING PLAN FOR THE WEEKHey Everyone,
Please see our updated 4h chart levels and targets for the coming week.
We are seeing price play between two weighted levels with a gap above at 4041 and a gap below at 3978. We will need to see ema5 cross and lock on either weighted level to determine the next range.
We will see levels tested side by side until one of the weighted levels break and lock to confirm direction for the next range.
We will keep the above in mind when taking buys from dips. Our updated levels and weighted levels will allow us to track the movement down and then catch bounces up.
We will continue to buy dips using our support levels taking 20 to 40 pips. As stated before each of our level structures give 20 to 40 pip bounces, which is enough for a nice entry and exit. If you back test the levels we shared every week for the past 24 months, you can see how effectively they were used to trade with or against short/mid term swings and trends.
The swing range give bigger bounces then our weighted levels that's the difference between weighted levels and swing ranges.
BULLISH TARGET
4041
EMA5 CROSS AND LOCK ABOVE 4041 WILL OPEN THE FOLLOWING BULLISH TARGETS
4099
EMA5 CROSS AND LOCK ABOVE 4099 WILL OPEN THE FOLLOWING BULLISH TARGET
4154
EMA5 CROSS AND LOCK ABOVE 4154 WILL OPEN THE FOLLOWING BULLISH TARGET
4212
BEARISH TARGETS
3978
EMA5 CROSS AND LOCK BELOW 3978 WILL OPEN THE FOLLOWING BEARISH TARGET
3916
EMA5 CROSS AND LOCK BELOW 3916 WILL OPEN THE SWING RANGE
3840
3767
EMA5 CROSS AND LOCK BELOW 3767 WILL OPEN THE SECONDARY SWING RANGE
3689
3632
As always, we will keep you all updated with regular updates throughout the week and how we manage the active ideas and setups. Thank you all for your likes, comments and follows, we really appreciate it!
Mr Gold
GoldViewFX

XAUUSD | m15 frame gold drops sharply by 50 points ? 🔍 Market Context
Gold prices have just set a historical peak (ATH GOLD) around the 4,180 USD region, following a steep upward trend over multiple sessions.
Immediately after, the market witnessed the first break of upward structure (BoS) – a sign indicating that bullish momentum is weakening .
Currently, prices are returning to fill the Fair Value Gap (FVG) at 4,125 – 4,145 USD , which is likely a liquidity rebalancing phase before prices choose the next direction.
💎 Technical Analysis
ATH GOLD: 4,180 – 4,185 USD
Fair Value Gap (FVG): 4,125 – 4,145 USD → an empty price area that needs to be filled.
Order Block Buy Zone 1: 4,050 – 4,060 USD → the nearest demand zone, potentially creating the first technical reaction.
Order Block Buy Zone 2: 3,980 – 3,985 USD → a deep demand zone with large liquidity confluence, likely to become the main "accumulation point."
Overall Structure: After breaking the upward channel, the market is in a retracement phase – the medium-term structure remains bullish .
📈 Trading Scenarios
1️⃣ Short-term Sell Scenario – filling FVG and technical adjustment
If prices continue to test the FVG 4,125 – 4,145 USD region without breaking through,
→ consider a short-term sell to catch the technical retracement phase.
Target: the first OB Buy Zone 4,050 USD .
Stop Loss: above 4,155 USD (to avoid being swept above the FVG peak).
➡️ This scenario is suitable for short-term traders following corrective waves – only enter when there is a clear reversal candle confirmation.
2️⃣ Trend-following Buy Scenario – catching the rebound from OB Zone
If prices adjust to the 4,050 – 4,060 USD region, observe reaction signals such as Bullish Engulfing or strong Rejection .
Upon confirmation, open a trend-following buy order .
Target: the 4,125 → 4,145 USD region or the old peak of 4,180 USD.
Stop Loss: below 4,030 USD.
If the first OB zone doesn't hold, the 3,980 – 3,985 USD area will be an ideal zone for long-term "accumulation."
⚠️ Risk Management
Avoid FOMO buying at high prices when the FVG is not yet filled.
Prioritize trading at clear reaction zones (OB, FVG edge).
Reduce volume when entering counter-trend orders to preserve capital.
💬 Conclusion
After a steep rise, gold is entering a value rebalancing phase .
The current market structure leans towards a short-term technical retracement before continuing the main upward trend.
If the 4,050 – 4,060 USD region reacts well, gold may soon rebound and aim for the 4,150 – 4,180 USD region.
👉 Reasonable Strategy:
Short-term sell when prices react at FVG.
Wait to buy at OB Buy Zone when there is a confirmed upward signal.
