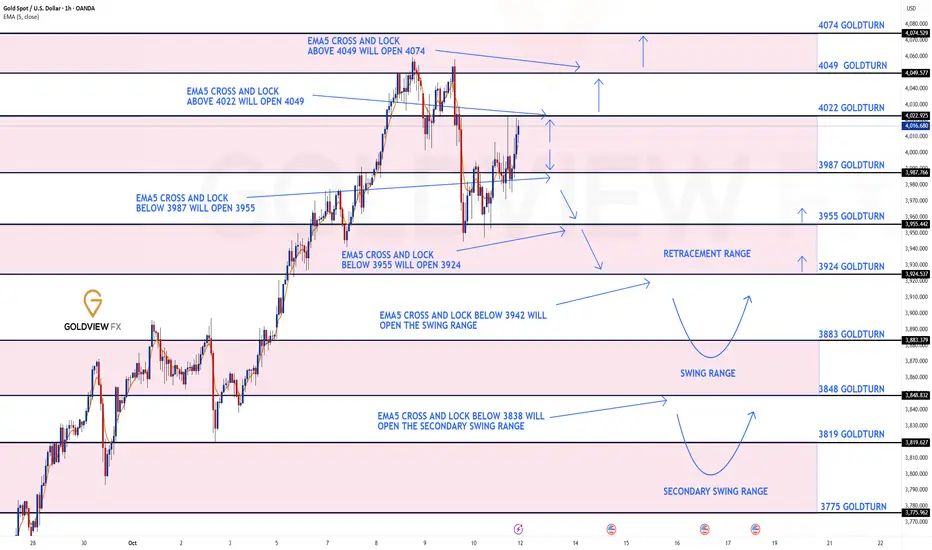
GOLD 1H CHART ROUTE MAP UPDATE & TRADING PLAN FOR THE WEEKHey Everyone,
Please see our updated 1h chart levels and targets for the coming week.
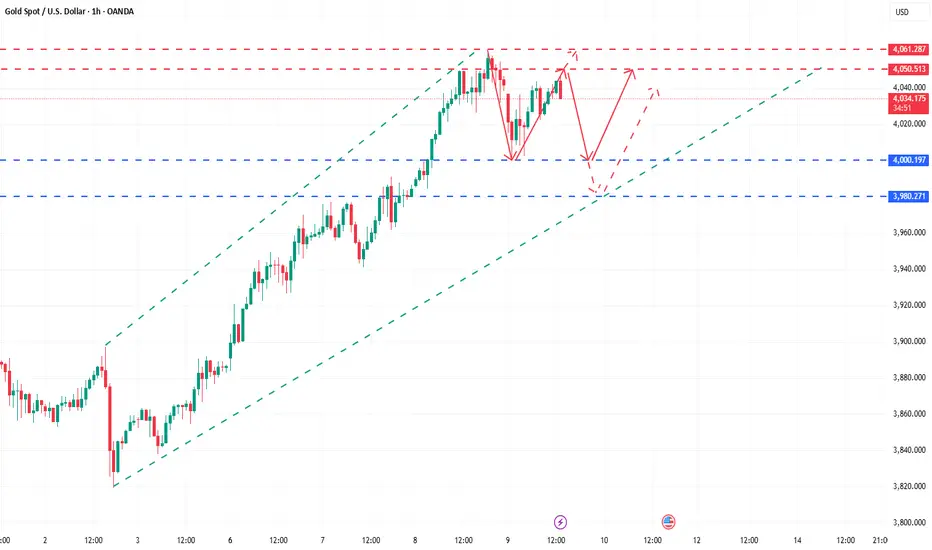
We are seeing price play between two weighted levels with a gap above at 4022 and a gap below at 3987. We will need to see ema5 cross and lock on either weighted level to determine the next range.
We will see levels tested side by side until one of the weighted levels break and lock to confirm direction for the next range.
We will keep the above in mind when taking buys from dips. Our updated levels and weighted levels will allow us to track the movement down and then catch bounces up.
We will continue to buy dips using our support levels taking 20 to 40 pips. As stated before each of our level structures give 20 to 40 pip bounces, which is enough for a nice entry and exit. If you back test the levels we shared every week for the past 24 months, you can see how effectively they were used to trade with or against short/mid term swings and trends.
The swing range give bigger bounces then our weighted levels that's the difference between weighted levels and swing ranges.
BULLISH TARGET
4022
EMA5 CROSS AND LOCK ABOVE 4022 WILL OPEN THE FOLLOWING BULLISH TARGETS
4049
EMA5 CROSS AND LOCK ABOVE 4049 WILL OPEN THE FOLLOWING BULLISH TARGET
4074
BEARISH TARGETS
3987
EMA5 CROSS AND LOCK BELOW 3987 WILL OPEN THE FOLLOWING BEARISH TARGET
3955
EMA5 CROSS AND LOCK BELOW 3955 WILL OPEN THE FOLLOWING BEARISH TARGET
3924
EMA5 CROSS AND LOCK BELOW 3924 WILL OPEN THE SWING RANGE
3883
3848
EMA5 CROSS AND LOCK BELOW 3848 WILL OPEN THE SECONDAARY SWING RANGE
3819
3775
As always, we will keep you all updated with regular updates throughout the week and how we manage the active ideas and setups. Thank you all for your likes, comments and follows, we really appreciate it!
Mr Gold
GoldViewFX
Goldtradingstrategy
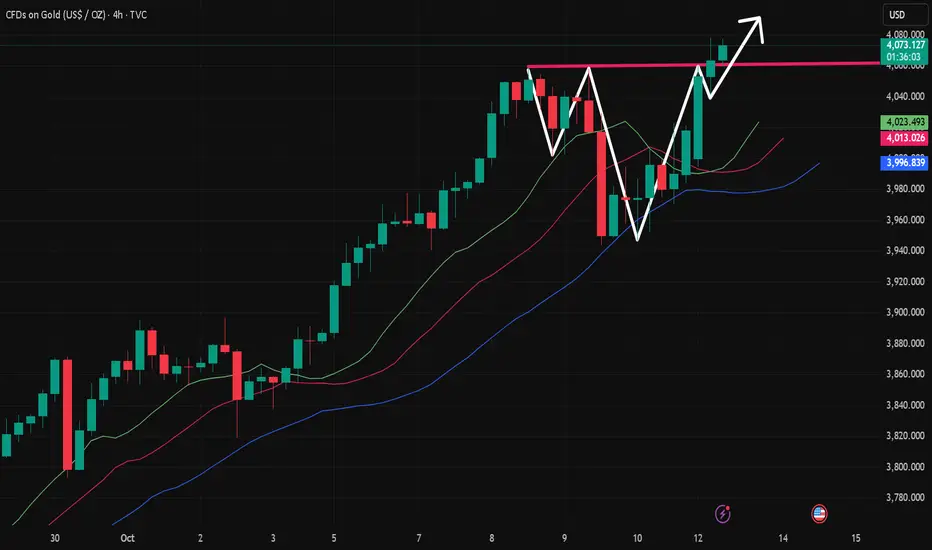
4100 Breakout in Sight! Gold Bulls Target 4130 Next!Gold is still maintaining a strong upward position and has broken through the recent high of 4050-4060 in the short term. There is no clear suppression area above and no obvious signs of turning back. According to the current structural form, gold still has the potential to continue to rise and is expected to hit 4100 or even around 4130. Currently, we need to pay special attention to three areas:
1. Market sentiment: around 4100;
2. Key area for continued gains: around 4130;
3. Short-term support below: 4055-4045.
Therefore, when executing short-term trades, we should avoid excessively chasing gold prices. We can consider waiting for gold to retreat to the 4055-4045 area before initiating small long positions.
If you’re following this rally, don’t just watch — prepare your next move.
💬 Like & Follow for real-time updates and in-depth gold insights.
📈 Follow me for real-time gold insights &to my traders' channel for exclusive setups in bio!

Monday's Gold Operation Analysis Guide!!!Gold has broken through its previous high, which is a standard continued upward trend and V-shaped reversal. The original horizontal pressure of 4060 has become a thing of the past. We can only focus on the expected decline opportunity of the trend line to buy!!!
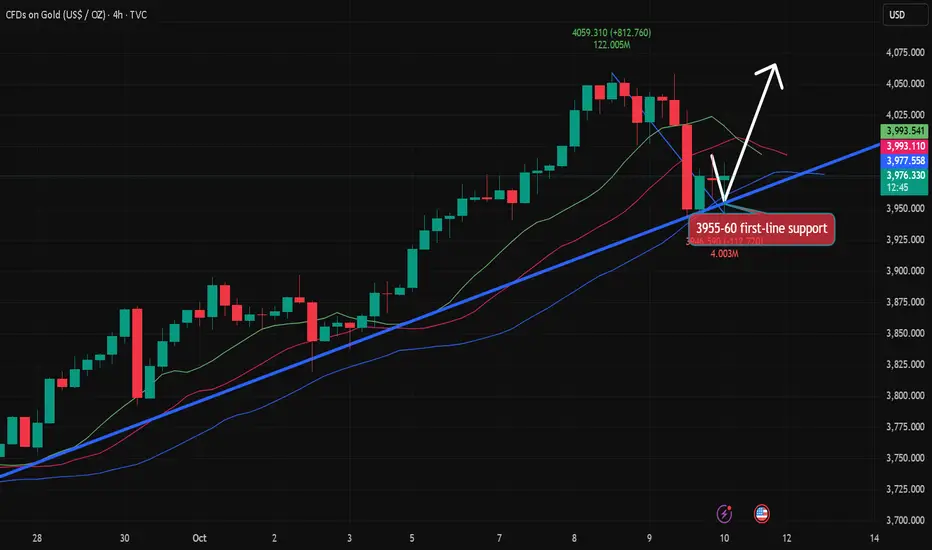
Gold will continue to rise at the end of the week!!!Gold is currently consolidating at a high level on the daily chart, nearly forming an engulfing pattern at a high level, making today's daily close crucial. On the 4-hour chart, prices are currently fluctuating at a low level, finding support around 3950. On the hourly chart, after continuous fluctuations, the technical pattern is gradually adjusting. The short-term moving average is gradually diverging upward, and the K-line chart is slowly crossing the short-term moving average. The short-term trend is gradually strengthening, suggesting further upside potential. Keep an eye on the resistance zone around 4010.
Trade Recommendation: Buy around 3975-6, with a stop-loss at 3966.
Bulls Regain Control!Is 4100 the Next Big Target?After touching the 3945-3955 area three times during the week, gold rebounded quickly and showed a clear lower shadow in the candle chart. It also showed an oscillating upward structure in the short-term structure, and formed a secondary springboard in the 3970-3980 area to rise again, and closed above 4010 on Friday. It can be seen that after the gold pullback, the bulls regained dominance and continued the bullish trend.
The short-term technical structure is biased towards bulls, the center of gravity is gradually moving up, and the buying support below is strong. I believe that gold still has the potential to continue to rise. The current short-term resistance of gold is in the 3930-3940 area. Once gold breaks through this resistance area, it could retest the previous highs of 3950-3960, or even extend its upward trend to around 4100.
So, how do you execute the trade next? I think we can consider going long on gold when it retraces to the 4000-3990 area, initially aiming for a short-term upside target of the 4030-4040 area.
Gold is showing renewed bullish momentum as buyers defend the 3970 zone.
Could this be the start of another strong rally toward 4100?
Follow me for real-time gold insights &to my traders' channel for exclusive setups!

XAUUSD – Safe-Haven Flows Continue to Support GoldMarket Context:
Gold remains firm as renewed US–China trade tensions and rising geopolitical risks drive safe-haven flows into XAUUSD.
Expectations of further rate cuts from the Federal Reserve continue to weaken the US Dollar, reinforcing bullish momentum for the metal.
Current Outlook:
As long as price action stays within the ascending channel, gold is likely to extend toward the 4,090–4,100 liquidity zone.
If a reaction occurs near 4,092–4,095, a short-term corrective move could follow.
Despite short-term overbought signals, the broader market structure still supports the bullish side.
Key Levels:
Liquidity Buy Zone 1: 4,039 – 4,037
Liquidity Buy Zone 2: 4,017 – 4,015
Liquidity Sell Zone: 4,092 – 4,095
Major Support: 4,010 – 4,000
Major Resistance: 4,110 – 4,126
Trading Plan:
🔹 BUY ZONE
Entry: 4,039 – 4,037
Stop Loss: 4,032
Take Profit: 4,044 → 4,048 → 4,052 → 4,056 → 4,060 → 4,070
🔹 BUY ZONE
Entry: 4,017 – 4,015
Stop Loss: 4,010
Take Profit: 4,022 → 4,026 → 4,030 → 4,040 → 4,050 → 4,060
🔹 SELL ZONE (Scalp Opportunity)
Entry: 4,092 – 4,095
Stop Loss: 4,100
Take Profit: 4,090 → 4,085 → 4,080 → 4,070 → 4,060
Summary:
The current structure remains bullish as long as the 4,015 – 4,020 zone holds firm.
Safe-haven demand and expectations of Fed easing continue to favour the upside.
Watch for potential liquidity sweep around 4,092 before any higher continuation.
📊 What’s your view — will gold break out or face rejection near 4,090?
👉 Follow MMFLOW TRADING for more structured daily plans and professional insights.

Gold |US–China Tensions Ease, Gold Eyes a New Breakout Above ATH🌍 Macro Overview: Cooling US–China Tensions
Geopolitical pressure between the US and China appears to be easing after China’s Ministry of Commerce clarified that export controls on rare earth materials do not mean an export ban — a clear attempt to reopen constructive dialogue with Washington.
Meanwhile, US Vice President JD Vance signaled a softer stance toward Beijing, stating:
“We highly value the friendship between President Trump and President Xi Jinping.”
“President Trump hopes the US won’t need to use leverage against China.”
“President Trump is ready for a fair and reasonable negotiation with Beijing.”
➡️ These remarks suggest a temporary de-escalation in geopolitical risks, improving overall risk sentiment and prompting investors to shift focus back to technical structures and liquidity zones on gold.
💎 Technical Outlook (XAU/USD H1)
After a sharp drop from its All-Time High (ATH), gold found strong support at the 3975–3985 Support Zone, coinciding with a Change of Character (ChoCh) reversal area.
Price has since established an ascending channel, moving back toward the upper liquidity zone (4020–4030) — a critical area where short-term profit-taking may occur before another leg higher.
⚙️ Key Technical Levels
Liquidity Zone $$$ (4020–4030): Short-term resistance; potential pullback zone.
Liquidity Zone $$$ (3990–4005): Key demand area where buy orders are likely stacked.
Breakout Support: 4008 — now acting as near-term structure support.
ATH Zone: 4045–4050 — key upside target; a confirmed breakout could open room toward 4100.
📈 Trade Scenarios
Primary Scenario (Buy on Dip):
Look for price to retest the 3995–4005 liquidity zone for long entries.
Target: 4025 → 4050.
Stop loss: below 3980.
Extended Bullish Scenario:
If price holds above 4050, the next expansion target lies at 4080–4100.
⚠️ Risk Notes
The US–China diplomatic tone remains fragile; sudden rhetoric shifts could trigger volatility.
Wait for a confirmed H1 close above 4025 to validate bullish continuation before scaling in.
🧭 Summary
The easing in US–China tensions has reduced safe-haven demand for gold in the short term, but technical momentum still favors the bulls.
As long as the 4000 psychological level holds firm, XAU/USD is well-positioned to retest and potentially break above the 4050 ATH zone, targeting 4100+ in the coming sessions.

GOLD MONTHLY CHART LONG TERM/RANGE ROUTE MAPHey Everyone,
We’ve just released our new Monthly Chart idea, which we’ll now be tracking following the successful completion of our previous long term monthly chart idea. That one played out beautifully, and now it’s time to shift focus to the next big setup.
Currently, price is trading above the channel midline, and we’ve also seen an important EMA5 cross and lock above 3099, with a candle body close confirming a long term gap above at 3557.
While this confirms the bullish long term structure, we’re also mindful of the potential for a short term retracement, particularly around the EMA5 detachment zone (highlighted with a circle on the chart). This would offer a healthy dip opportunity, aligning perfectly with our strategy to buy into weakness on the way up.
For the bigger structure to remain intact, we’ll be looking for 3099 to continue holding as key structural support. As long as that level is respected, the long term gap toward 3557 remains firmly in play.
This is a higher timeframe idea that we’ll be building on as structure continues to unfold.
We will continue to use all support structures, across all our multi time frame chart ideas to buy dips also keeping in mind our long term gaps above. Short term we may look bearish but looking at the monthly chart allows us to see the bigger picture and the overall long term Bullish trend.
As always, we will keep you all updated with regular updates throughout the week and how we manage the active ideas and setups. Thank you all for your likes, comments and follows, we really appreciate it!
Mr Gold
GoldViewFX

GOLD WEEKLY CHART MID/LONG TERM ROUTE MAPWeekly Chart Update – Follow Up
3732 & 3806 Objectives Achieved, 3910 Gap Opens
Hey Everyone,
Last week’s structure played out precisely as projected, we achieved our 3806 target following a confirmed body close above 3732, validating the continuation leg within our Goldturn structures.
This week, we’ve seen a weekly candle body close above 3806, officially opening the 3910 gap zone. The bullish structure remains well defined, supported by four consecutive weeks of EMA5 detachment, which confirms sustained upside momentum. However, this extended separation also signals potential for sharp corrective phases, requiring careful risk management and dynamic positioning.
Current Outlook
🔹 3732 Breakout & 3806 Objective Completed
Last week’s projected upside target was met precisely following a strong candle close confirmation.
🔹 3910 Gap Now Active
With the weekly close above 3806, the next structural resistance opens toward the 3910 zone.
🔹 EMA5 Detachment (4 Weeks Running)
Persistent detachment supports ongoing bullish momentum, but traders should remain alert for any mean reversion pullbacks or exhaustion on lower timeframes.
🔹 Support Structure
Immediate support now rests at 3806, followed by 3732 as a pivotal retest zone. Deeper support sits at 3659, which aligns with the ascending channel top confluence a critical structural level if broader correction unfolds.
Updated Key Levels
📉 Supports: 3806 (immediate), 3732 (secondary), 3659 (pivotal channel confluence)
📈 Resistance / Next Upside Objective: 3910–4015 zone
Plan & Risk Outlook
The bullish framework remains intact, but with EMA5 detachment now stretched, traders should anticipate volatility spikes or short term corrective dips. A controlled pullback into the lower Goldturns would be considered technically healthy and may offer fresh accumulation opportunities in line with the broader structure.
We’ll continue to monitor for confirmation closes and EMA5 realignments during the week to gauge whether momentum extends or correction begins.
Trade safe, stay disciplined, and manage exposure around volatility.
Mr. Gold
GoldViewFX

GOLD 4H CHART ROUTE MAP UPDATE & TRADING PLAN FOR THE WEEKHey Everyone,
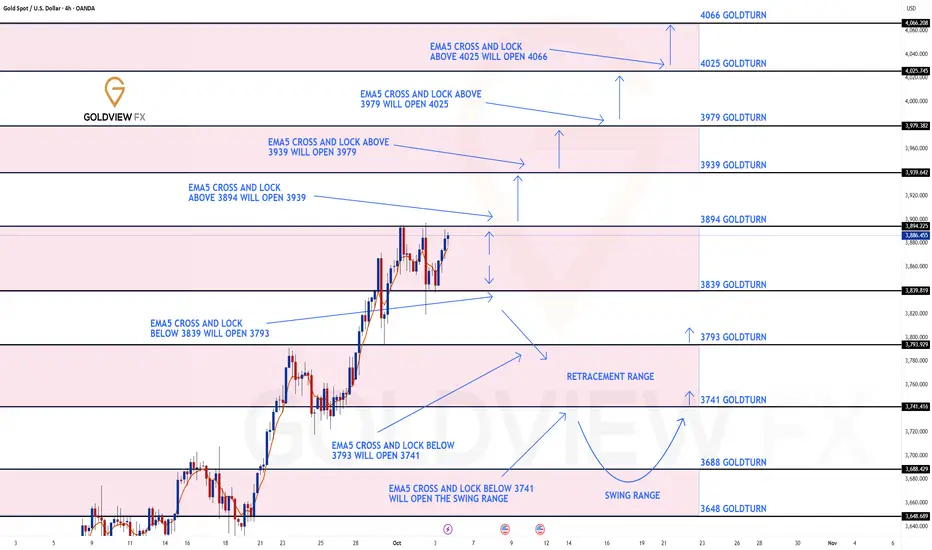
Please see our updated 4h chart levels and targets for the coming week.
We are seeing price play between two weighted levels with a gap above at 3894 and a gap below at 3839. We will need to see ema5 cross and lock on either weighted level to determine the next range.
We will see levels tested side by side until one of the weighted levels break and lock to confirm direction for the next range.
We will keep the above in mind when taking buys from dips. Our updated levels and weighted levels will allow us to track the movement down and then catch bounces up.
We will continue to buy dips using our support levels taking 20 to 40 pips. As stated before each of our level structures give 20 to 40 pip bounces, which is enough for a nice entry and exit. If you back test the levels we shared every week for the past 24 months, you can see how effectively they were used to trade with or against short/mid term swings and trends.
The swing range give bigger bounces then our weighted levels that's the difference between weighted levels and swing ranges.
BULLISH TARGET
3894
EMA5 CROSS AND LOCK ABOVE 3894 WILL OPEN THE FOLLOWING BULLISH TARGETS
3939
EMA5 CROSS AND LOCK ABOVE 3939 WILL OPEN THE FOLLOWING BULLISH TARGET
3979
EMA5 CROSS AND LOCK ABOVE 3979 WILL OPEN THE FOLLOWING BULLISH TARGET
4025
EMA5 CROSS AND LOCK ABOVE 4025 WILL OPEN THE FOLLOWING BULLISH TARGET
4066
BEARISH TARGETS
3839
EMA5 CROSS AND LOCK BELOW 3793 WILL OPEN THE FOLLOWING BEARISH TARGET
3741
EMA5 CROSS AND LOCK BELOW 3741 WILL OPEN THE SWING RANGE
3688
3648
As always, we will keep you all updated with regular updates throughout the week and how we manage the active ideas and setups. Thank you all for your likes, comments and follows, we really appreciate it!
Mr Gold
GoldViewFX
GOLD 1H CHART ROUTE MAP UPDATE & TRADING PLAN FOR THE WEEKHey Everyone,
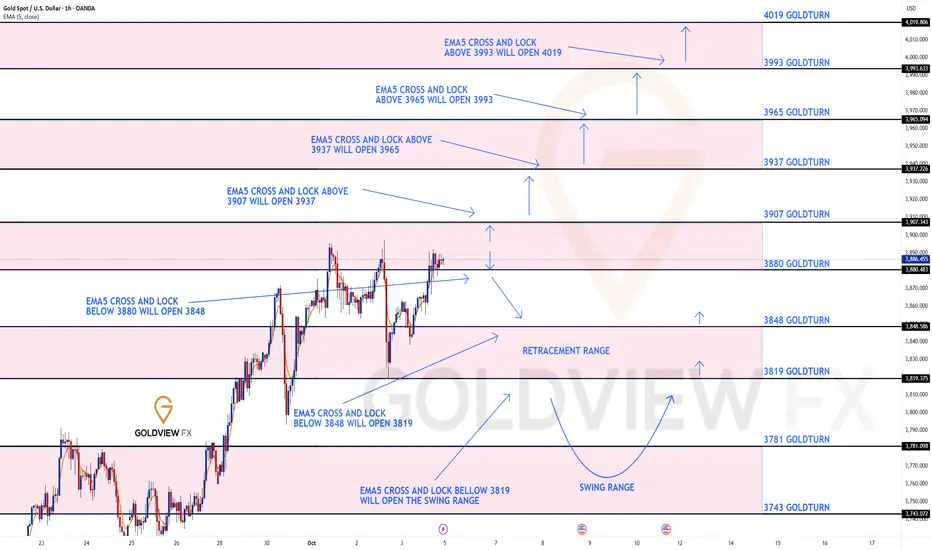
Please see our updated 1h chart levels and targets for the coming week.
We are seeing price play between two weighted levels with a gap above at 3907 and a gap below at 3880. We will need to see ema5 cross and lock on either weighted level to determine the next range.
We will see levels tested side by side until one of the weighted levels break and lock to confirm direction for the next range.
We will keep the above in mind when taking buys from dips. Our updated levels and weighted levels will allow us to track the movement down and then catch bounces up.
We will continue to buy dips using our support levels taking 20 to 40 pips. As stated before each of our level structures give 20 to 40 pip bounces, which is enough for a nice entry and exit. If you back test the levels we shared every week for the past 24 months, you can see how effectively they were used to trade with or against short/mid term swings and trends.
The swing range give bigger bounces then our weighted levels that's the difference between weighted levels and swing ranges.
BULLISH TARGET
3907
EMA5 CROSS AND LOCK ABOVE 3907 WILL OPEN THE FOLLOWING BULLISH TARGETS
3937
EMA5 CROSS AND LOCK ABOVE 3937 WILL OPEN THE FOLLOWING BULLISH TARGET
3965
EMA5 CROSS AND LOCK ABOVE 3965 WILL OPEN THE FOLLOWING BULLISH TARGET
3993
EMA5 CROSS AND LOCK ABOVE 3993 WILL OPEN THE FOLLOWING BULLISH TARGET
4019
BEARISH TARGETS
3880
EMA5 CROSS AND LOCK BELOW 3880 WILL OPEN THE FOLLOWING BEARISH TARGET
3848
EMA5 CROSS AND LOCK BELOW 3848 WILL OPEN THE FOLLOWING BEARISH TARGET
3819
EMA5 CROSS AND LOCK BELOW 3819 WILL OPEN THE SWING RANGE
3781
3743
As always, we will keep you all updated with regular updates throughout the week and how we manage the active ideas and setups. Thank you all for your likes, comments and follows, we really appreciate it!
Mr Gold
GoldViewFX
Clash of Titans — Bulls vs Bears: Who Will Win This Round?Gold rebounded quickly after touching 3945 twice, and rebounded again after touching 3953. Three long lower shadows were shown in the candle chart. This area happens to be the 50% area of the previous rising wave. There are obvious signs of bottoming out in the short term. From the overall trend, although the short-term retracement of gold is not small, it has not fallen below the 3930 trend channel support, and has not even effectively fallen below 3950. Therefore, the overall gold trend is still bullish.
Judging from the current structure, if gold breaks through the key level of 4010-4030 during the rebound, gold will resume its strong bullish pattern and has the potential to test or even break through the recent highs again; if gold cannot recover the key level of 4010-4030 in the short term, gold may maintain a volatile pattern in the 4010-3950 area or the 4030-3970 area.
Therefore, in short-term trading:
1. If gold continues to rebound, we can first consider shorting gold in the 4010-4030 area; then patiently wait for gold to retrace.
2. If gold retreats first, we can first consider longing gold in the 3970-3950 area; then patiently wait for gold to rise.

10.10 Gold pullback continues to be bullish!!!Looking at the 4-hour market trend, watch for the important support level at 3957-3960. The bulls are rising strongly and there's no end in sight. Trading strategies should prioritize buying on dips. In the middle, be cautious and watchful when buying.
Gold Trading Strategies:
1. Go long on gold at 3957-3960, with a stop loss at 3948 and a target of 4015-4020. Hold if it breaks through!
XAUUSD – Breakdown After Ceasefire & Fed Comments📉 Market Overview
Gold (XAUUSD) dropped over 2%, sliding from $4,012/oz to $3,945/oz, marking a sharp $67 decline overnight.
The selloff came as two key catalysts hit the market:
🕊 Israel–Hamas ceasefire agreement cooled down geopolitical tensions.
💬 Fed’s Barr pushed back against October rate cuts, sending USD higher and pressuring gold.
Despite the drop, price action suggests a temporary corrective phase, with gold now stabilising near a short-term support zone.
📊 Technical Structure (MMFLOW View)
Gold has confirmed a Head & Shoulders (H&S) breakdown pattern, with a neckline retest around $4,014 – $4,033 acting as resistance.
After the breakdown, price rebounded slightly but continues to trade below the structure, showing that bears remain in control short-term.
The short-term support zone sits around $3,945, and if broken, could accelerate the decline towards $3,912 – $3,885, aligning with deeper liquidity areas.
🔑 Key Zones to Watch
Resistance (Breakdown Zone): 4,014 – 4,033
Support (Short-term): 3,945 – 3,912
Liquidity/Buy Zone: 3,885 – 3,878
💡 MMFLOW Trading Scenarios
🔵 BUY SCALP Zone: 3,912 – 3,910
🔴 Stop Loss: 3,905
✅ Take Profit: 3,916 – 3,920 – 3,925 – 3,930 – 3,940 – 3,950 – ???
Trading View:
The market is still digesting recent fundamentals; volatility remains high.
A short-term rebound from 3,910 is possible as liquidity builds up near this demand zone.
However, unless price reclaims 4,014, any bounce may only be corrective before further downside continuation.
🧭 MMFLOW Insight
Even though gold faces bearish momentum, macro risks still support a long-term bullish narrative:
U.S. government shutdown risks remain unresolved.
Fed may turn dovish later in Q4 if labour data weakens.
Liquidity gaps below $3,900 could attract smart money accumulation zones.
⚠️ Trading Notes
✅ Always set Stop Loss – NFP-style volatility can occur post-Fed comments.
✅ Avoid chasing after breakdown candles. Wait for pullback entries at key levels.
✅ Be patient — the best setups form when liquidity is fully absorbed.
📍 Summary
Gold continues to trade under pressure after geopolitical easing and hawkish Fed tones.
Watch for price action around $3,910 – $3,945; this range will likely define the next major impulse.
Stay alert — once liquidity clears, MMFlow will be watching for smart-money reentry signals from key OB/CP zones.

Gold rebound is still a good opportunity to short!Judging from the current trend, gold was affected by the easing of geopolitical situation, and the risk aversion sentiment temporarily receded. After falling below the 4000 mark, it quickly extended to around 3944. The daily line closed with a medium-sized negative line, almost completely engulfing the previous day's gains. The short-term indicators formed a death cross at a high level, and the momentum weakened significantly. The focus of the day is on the gains and losses of the 4000 mark, which is also the key position for the recent top and bottom conversion. In the 4-hour cycle, the price rose and fell again and closed lower. The big negative line broke through the middle track support. The previous strong unilateral bullish pattern was broken and the market entered a pullback correction stage. Therefore, it is expected that there will be room for repeated adjustments today. The upper pressure focuses on the 3980-3995 area, and the lower short-term support focuses on the 3945-3940 area. If it stabilizes and does not break, you can consider trying to go long on gold with a light position. If it breaks further, pay attention to the bullish defense zone in the 3930-3920 area, and then consider going long on gold. In terms of overall operations, maintain the idea of main short and auxiliary long, wait for the key point confirmation signal, enter the market steadily, strictly control the risk, and execution is still the key to profitability.

Accurate sniping, gold is shorted all the way.Who else has continuously arranged short orders from above 4050 and gone down all the way. Before the market closed yesterday, we arranged in advance at 3990 and accurately set a limit short order. During the opening rebound, gold only touched 3994. After perfectly activating the limit short order, it quickly fell and hit the target near 3970 in one fell swoop, with a steady profit of 200pips on a single transaction. This wave of operations is not only a manifestation of technology, but also a perfect combination of rhythm and plan execution. It once again verifies our core concept of planned trading and strict risk control, precise analysis, advance layout, and steady cashing. Looking back at the entire market, since above 4050, we have clearly stated that there is a risk of periodic correction in gold, and have repeatedly suggested the idea of shorting on the rebound. Facts have proved that planning in advance and decisive execution are better than chasing ups and downs afterwards. The rhythm of this round of decline is clear, and the short-selling-dominated pattern is obvious. We decisively enter the market in the key interval. Every high-level short order is fast, accurate, and ruthless, and we win in a steady manner.
From a technical perspective, gold completed a structural breakdown at the 4000 mark. Short-term support is focused on the 3945-3940 area. If it continues to break down, it will open up downward space to the 3920 line. The upper pressure is focused on the 4000-4015 area. Rebound pressure is still the focus of shorting at rallies. The overall rhythm is still bearish, and short-term operations are mainly based on rebound shorting.
The market never waits for anyone. Profits belong to traders who have plans and execution capabilities. Congratulations to all my friends who are paying attention. Once again, I have steadily realized profits. Strength is not something that can be expressed with words, but is the result of precise implementation of each order. Next, I will continue to track the gold fluctuation structure and lead everyone to steadily grasp the next key market opportunity.

Gold short positions above 4050 have achieved another success!Today we have been emphasizing that gold may usher in a major adjustment. In the end, gold fell below the 4,000 mark. This position is exactly the important medium-term bullish and bearish turning point that we have been adhering to for a long time. Gold broke through and fell directly during the U.S. trading session. We participated in short orders throughout the process. Gold fell sharply as expected. At present, gold has fallen below the key mark. It is likely to be mainly adjusted in the short term. There is a lack of new positive news stimulation in the near future. The market may enter the bearish home court next. The gold 1-hour moving average has turned, indicating that the bullish momentum has weakened significantly and the rebound strength is limited. The trading ideas in the future are still clear. The rebound is under pressure in the 3985-4000 area, which are opportunities to short at highs. We never do stubborn longs or shorts. Once the long and short key positions are broken, the trend has turned. Only by following the trend can we be invincible.

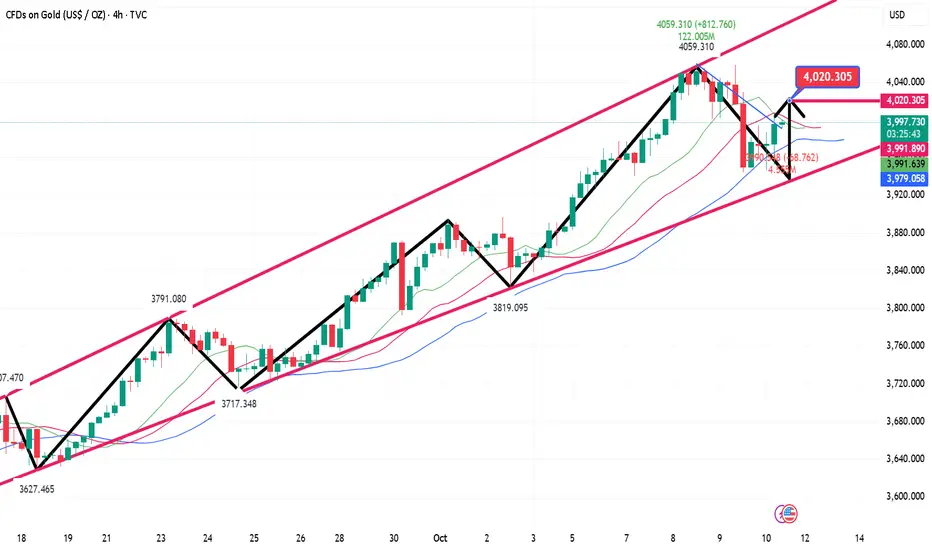
Gold’s Pullbacks Reveal Bearish Strength — 3960 in Sight!After gold retreated from around 4060, it encountered resistance and fell back frequently during the rebound. Although gold still maintained an overall bullish trend, the bullish momentum has obviously weakened, and the short-term gold market has entered a high-level fluctuation stage. Currently, the highest level of gold has reached around 4060. According to the current structure and rebound momentum, if gold cannot effectively break through the recent high of 4060, then gold is likely to form a secondary high point during the oscillation process and form an M-shaped double top structure with the recent high point.
Therefore, although gold is in an overall bullish trend, we still cannot ignore the considerable risk of a pullback in the short term before it effectively breaks through the high of 4060. At present, gold is testing the 4000 mark under the pressure of technical patterns. If the 4000 mark cannot withstand the test, gold may continue to retreat to the area around 3960.
Therefore, in short-term trading, we can still consider waiting for gold to rebound to the 4030-4040 area and try to short gold, first aiming at the retracement target area: 3990-3980; followed by 3960-3950!

The golden rhythm is in your hands!Today's gold trend once again perfectly verifies our strategic predictions. The market has entered the stage of falling under high pressure as expected. We have been shorting from above 4050 to the bottom. The rhythm is clear and the execution is in place. It can be said to be another god-level operation, with stability and precision coexisting. The value of planned trading is once again reflected. It is not a blind prediction, but a steady progress based on structure, rhythm and logic. Congratulations to my friends who are paying attention.
From the current gold trend analysis, although it rebounded to above 4050 during the US trading phase, it can be clearly seen from the 4-hour chart structure that the gold price entity still closed below 4045. This is also the main reason why I asked my brothers to arrange short positions in advance. 4045 is still an important suppression position at the stage, and the 4000 mark below is still a key support position. Once this mark is held, gold will most likely remain in the 4050-4000 range of shock and consolidation. On the contrary, if it falls below 4000 again, the downward space is expected to extend to around 3985-3980. On the contrary, if the market stabilizes without breaking 4000 and successfully breaks through and stands firmly above 4050, the emergence of a new high is only a matter of time. Therefore, the current core observation range is within the 4000-4050 area. Before the breakthrough, it is recommended to maintain the strategy of selling high and buying low. Once the price effectively breaks through the boundary of either side, following the trend is the best strategic direction.

10.9 Gold US Market Operation Guide!!!Looking at the 4-hour market trend, watch for the important support level of 3990-4000 below, and the bull-bear watershed of 3980-85. The bull market is rising strongly and there is no end in sight. Trading strategies should focus on buying on pullbacks. In the middle, be cautious about following orders.
Gold Trading Strategies:
1. Buy gold at 4000-4010, and add to long positions if it retraces to 3985-3993. Set a stop loss at 3977 and target 4045-4050.
Gold accurately grasps the rhythm!Yesterday, a historic breakthrough took place, with gold prices exceeding $4,000 per ounce for the first time and surging to around $4,060 at one point, while also driving silver prices to a record closing high. This strong rally was mainly driven by market risk-averse buying triggered by escalating geopolitical tensions. However, the market took a significant turn on Thursday, with Hamas and Israel suddenly reaching a ceasefire agreement in the Middle East, and market risk aversion quickly cooled, causing gold prices to fall from their highs. This dramatic "roller coaster" market clearly shows that the core logic currently dominating the gold market is still the change in geopolitical risk preferences, and its volatility has therefore been sharply amplified, sounding the alarm for the market.
From a technical perspective, after hitting a high near $4,060, gold prices retreated to key support near $4,000 in late New York trading, perfectly exemplifying the "buy bulls, don't chase the gains; reposition upon a pullback to key support" trading strategy. Currently, the $4,000 mark has become a key dividing line between bulls and bears in the near term. From an operational perspective, we recommend maintaining a medium- to long-term bullish approach, but emphasize entry timing and risk management. Specifically, we should consider the $4,000 level as a key defensive level, patiently awaiting dips and long opportunities after a pullback and stabilization. The initial upside target is the previous high near $4,060. If gold can successfully break through and hold this resistance area, it will open up further upside potential, potentially challenging $4,100 or even higher. Conversely, if repeated attempts to reach $4,060 fail, short-term bulls should appropriately take profits and exit positions, wary of the risk of price consolidation at high levels or a deeper technical correction.

Gold goes short first and then long, the rhythm is perfect!Gold has rebounded significantly after touching the key long position of the strategy near 4002 several times during the day, verifying the effectiveness of our previous layout ideas. The price rose rapidly after receiving strong support in the key support area, showing that the bulls still hold a dominant position. The short-term adjustment is more to accumulate momentum for an upward attack. Overall, the structure of a squat followed by a long jump is very obvious. From a technical perspective, the 4-hour cycle still maintains a bull-dominated pattern, the moving average system shows a good bullish arrangement, and the short-term price runs above the main moving average, indicating that the trend is still healthy. Although the MACD momentum column shows signs of contraction, it is still running above the zero axis as a whole, indicating that market momentum is still strong. In terms of operational thinking, we continue to maintain the bullish thinking. The key support is the 4000-3985 area. As long as this range is not effectively broken, short-term pullbacks are regarded as low-long opportunities. If the price effectively falls below the 3980 line, it means that the short-term bullish structure is destroyed and the market may enter a phased adjustment. The 4050-4060 area above is an important pressure zone. If the market encounters resistance and pressure again at this position, you can try to short gold with a light position in the short term. The target can first look at the 4020-4000 area. However, it should be noted that this short order is only a short-term gaming idea. Be sure to strictly control the position and take profit and stop loss, and do not blindly chase the short position. If the gold price can continue to break through and stabilize above 4060 in large volume, the upside space will be further opened, with the target pointing to the 4100 mark or even higher levels. Overall, the gold trend remains healthy, and a short-term pullback will not change the medium-term upward trend. The core of stable trading lies in rhythm and execution. Although the market is advancing in volatility, the direction remains clear. Be patient, strictly implement the plan, and wait for the market to give another opportunity for certainty. If there are structural changes in the subsequent market, I will update the strategy and synchronize it with you as soon as possible.
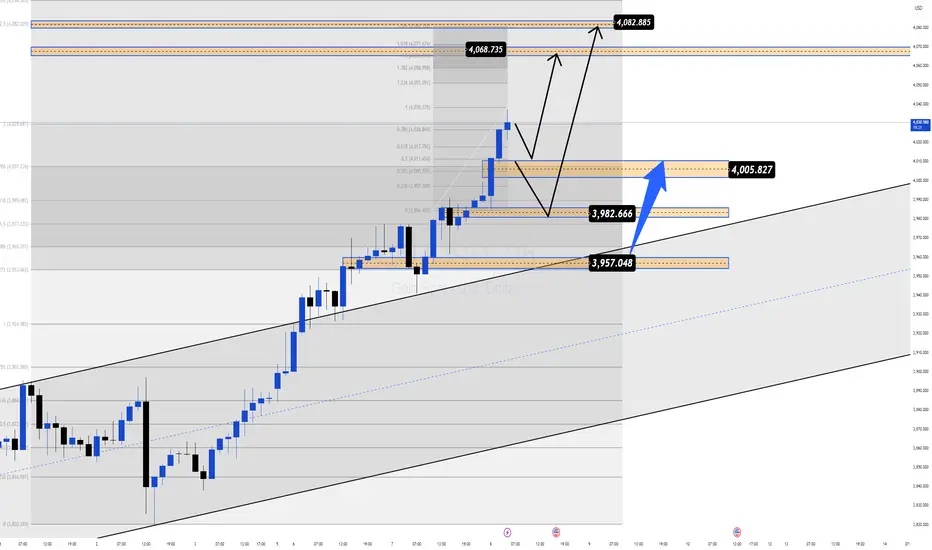
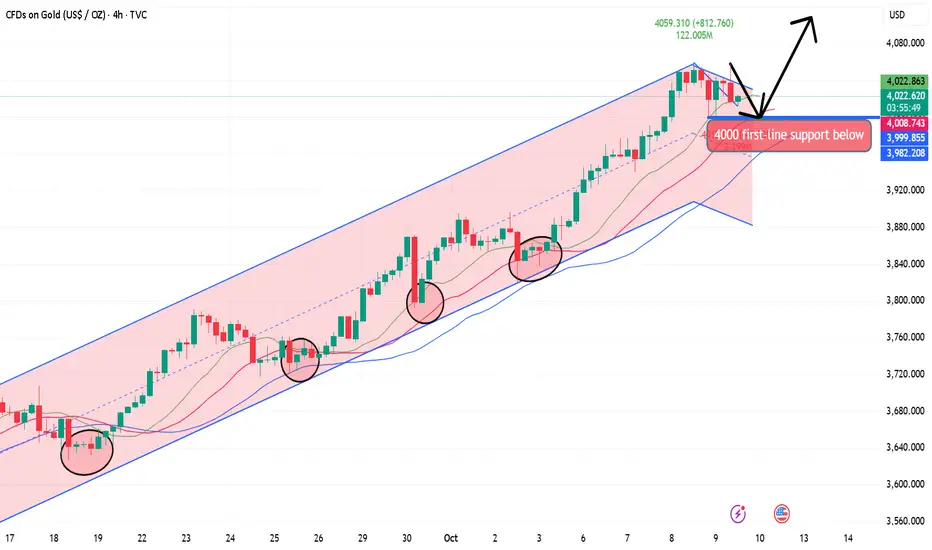
Unstoppable Uptrend as Gold Benefits from Fed Easing📊 Market Context
Gold continues to hold its strong uptrend amid political and economic uncertainty in the US. The government shutdown has now entered its second week with no resolution in sight, fueling further concerns about the impact on US economic performance.
At the same time, the Federal Reserve has entered an easing cycle since September, with expectations of additional 25 bps rate cuts in both October and December – a clear bullish driver for non-yielding gold.
According to the World Gold Council (WGC), gold-backed ETFs have recorded $64 billion in inflows this year, with September marking the largest monthly increase in over three years – a strong signal of booming safe-haven demand.
Not only investors, but global central banks also remain active buyers, adding 15 tons to reserves, showing a clear shift away from reliance on US debt.
All these factors combined continue to reinforce the long-term bullish trend, opening up opportunities for strategic BUY setups.
🔎 Technical Analysis (H1/H4)
Price action remains within an upward channel, repeatedly retesting and bouncing from support.
Buy Scalp Zone 4004–4002: quick reaction zone for short-term entries.
Main Buy Zone 3986–3984: strong support aligned with FVG.
Key resistance target: 4068–4082 (Liquidity Zone).
📈 Trading Plan
✅ BUY SCALP: 4004–4002
SL: 3996
TP: 4008 - 4012 - 4016 - 4020 - 4030 - 4040 - ????
✅ BUY ZONE: 3986–3984
SL: 3980
TP: 3990 - 3995 - 4000 - 4010 - 4020 - 4030 - 4040 - ????
⚠️ Risk Management Notes
The 4000 level is a key psychological resistance – watch for potential liquidity sweeps.
Only enter trades with clear price action confirmation at BUY zones.
Adjust position sizing carefully, as volatility could spike with political headlines and Fed-related updates.
✅ Summary
Gold’s bullish momentum remains intact, supported by US political uncertainty, Fed easing, record ETF inflows, and continued central bank accumulation. Strategy remains BUY at 4004–4002 and 3986–3984, aiming for targets toward 4068–4082.