Bulls Reloading After a Healthy Pullback | Next Target: 4090+ 📊 Market Context
After a powerful bullish rally that pushed gold to record highs, XAUUSD retraced about 1% on Thursday as traders took profit from the recent surge. However, this move appears to be a technical correction, not a trend reversal — as indicators have shown overbought conditions for several sessions.
Despite this short-term pullback, the long-term uptrend remains intact.
Gold is up more than 50% year-to-date, driven by:
🌍 Ongoing geopolitical and trade tensions,
💰 The Federal Reserve’s monetary easing cycle,
🏦 Record central bank gold accumulation,
⚔️ Rising global uncertainty, fueling strong safe-haven demand.
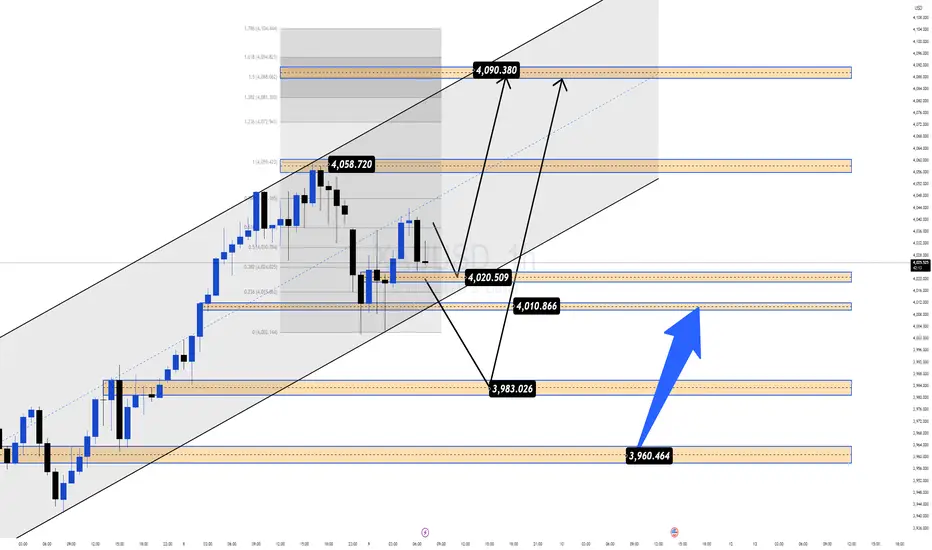
Overall, this retracement could be an ideal setup for BUY re-entries, as bulls look to reload positions toward the 4090–4100 liquidity zone.
🔎 Technical Analysis (H1/H4)
Price remains inside the medium-term bullish channel, showing strong reactions around 4000–3980 support.
4010–4008 acts as a quick scalp zone for short-term entries.
3984–3982 serves as a key structural support and liquidity reaction area.
4090–4092 (Liquidity Sell Zone) stands as the major resistance — potential liquidity trap area.
📈 Trading Plan
✅ BUY SCALP: 4010–4008
SL: 4002
TP: 4015 - 4020 - 4030 - 4040 - 4050 - ????
✅ BUY ZONE: 3984–3982
SL: 3978
TP: 3990 - 3995 - 4000 - 4005 - 4010 - 4020 - ????
✅ SELL ZONE: 4090–4092
SL: 4098
TP: 4085 - 4080 - 4070 - 4060 - 4050 - ????
⚠️ Risk Management Notes
The 4000 level remains a strong psychological and structural support — only enter long positions with confirmed price action signals.
Be cautious around 4090–4100, where liquidity sweeps and false breakouts are likely.
Adjust position size properly to manage volatility during high-impact news or geopolitical updates.
✅ Summary
Gold is undergoing a healthy correction phase within its broader uptrend.
The strategy remains BUY-focused at 4010–4008 and 3984–3982,
with upside targets toward 4060–4090,
and a potential short-term SELL opportunity near 4090–4092 if rejection signals appear.
💡 MMFLOW TRADING – Trade with market structure, follow liquidity, and ride the BIGWIN setups!
Goldtradingstrategy
10.9 Gold Short-term Intraday Operation Guide!!!Technical Analysis:
The 4-hour chart shows support at the middle line and near the MA30 moving average, corresponding to 3986 and 3947, respectively. The Bollinger Bands have also begun to narrow, indicating a volatile, compressed, and retest pattern in the 4-hour chart. Focus is currently on the upward pressure of 4032, near the MA5 moving average.
The 3-hour chart saw a rapid drop to 4001 this morning before bottoming out near 4008 and rebounding to 4036. The MACD formed a dead cross with high volume, and the STO indicator is trading at a low level, indicating weak 4-hour volatility. The high point of the morning rebound, the middle line of the hourly chart, has become the current resistance point at 4036. Meanwhile, support between 3999 and 4000 is a key focus today.
On the daily chart, focus on yesterday's highs and lows, 4059, and 3984. For the daily chart to rise, it must not fall below yesterday's lows but must break above yesterday's highs. However, considering the current volatile decline in the 4-hour chart, it is obvious that it will be difficult to go up in the morning session, so 4032 and 4050-59 become today's shorting points; and for the time being, we will focus on the morning low of 4001 and yesterday's low of 3984.
GOLD|Surge: Targeting $4,100! Where to Buy Ahead of FOMC MinutesHello TradingView community! 🚀
Gold (XAU/USD) continues to demonstrate incredible strength, consistently breaking past old highs and forming a solid upward price channel. This robust rally is not only technically reinforced but is also awaiting a potential catalyst from today's crucial fundamental news.
In this analysis, we will combine two key perspectives: a deep dive into the technical chart to identify optimal entry points, and an examination of the main fundamental event that could significantly impact Gold prices during the US session.
1. Fundamental Perspective: All Eyes on FOMC Minutes
Today's market highlight, Wednesday, October 8, is the release of the FOMC Meeting Minutes at 2:00 PM ET.
Why does this matter? The minutes provide a detailed record of the Federal Reserve's most recent policy meeting in September. Traders will scrutinize the text for any hints about the future interest rate path.
Potential scenarios:
"Dovish" Tone: If the minutes reveal that FED officials are concerned about economic growth and open to further rate cuts, the US Dollar may weaken. This would create a strong push for Gold (XAU/USD), potentially fueling the next price surge.
"Hawkish" Tone: If the minutes emphasize that inflation remains a concern and the FED is not in a hurry to cut rates, the USD may see a short-term recovery, causing Gold to have a corrective dip.
This event is a top catalyst for volatility. Our strategy is to prepare technical zones to capitalize on the market's reaction.
2. Technical Analysis: Detailed Trading Plan
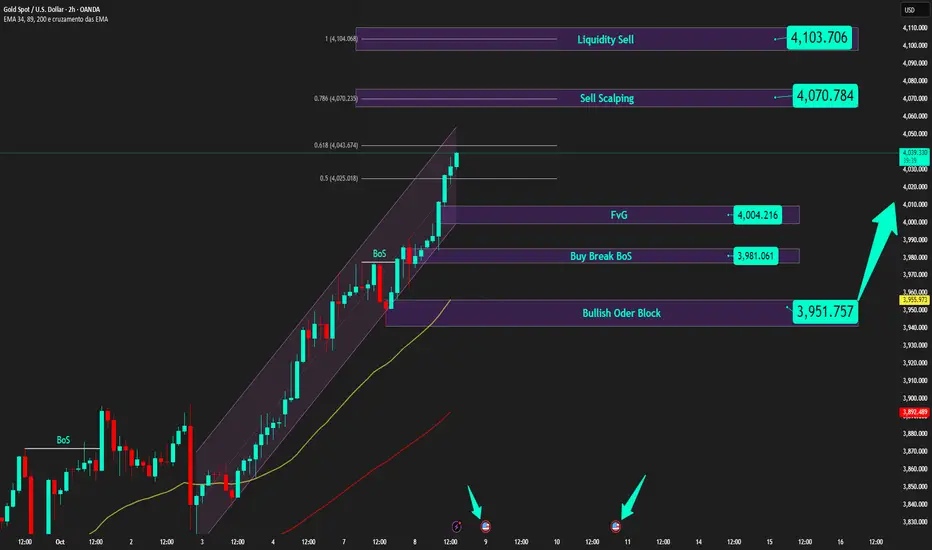
The bullish structure on the 2H timeframe is undeniable. Prices are creating a series of higher highs, confirmed by each "BoS" (Break of Structure), signaling that the Buyers are in full control. Here are the key zones to watch:
Potential Buying Zones (Key Points):
FVG Zone ($4,004): The nearest support is this Fair Value Gap, an area of price imbalance that the market often seeks to fill. Prices may retest this area before or during the news release.
"Buy Break BoS" Zone ($3,981): This is the most recent swing high that has been broken. It has now turned from resistance into a crucial support level. This zone provides a solid entry point if prices correct a bit deeper.
"Bullish Order Block" Zone ($3,951): This is the last major "stronghold" of the Buyers—a strong buy order block that initiated the latest push wave. This is an ideal area to look for buy orders if the market makes a strong liquidity sweep downward.
Upside Targets:
Short-term target (Scalping): $4,070 - This level coincides with the 0.786 Fibonacci level.
Main target: "Liquidity Sell" Zone at $4,103. This is a large "liquidity pool" where the Sell side's stop-loss orders are likely concentrated. Smart money often drives prices towards such areas.
Strategy Summary
Main trend: Bullish.
Core strategy: Look for "Buy the dip" opportunities at the key support zones mentioned.
Critical timing: Be cautious around the FOMC Minutes release (18:00 UTC). Volatility can be high, and the market may whip in both directions to sweep stop-losses before following the main direction.
Pro tip: Patience is key. Waiting for prices to pull back to a confirmed support zone will provide a much better Risk/Reward ratio than chasing the market at the highs.
WHAT'S YOUR TAKE?
How do you think Gold will react to today's FOMC minutes? And where are you looking to place your buy orders—at the FVG zone $4,004, the BoS level $3,981, or are you patiently waiting for the Order Block $3,951?
Share your thoughts in the comments below!
👇 Don't forget to leave a Like 👍 and Follow the channel for the latest XAU/USD analyses!
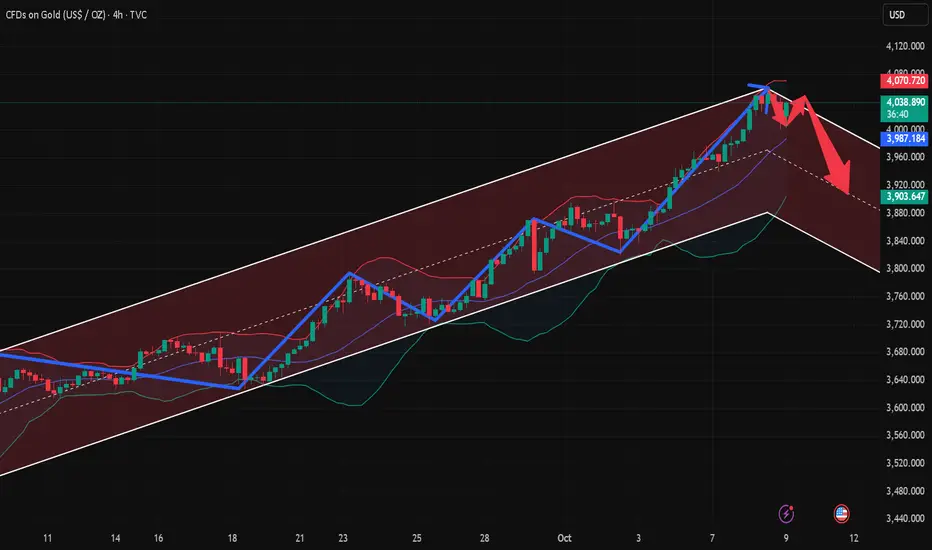
Volatility = Opportunity—Short Gold Now!Although gold is still maintaining a bullish trend, it has repeatedly fallen back to around 4030 after approaching or touching the 4050-4060 area many times, and has shown multiple high points with upper shadows in the candlestick chart. It can be clearly seen that after accelerating its rise, gold showed obvious signs of stagflation near the trend line resistance area of 4050-4060, and there were obvious signs of retracement after touching this resistance area.
In addition, from the short-term structure, we can see that the current high is near 4059, and the left high is near 4050. If gold cannot effectively hold above 4050 during the next rebound, there will be signs of forming a head and shoulders top in the short term. Combined with technical divergence and overbought conditions, gold may usher in a good retracement in the short term. Combined with technical divergence and overbought conditions, gold could experience a significant pullback in the near term. We should first focus on the support below at 4030-4020, followed by 4000-3990.
So in short-term trading, I still will not give up short trading to gain short-term retracement profits. Therefore, I still advocate considering shorting gold in the 4045-4055 area. As long as gold can effectively fall below 4030, it will inevitably continue its downward trend to the 4010-4000 area.

How to correctly grasp the gold trading opportunitiesGold is still maintaining a bullish rhythm, the daily structure is stable, and the bullish trend has not been destroyed. Although it is slightly tired after the continuous rise, there is no obvious peaking signal yet. The hourly chart is still an oscillating upward structure. There is buying every time it falls back, indicating that the bullish force in the market is still dominant. From the four-hour cycle, the moving average system maintains a bullish arrangement, and the price runs above the moving average of each cycle. Although the RSI has entered the overbought range and there is a need for a short-term correction, the overall trend is still strong. The upper 4050-4060 area is the key pressure zone. If it can effectively break through and stand firm, the upper space will be further opened. We recommend that you continue to prioritize buying on pullbacks. Short-term support is in the 4020-4010 area, with stronger defense near the 4000 mark. As long as it stabilizes, there is still an opportunity for bulls. However, we should also be aware that after the continuous rise in gold, there is a possibility of a short-term correction. Aggressive investors can continue to consider shorting with a light position near 4060, with the initial target of 4030-4020-4010. Be sure to control risks, and shorting is only a supplementary strategy. Next, focus on US fiscal dynamics and Federal Reserve policy signals. These news factors will directly affect the short-term fluctuation rhythm of gold. Conservative investors should wait for support confirmation before entering the market, while aggressive investors should gamble with a light position and respond flexibly.

The US market fluctuates at a high level, and long orders fall bGold prices continued to fluctuate at high levels in the early stages of the U.S. trading session on Wednesday (October 8), with the potential for further gains. At the same time, the current price increase has already reached a large extent. Pursuing long positions at the current price is not the best opportunity. Waiting for a pullback to trade long positions at support points, with small stop-loss orders and a large expected profit range, spot gold broke through the $4,000 mark during the day, reaching a record high of $4,049.43 before retreating slightly. The current rise in gold prices is driven by strong safe-haven demand, driven by factors including the U.S. government shutdown, falling Treasury yields, and political turmoil in Europe and Japan.
Golden opportunity has arrivedGold has continued its strong upward momentum since breaking through the 4000 mark, reaching a high of around 4049. The market has hardly made any decent corrections, market sentiment has continued to be high, and bullish confidence has been infinitely magnified. However, the more emotional the stage is, the more we need to remain calm and rational. Structurally, gold has entered the end of an accelerated upward trend, and short-term indicators are obviously overbought. Although prices have hit new highs, momentum has not increased simultaneously, and there are signs of slight divergence, indicating that the upper space is gradually narrowing. Combined with the 4-hour structure, the 4050-4060 area is a period of strong pressure, and it may face a technical correction in the short term. In terms of operational thinking, you can consider shorting with a light position in the 4050-4060 area, and first target the 4020-4000 area. Conservative people can wait for the confirmation of the pullback before participating, and do not blindly chase the long position. Although gold is strong at present, it is not a mindless rise stage. The larger the bullish space, the deeper the adjustment will often be. At this time, risk control should be the core and planning should be the basis. Short-term short positions should only participate in structural corrections, and should not make impulsive trades that blindly fight against the trend. Steady execution, position control, and maintaining rhythm are the key to remaining invincible in extreme markets.If your recent operations are not ideal, or you are confused about how to grasp the rhythm, you are welcome to communicate with me at any time. I hope I can help you avoid detours and steadily improve your trading thinking and execution.

Gold’s Swings Offer Bears a Profitable EdgeGold has currently reached a high of around 4050, but after reaching this area, the upward trend has been suppressed, and the upward momentum has weakened. Gold needs to retreat in the short term. Gold is currently under pressure in the 4050-4060 area. If gold shows obvious signs of stagflation in this area, then gold may usher in a good pullback at any time.
However, because gold is currently in a strong upward trend, its structure and form are in an obvious bullish trend. Therefore, even if the gold market pulls back, the pullback is not expected to be too large in the short term. We should first focus on the support area below, 4000-3990.
Therefore, in volatile markets, even if gold is in a strong bullish trend, gold shorts still have good profit opportunities due to volatility. So in the short term, we can consider trying to short gold in the 4050-4060 area, first aiming at the target area: 4010-4000 area.
If you're short gold like me, we must be among the first to reap the benefits of a market correction. If you'd like to continue following my trading strategies and signals, be sure to follow me!

When the market is crazy, staying calm is the biggest advantage!Since the US government shutdown, the gold market has completely lost its disguise and continues to rise without any decent technical pullback. The current market sentiment is high and the bulls are fully dominant. Even the 4,000 mark has failed to form an effective suppression. In the short term, if we want to see a significant correction, we can only hope that the US government will resume operations. Otherwise, the gold price may still maintain a strong upward rhythm. The current upward momentum even exceeds the market intensity in some war stages. From a technical perspective, in the short term, pay attention to the pressure of 4030 and 4050 levels. If there are signs of resistance to rising, try short-selling with a light position, strictly control risks, and flexibly stop profit; the support below focuses on the 4000-3990 area. Once it stabilizes effectively, it is still expected to continue to rise. Today's market has long broken the inherent thinking of not chasing ups and downs in the past. Gold has entered a new cycle of letting itself go. The new gold era is strong and not afraid of highs. Brothers who are uncertain can communicate with me at any time, and I will give strategic guidance at the bottom as soon as possible.

10.8 Gold Daily Short-Term Operation Guide!!!In the 1-hour chart, the Asian session continues to rise with $3985 as support. A quick pullback would be an opportunity to buy in. Unless the Asian session decline continues in the European session and then in the US session, or if the Asian session breaks the bottom in the European session and fails to continue in the US session, don't try to bet on a pullback; instead, follow the trend.
Secondly, give up on speculating on the top. Currently, the strong upward trend remains unchanged on both the daily and 4-hour charts. Even after breaking through $4000 in the short term, there's still no sign of an end. While bullish, be wary of pullbacks. In other words, be prepared for a pullback and avoid chasing orders.
If the pullback approaches the $4000-3980 range, buy long. If the European session's strength doesn't offer opportunities, and there are further pullbacks before the US market opens, keep an eye on $4030-4050.
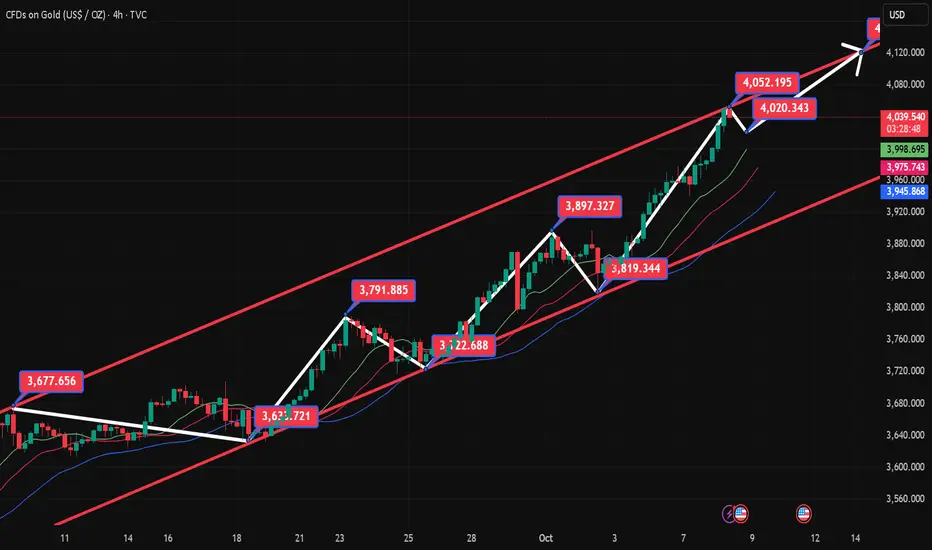
Pullback Imminent—Bulls Beware, $80 Risk LoomsGold continues to maintain its strong position and has reached the level around 4000 as expected during the upward process. According to the current structure, the level around 4000 may not be the market top, and there is still room for further growth. However, the market's expected targets have been achieved in the short term, and gold may experience a phased pullback after making a series of false breakthroughs.
Looking back at history, every time gold faces an area near an integer mark, it will usher in a good wave of pullback. Gold has experienced a $70-80 pullback around the 3700, 3800, and 3900 levels. Based on this, even if gold starts to pull back $70-80 from 4020, it could potentially retreat to the 3950-3940 range in the short term.
Based on its trend, gold began its upward trend around 3820 and has currently reached a high of around 4014, with a fluctuation of $194. Based on previous trend-based gains and fluctuations, gold could experience a pullback at any time.
Therefore, in terms of short-term trading, we do not advocate aggressive chasing of high levels for the time being. We can consider going long on gold after gold retreats to the 3970-3950 area depending on the market performance; of course, we can consider starting to short gold in the current area of 4015-4025. Short positions are only for short-term trading and are not suitable for long-term trading at the moment!

10.7 The bullish trend of gold remains unchanged! Follow the treCurrent Market:
1: Technical Analysis - The bullish trend remains unchanged, so follow the trend. Trading Methods - Follow sideways trading and pullbacks! Avoid headwinds and avoid heavily shorting! Focus on following the trend!
2: Fundamentals - The probability of an October Fed rate cut continues to increase! The Russo-Ukrainian war remains stalemated! The outlook for the Middle East remains uncertain! Global central banks continue to increase their gold holdings! The overall fundamental environment is bullish for gold.
To sum up: From both a technical and fundamental perspective, gold is primarily bullish!
US Trading Timeframe:
1: 1-hour trading, sideways resistance at high levels, with support near 3940; the Stochastic and MACD lines are temporarily blunting!
2: 4-hour trading, the Stochastic has formed a death cross, and the MACD lines are blunting! From a morphological perspective, the short-term top-bottom reversal support level is around 3940.
3: In the daily K-line, the stochastic indicator blunted and retraced to a golden cross, signaling a bullish trend. The MACD double lines continued to cross upward, indicating a bullish trend.

Pullback Alert: Gold Feeling the Heat at 4000As expected, gold continued to rise to the 3985-3995 area, reaching a high of around 3991, just a hair away from 4000. According to my calculations, the current resistance area of gold is located in the 3985-3995 area (for the specific calculation process, please refer to the previous trading idea). Therefore, I believe that within this range, we can begin to test the top and short gold.
Moreover, from the short-term performance, although gold still maintains a bullish trend, the short-term rise has been suppressed and the recent rise has weakened. Moreover, after the continuous rise in gold prices, the risk of chasing the rise has increased significantly. We must be cautious about the current rise and guard against signs of profit-taking at market highs. Moreover, gold has repeatedly reached highs in the 3980-3990 area. Repeatedly reaching highs in a limited area is likely to mean that gold will usher in a wave of irreversible pullbacks in the short term.
In addition, we need to focus on the area near 3960. If gold can still stay above 3960 during repeated pullbacks, then gold will still maintain its current strong position, or at least maintain high-level fluctuations; if gold falls below the area near 3960 during the pullback, then gold may continue the pullback trend and is expected to continue to 3930, or even around 3900.
So for the current short-term trading, I think the time is ripe to short gold, and I have already shorted gold according to the above trading plan. Now I just need to wait patiently for gold to pull back and make a substantial profit!

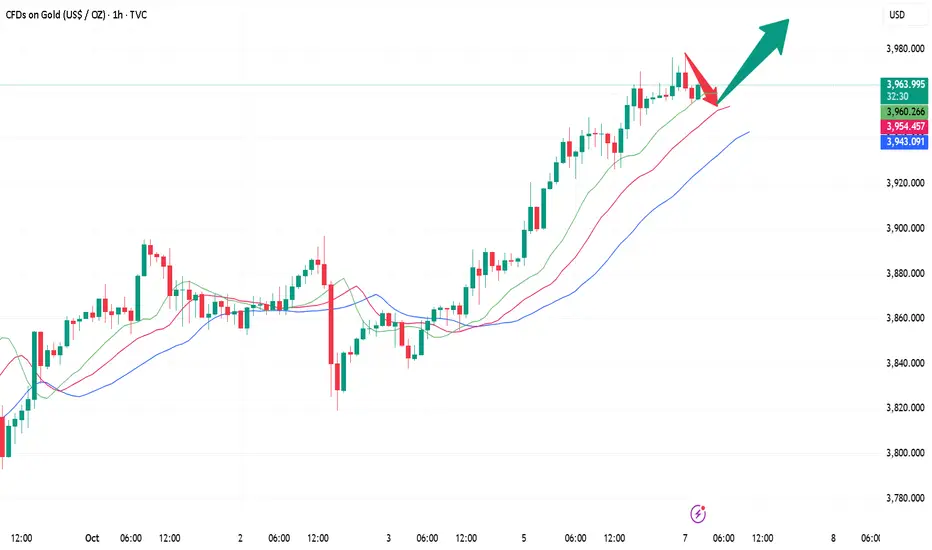
Gold is rising as expected, with the US market eyeing 4000!!!After gold retreated to around 3940, it began to rally. The strategy for the future remains to buy on dips. Short-term long positions near 3942 can be reduced, with a target of 3980 still in sight. Be mindful of the risks. Short-term investors can consider buying around 3954, with a stop-loss at 3946, and targeting a range between 3980 and 4000. Be mindful of the risks.
October 7th US Gold Trading: For those holding positions near 3942, reduce positions and hold with a profit and loss at 3946. Target resistance near 3980, and a breakout to 4000.
Short-term investors can consider buying further near 3954, with a stop-loss at 3946 and a profit target of 3980-4000. Be mindful of the risks.
4000 in Sight, But the Pressure’s On—Pullback Ahead?It is obvious that gold is currently in a very strong bullish trend. As far as the current market is concerned, there are not many reference points above. In the short term, perhaps only the 4000 mark is worth paying attention to. However, it should be emphasized that when market sentiment is high and gold prices continue to rise, volatility may increase significantly and the risk of chasing the rise will increase significantly. From the current perspective, the short-term upward trend has been suppressed, and there is obvious pressure near the 3980 level. Therefore, we must be cautious about the current rise and guard against signs of profit-taking at market highs.
After the strong rise in gold, the current short-term support is obviously in the 3935-3925 area, followed by the 3905-3895 area. If gold cannot effectively fall below these two key support areas, gold will continue to maintain its current strong bullish trend; in addition, we can infer the current resistance area from volatility.
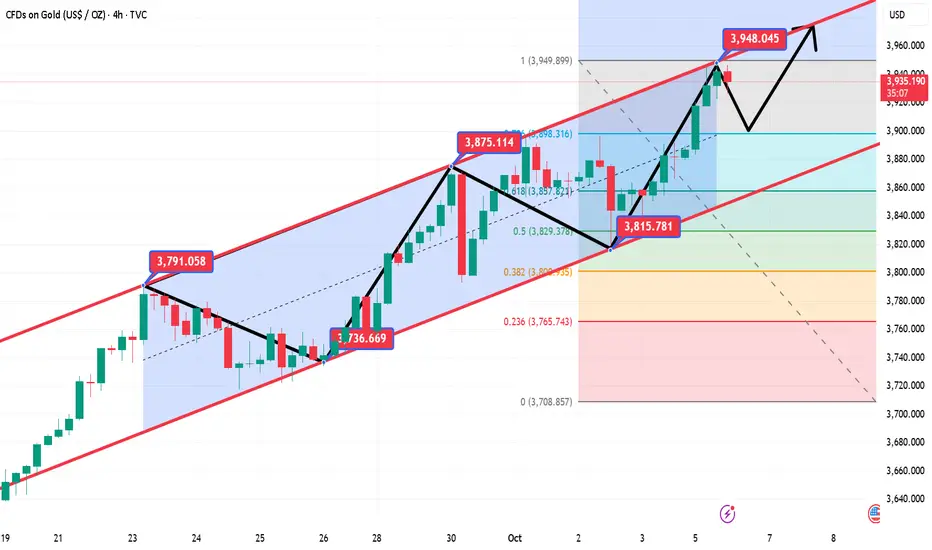
1. First Wave: Gold rose from around 3628 to around 3791, a fluctuation of nearly $165.
2. Second Wave: Gold rose from around 3718 to around 3895, a fluctuation of nearly $175.
3. Current Wave: Gold began its rise from around 3819. Extrapolating upward by $165-175, the resistance area for this phase is 3985-3995.
Therefore, it can be inferred that the short-term resistance at the current stage is in the 3985-3995 area. If the gold market cannot provide a suitable entry position to execute a long trade, then we can consider shorting gold with the 3985-3995 area as resistance; under appropriate circumstances, we can even consider entering the market early to short gold, first targeting the short-term retracement target: 3945-3935 area.

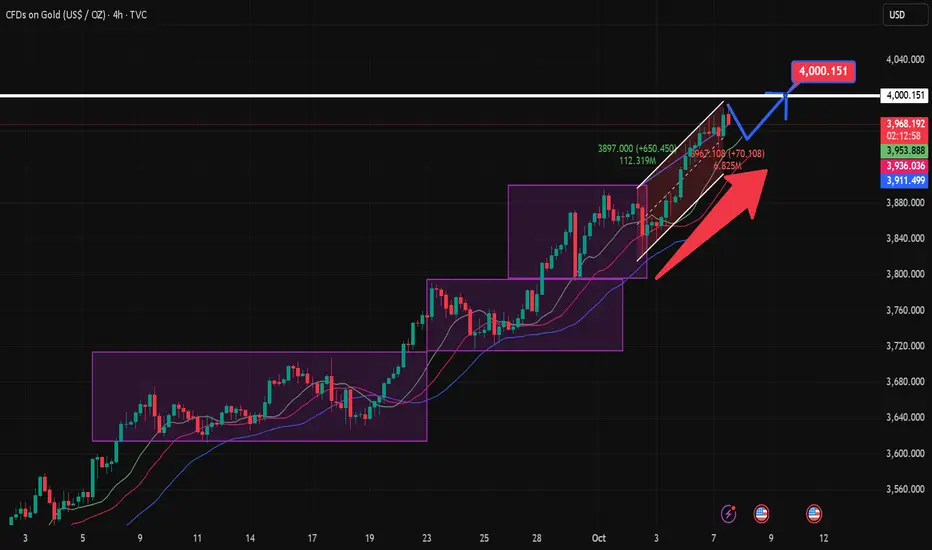
Gold Nears $4000, BofA Warns of Mid-Cycle Correction 🚀 XAUUSD – Daily Trading Plan| MMFLOW TRADING
📊 Market Context
Gold is pushing toward the $4,000/oz milestone, but a fresh warning from Bank of America has traders on alert. Strategist Paul Ciana points out that gold is currently trading 20% above its 200-day moving average — a level that historically preceded sharp corrections (2008, 2011, 2020, 2022).
That said, mid-term forecasts from Goldman Sachs, UBS, and even BofA still project gold could reach $4,200–$4,900/oz in the coming year. The long-term bullish trend remains intact, but in the short term, the risk of sudden corrections is high as the market shakes out FOMO-driven buying pressure.
🔎 Technical Analysis (H1/H4)
Price is consolidating near the ATH Zone and major liquidity levels around 3990–4000.
Buy Zone: 3935–3933 (CP zone & FVG reaction) – attractive area to reload long positions.
Sell Zone: 3993–3995 (Liquidity Zone) – a potential trap area as gold tests the $4000 psychological mark.
🔑 Key Levels
BUY Zones: 3935–3933, with main support at 3910.
SELL Zone: 3993–3995 (watch liquidity reaction).
Psychological resistance: 4000.
📈 Trading Scenarios & Plan
✅ BUY ZONE 1: 3935–3933
SL: 3927
TP: 3940 - 3945 - 3950 - 3960 - 3970 - 3980 - ???
✅ SELL ZONE: 3993–3995
SL: 4000
TP: 3988 - 3984 - 3980 - 3970 - 3960 - ???
⚠️ Risk Management Notes
The 3990–4000 zone is a heavy liquidity cluster — expect false breakouts before reversals.
Only enter trades with clear price action confirmation; avoid chasing FOMO near the highs.
Adjust position sizing carefully, as volatility may spike while markets debate the risk of a “mid-cycle correction.”
✅ Summary
Gold remains in a long-term bullish trend, but traders must respect short-term risks. MMFLOW prioritises buys at 3935–3933 while keeping a cautious eye on the 3993–3995 sell zone near the $4000 mark. Upside targets point toward 3980+, with potential for higher extensions if momentum holds.
📢 Stay tuned with MMFLOW TRADING for real-time updates and BIGWIN setups as gold tests historic highs!
10.7 Gold Intraday Short-Term Operation Guide!!!Gold typically enters a correction phase on Tuesday after a strong rally on Monday. Maintain a bullish outlook for the day, with the primary support area being the 3955-60 range (which encompasses the early morning low, opening price, and high trading volume). Bulls are expected to mount a counterattack here. Today's market will not simply replicate Monday's unilateral surge, but will likely exhibit a pattern of "high-level fluctuations, false breakouts, and subsequent declines, followed by a test of the bottom and subsequent upward movement." Trading strategies should be abandoned in favor of buying at the bottom of the market fluctuations.
XAUUSD | Sustainable Price Rise: Where’s the Next Optimal Entry?Hello TradingView community! 🚀
Gold (XAU/USD) is in an extremely sustainable upward structure. Instead of lengthy analysis, let's dive straight into the action plan: Where is the optimal entry point and what target is Gold aiming for? Check out the details below.
1. Market Structure Analysis: The Strength of the Bulls 🐂
Looking at the chart, the first thing that catches our eye is a series of "BoS" points (Break of Structure).
Every time Gold breaks a previous peak, it not only creates a Higher High but also confirms that the uptrend is very strong and sustainable. This indicates that buying power is completely dominant and shows no signs of weakening. Smart Money is continuously pushing the price higher, and our job is to ride this "wave."
2. Potential Buying Zones - Where to Catch the Wave? 🧐
To optimize profits and minimize risks, finding a beautiful entry point after a price correction is crucial. Based on the chart, we have 2 notable potential buying zones:
Buying Zone 1 - Fibonacci Confluence ($3885): This is an extremely ideal "Buy Zone," coinciding with the golden Fibonacci ratio of 0.618. In technical analysis, this is a very strong support level where prices tend to reverse and continue the main trend. Professional traders always hunt for pullbacks to this zone.
Buying Zone 2 - Exploiting FVG ($3914 - $3933): Slightly higher, we have the FVG (Fair Value Gap) area at $3914 and the "Buy Scalping" zone at $3933. These are "price gaps" created by supply-demand imbalances when prices rise too quickly. The market tends to return to fill these gaps before continuing its journey. This could be an opportunity for those wanting to catch an earlier wave.
3. Conquest Target - What's Gold's Next Destination? 🎯
Once we have a buying position, where will our target be?
Short-term target: The "Sell Scalping FVG" zone around $3969 could be a minor resistance point where some traders will take profits.
Main target: The ultimate destination this structure is aiming for is the "Sell Gold Liquidity" zone at $3998. This is a critical "liquidity" area, concentrating many stop-loss orders from the Sellers. Prices are often attracted to these zones like a "magnet" to sweep liquidity before making further moves.
Summary & Advice
Main trend: UP.
Primary strategy: Buy on dip when prices correct to key support zones.
Potential buying zones: $3885 (Fibonacci) and $3914 - $3933 (FVG).
Price targets: $3969 (short-term) and $3998 (main target).
Always remember, risk management is the key to surviving in the market. Set reasonable Stop-loss for every trade.
WHAT DO YOU THINK ABOUT THIS PLAN?
Will Gold retrace to the Fibonacci zone $3885 or react right at the FVG zone $3914? Leave your thoughts and perspectives in the comments below. Let's discuss together to find the best opportunities!
👇 Don't forget to Like 👍 and Follow my TradingView channel to not miss daily Gold analysis!

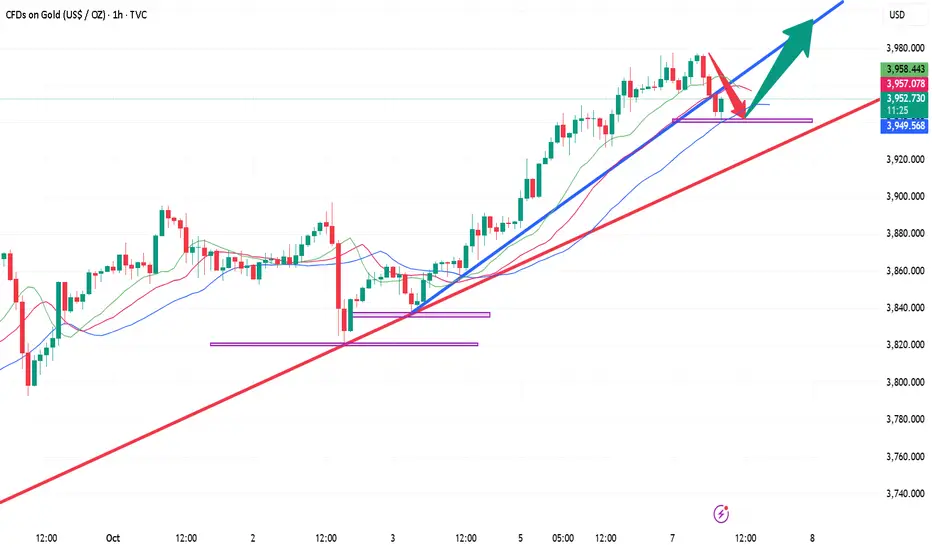
10.7 Gold has no ceiling!!!The one-hour pattern of gold, the golden cross of the moving average continues to radiate upward, maintaining strong bullish momentum. Pay attention to the short-term support below 3930-3920, which was the springboard for gold to accelerate yesterday. The upper resistance level should focus on the 3980 line. Every time the gold price reaches a new high, it will fall back to accumulate power. Just remember not to chase highs. For intraday operations, we can continue to maintain low-long participation!
Smart Money Strategy: Short Now, Go Long LaterAs I expected, gold touched around 3950 during the rise. According to the current structure, gold is currently in a very strong bullish trend, the market has a strong bullish consensus, and gold still has room to continue to rise. If gold can break through 3950 during the rise, it may open up space to higher levels.
However, it should be emphasized that when market sentiment is high and gold prices continue to rise, volatility may increase significantly and the risk of chasing the rise will increase significantly. From the current perspective, the short-term upward trend has been suppressed, and there is obvious pressure near the 3950 level, so gold may show signs of pullback in the short term.
To be honest, although gold prices have risen sharply, there have not been many opportunities to enter the market and go long on gold during the rise. So I have already shorted gold in the 3930-3950 area according to the previous trading strategy. First aim for the retracement target: 3920-3910 area.

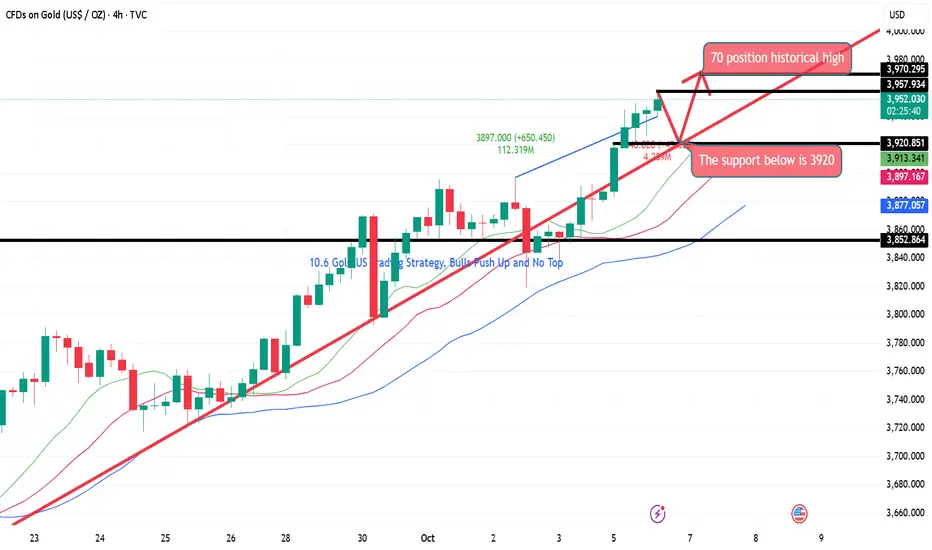
10.6 Gold US Trading Strategy, Bulls Push Up and No TopLooking at the 4-hour market trend, we are watching for short-term support at 3920, with a focus on the 3895-3900 support level. The bulls are rising strongly and there is no end in sight. Trading strategies should focus on buying on pullbacks. For intermediate positions, we should be cautious in chasing orders and patiently wait for key entry points. I will provide detailed trading strategies during the trading session, so please pay attention.
10.6 Gold's callback is small and it may continue to riseAfter breaking through a previous resistance zone on the 4-hour chart, gold is continuing its upward trend along its short-term moving average. Intraday pullbacks have been mild and sustained, and there are still no signs of a peak in the short term. On the hourly chart, after a surge, gold is maintaining a high-level correction, but recent high-level corrections have ultimately evolved into secondary gains, and today's pullbacks were not significant. On the short-term chart, the candlestick chart is gradually coming under pressure, maintaining a weak trend along the short-term moving average. Some short-term correction is possible. If the correction in the US market is not significant, it may even rebound to the current price after a minor correction. Further upward movement is expected after the open!!!
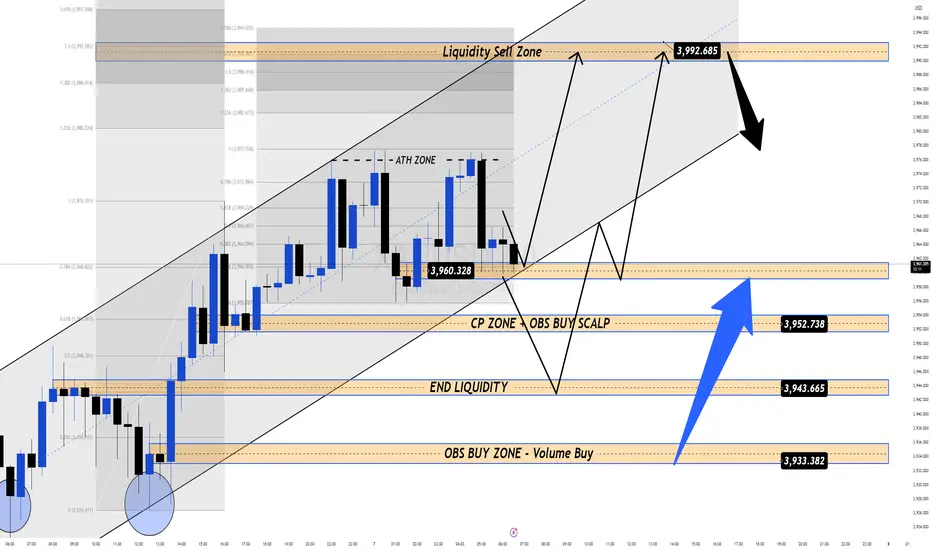
Gold Breaks $3900: Safe-Haven Demand Soars & Fed Fuels the Rally📊 Market Context
Gold has smashed through the psychological $3,900 barrier, reaffirming its dominance as the ultimate safe-haven asset.
US government shutdown → drives defensive capital flow into gold.
Fed expected to cut rates by 0.25bps → further strengthens gold’s appeal as a non-yielding asset.
Data gap due to the shutdown → traders now rely on private reports, adding uncertainty and keeping gold in the spotlight.
👉 With the USD under pressure, capital fleeing risky assets, and FOMO from buyers intensifying, gold is well-positioned to target the 3950–3990 zone in the short term.
🔎 Technical Analysis (H1/H4)
Primary trend: Strong uptrend, price holding above the ascending channel.
BUY ZONE 1: 3904–3902 → CP Volume Zone, strong support for continuation.
BUY ZONE 2: 3885–3883 → Retest of old ATH breakout zone.
SELL Zone: 3949–3950 → Liquidity Zone, possible false breakout/trap.
Extended Target: 3994 (Fib 3.618).
🔑 Key Levels
BUY Zones: 3904–3902, 3885–3883
SELL Zone: 3949–3950
Resistance: 3950, 3994
Support: 3900, 3880
📈 Scenarios & Trading Plan
✅ BUY ZONE 1: 3904–3902
SL: 3898
TP: 3910 - 3915 - 3925 - 3935 - 3945 - ???
✅ BUY ZONE 2: 3885–3883
SL: 3878
TP: 3895 - 3905 - 3920 - 3935 - 3945 - ???
⚠️ SELL ZONE (scalp/trap): 3949–3950
SL: 3955
TP: 3940 - 3935 - 3925 - ???
⚠️ Risk Management Notes
Price may sweep liquidity above 3950 before pulling back → wait for confirmation price action.
Avoid chasing highs – priority remains buying dips into key support zones.
Keep position sizing moderate ahead of unexpected Fed comments or policy shocks.
✅ Summary
Gold is in its “golden phase” of bullish momentum: political uncertainty + dovish Fed + safe-haven demand = BUY remains the core strategy. Preferred entries sit at 3904–3902 and 3885–3883, with upside potential stretching toward 3950–3990. Short-term SELL setups only valid as liquidity traps near resistance.
📢 Follow MMFLOW TRADING for real-time updates and BIGWIN setups every session!
