THE KOG REPORT In last week’s KOG Report we said we would be looking for price to support lower and then attempt the move higher monitoring the red box above which was active. It’s at that box we wanted to see a reaction, either a break or a RIP and as you can see, price did break upside hitting our daily and weekly targets as well as the red box targets.
So, what can we expect in the week ahead?
For the early part of the week we have the immediate support level at the 3870-65 region which lines up with the red box and is the level that needs to be broken to go lower. If we target this level in the early session and support, price may want to attempt a new all time high again, this time into the 3901 level and above that 3910-12. It’s that level of 3910-12 that needs to be monitored as a possibility of a RIP there can cause us to get a minor correction but as above, we need to break below 3865-70 to see a change in dynamic.
If we do break below that 3970 level and get a decent close, with a clear reversal, we can then look to target the lower levels 3855 and below that 3838 initially. I would like to see lower, but due to NFP this week instead of last week, we may continue to stretch upside or range up here before then getting a retracement into mean.
We’re going to leave it there and as usual we will update traders best we can during the week with the box targets and the analysis.
KOG’s bias for the week:
Bullish above 3840
Bearish on break of 3830
RED BOX TARGETS:
Break above 3890 for 3902, 3904, 3910, 3917, 3930 and 3933 in extension of the move
Break below 3868 for 3865, 3855, 3850, 3843, 3837 and 3830 in extension of the move
Please do support us by hitting the like button, leaving a comment, and giving us a follow. We’ve been doing this for a long time now providing traders with in-depth free analysis on Gold, so your likes and comments are very much appreciated.
As always, trade safe.
KOG
Goldtradingstrategy

Gold FOMO Surge – 1000-Pip Buy Chance Ahead!GOLD PLAN FOR 06.10 | Captain Vincent
✳️ Hello to all traders,
Today, we are not only analyzing Gold (XAU/USD) from a purely technical perspective ⚙️, but also witnessing the perfect confluence between technicals and fundamental news. A price surge storm is forming, promising exciting trading opportunities.
📊 1. Technical Analysis: Sustainable Uptrend Structure
Technically, the uptrend of Gold on the H1 frame is indisputable.
🔹 Break of Structure (BoS):
Gold continuously breaks previous highs, indicating that buying pressure is completely overwhelming.
Each BoS point is a clear affirmation of the strength of the uptrend.
🔹 Potential Demand Zone:
After each surge, the price often takes a "rest" to accumulate.
Currently, the price may adjust to the $3,883,020 - $3,905,169 zone, where the confluence between the Fair Value Gap (FVG) and Bullish Order Block (Bullish OB) – creates an ideal launchpad for the next surge.
🏦 2. Fundamental Analysis: The Fire Has Been Ignited
If technicals show the way, then fundamental news is the fuel propelling the uptrend.
🔸 U.S. Government Shutdown:
This event creates political and economic instability, causing capital to flee from risky assets.
Gold – the number 1 safe haven – is directly benefiting as investors seek to preserve assets.
🔸 Fed Ready to Cut Interest Rates:
The market is almost certain that the Fed will cut interest rates by 0.25%.
This reduces the appeal of the USD, further strengthening Gold's advantage, which is a non-interest-bearing asset.
🔸 "Thirst" for Economic Data:
The government shutdown also disrupts the release of important economic data, leaving the market lacking information and increasing uncertainty.
In this environment, Gold continues to maintain its role as a safe haven.
🎯 3. Comprehensive Trading Plan
When technicals and fundamentals align, the reliability of the trading strategy is significantly enhanced.
Strategy:
Wait to buy (Long) when the price adjusts to the demand zone $3,883,020 - $3,905,169.
Entry signals:
Observe confirmation of a bullish reversal in this zone such as:
Pin bar candles, engulfing
Or BoS on the M15 frame
Targets:
Short-term: $3950 – $3990
Long-term: Target “+1000 pips”
Risk management:
Place Stop Loss below the Bullish OB zone to protect the account.
🧭 Conclusion
The current market sentiment is very favorable for the Buyers:
USD is under downward pressure
Defensive capital flows strongly into Gold
The FOMO effect may stimulate an extended rally
The combination of solid technical structure and strong fundamental support is creating an almost perfect bullish picture.
👉 Be patient, stick to the plan, and await this golden opportunity.
💼 Wishing you all an effective and victorious trading day!

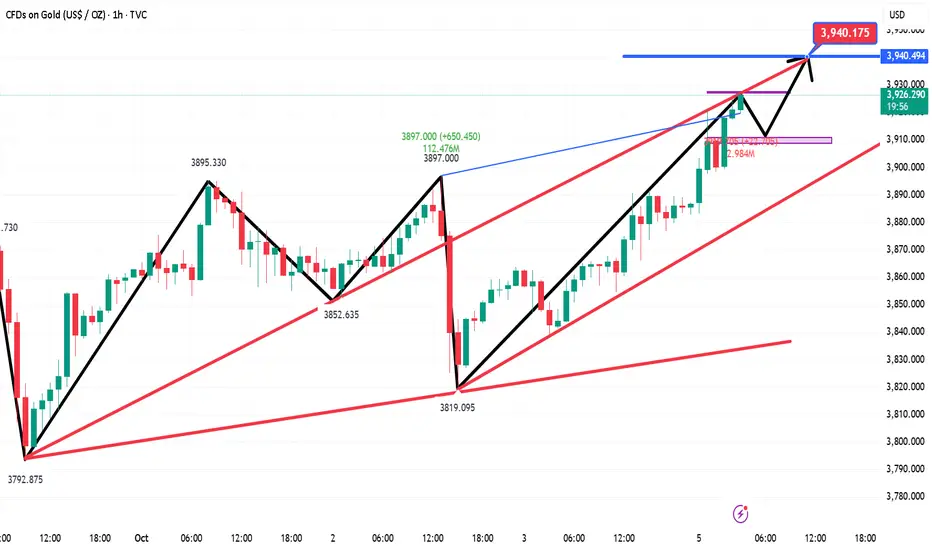
Bulls on Fire! The 4000 Challenge BeginsWhen summarizing the trading on Sunday, it was clearly pointed out that gold would inevitably hit 3900 or even 3930 this week. However, it was unexpected that gold had reached 3920 so early. Although it retreated slightly after reaching around 3920, according to the current structure and trend, the bull trend has not ended yet and there is still room for growth.
Since gold has once again broken through the recent high of 3895, the double top structure constructed in this horizontal area has become invalid and temporarily has no resistance effect. In fact, after the top and bottom conversion, this position area may play a supporting role to a certain extent in the future. As gold breaks through 3900, market bullish confidence may expand unprecedentedly, and the enthusiasm for buying will be pushed to another level. As the center of gravity of gold moves up, the current technical structural support has moved up to 3880-3870; and the strong support is located in the 3850-3840 area.
If gold cannot effectively fall below these two key support areas during the retracement. Gold will continue to maintain its bullish trend and continue its strong upward trend. It is even expected to continue to set new highs and reach around 3930 or even 3950. Once gold rises and breaks through 3950, the 4000 mark will follow!
So in terms of short-term trading, we can first try to start buying gold in small batches in the area around 3880-3870. After all, the entry price is relatively high, so we must control the lot of transactions and set up protection.
If you want to continue to follow and pay attention to my trading strategies and signals, be sure to follow me!

10.6 Gold falls back and continues to go longGold prices are currently moving out of a narrow range of highs on the daily chart. The K-line chart continues to maintain a relatively stable upward trend along the short-term moving average. Watch for any pullbacks on the daily chart to confirm a secondary upward trend. Focus on the support zone around 3900 in the short term. On the 4-hour chart, the price broke through the previous resistance zone, and the short-term moving average began to diverge upward, indicating a relatively strong short-term trend. On the hourly chart, the intraday pullbacks were neither strong nor prolonged, and the K-line chart continues to maintain a relatively strong trend along the short-term moving average. Some divergence is showing on the short-term chart, so watch for short-term adjustments.
Trading Strategy:
BUY: 3910 TP1:3925 TP2:3940
SELL: 3940 TP1:3910 TP2:3900
XAUUSD H1 OUTLOOK , READY TO GOLD HIT 4000 Gold Buy Setup Looking.
Ifvg And TL Breakout
Buying zone trend line and ifvg
Target will be 4000$
Good Luck Guys

GOLD 1H CHART ROUTE MAP UPDATE & TRADING PLAN FOR THE WEEKHey Everyone,
Please see our updated 1h chart levels and targets for the coming week.
We are seeing price play between two weighted levels with a gap above at 3907 and a gap below at 3880. We will need to see ema5 cross and lock on either weighted level to determine the next range.
We will see levels tested side by side until one of the weighted levels break and lock to confirm direction for the next range.
We will keep the above in mind when taking buys from dips. Our updated levels and weighted levels will allow us to track the movement down and then catch bounces up.
We will continue to buy dips using our support levels taking 20 to 40 pips. As stated before each of our level structures give 20 to 40 pip bounces, which is enough for a nice entry and exit. If you back test the levels we shared every week for the past 24 months, you can see how effectively they were used to trade with or against short/mid term swings and trends.
The swing range give bigger bounces then our weighted levels that's the difference between weighted levels and swing ranges.
BULLISH TARGET
3907
EMA5 CROSS AND LOCK ABOVE 3907 WILL OPEN THE FOLLOWING BULLISH TARGETS
3937
EMA5 CROSS AND LOCK ABOVE 3937 WILL OPEN THE FOLLOWING BULLISH TARGET
3965
EMA5 CROSS AND LOCK ABOVE 3965 WILL OPEN THE FOLLOWING BULLISH TARGET
3993
EMA5 CROSS AND LOCK ABOVE 3993 WILL OPEN THE FOLLOWING BULLISH TARGET
4019
BEARISH TARGETS
3880
EMA5 CROSS AND LOCK BELOW 3880 WILL OPEN THE FOLLOWING BEARISH TARGET
3848
EMA5 CROSS AND LOCK BELOW 3848 WILL OPEN THE FOLLOWING BEARISH TARGET
3819
EMA5 CROSS AND LOCK BELOW 3819 WILL OPEN THE SWING RANGE
3683
3654
EMA5 CROSS AND LOCK BELOW 3654 WILL OPEN THE SECONDARY SWING RANGE
3781
3743
As always, we will keep you all updated with regular updates throughout the week and how we manage the active ideas and setups. Thank you all for your likes, comments and follows, we really appreciate it!
Mr Gold
GoldViewFX

XAU/USD Near Record Highs: Key Data AheadGold (XAU/USD) Technical Outlook – October 3, 2025
1. Macro & News Context
Gold is holding near record highs, heading for its seventh consecutive weekly gain, supported by expectations that the Federal Reserve will continue cutting rates and by concerns around the ongoing U.S. government shutdown. Spot prices have recently tested the $3,890–3,900 region and are now consolidating around $3,860.
Nonfarm Payrolls (NFP) – Typically scheduled for 08:30 ET / 12:30 UTC on the first Friday of the month, the September jobs report is likely to be delayed due to the U.S. government shutdown.
Key event to watch today:
ISM Services PMI (September) will be released at 10:00 ET / 14:00 UTC. Since ISM data is privately produced, it will be published regardless of the shutdown and may serve as the main volatility catalyst in today’s U.S. session. 【ISM】
Labor market signals: Challenger job cut data showed lower layoffs in September, but planned hiring at the lowest level since 2009, reinforcing a softer employment backdrop. Combined with the Fed’s recent 25 bps rate cut (to 4.00%–4.25%), this continues to support the bullish gold narrative.
USD trend: The dollar has weakened broadly this week, aligning with market bets on further monetary easing. This backdrop provides an additional tailwind for gold.
2. Technical Landscape (H1 Chart)
The attached chart highlights key technical zones and a completed Harmonic XABCD pattern on the 1H timeframe:
Support levels:
Near-term: $3,844–3,841
Deeper: $3,827 (intraday pivot), $3,792 (strong low)
Strategic: $3,764–3,770 (Bullish Order Block)
Resistance levels:
Immediate: $3,865
Strong supply: $3,880–3,890 (Bearish Order Block)
Extended target: $3,930–3,940 (Sell Scalping | Fibo zone)
Momentum: After bouncing from point D of the harmonic structure, gold has been forming higher lows (HL). Price currently sits above the longer-term moving average and is testing the shorter-term average, suggesting a constructive short-term bias as long as supports hold.
3. Trade Scenarios
Scenario 1 – Buy-the-dip (preferred bias)
Entry zone: $3,844–3,841
Stop loss: Below $3,827 (safer: below $3,792)
Targets:
$3,865 (first take-profit)
$3,880–3,890 (major supply)
Stretch: $3,930–3,940
Rationale: Higher low formation, bullish macro backdrop, aligned with strong weekly uptrend.
Scenario 2 – Countertrend short at resistance
Trigger zone: $3,880–3,890 (Bearish OB)
Confirmation: Rejection candles (H15–H1) such as wicks, engulfing, or failed breakout.
Stop loss: Above $3,895–3,900 (or above $3,945 if price spikes into the $3,930–3,940 fib zone).
Targets: $3,865 → $3,844 → $3,827
Rationale: Potential liquidity sweep ahead of ISM, with profit-taking likely near supply zones.
Scenario 3 – Breakdown through support
Trigger: 1H close below $3,841
Path: $3,827 → $3,792 (Strong Low) → $3,764–3,770 (Bullish OB)
Rationale: Loss of intraday structure would flip bias short until major demand zones.
4. How to Trade Around Today’s Data
If NFP is indeed delayed, the 08:30 ET / 12:30 UTC slot may bring limited volatility.
Focus instead on the ISM Services PMI at 10:00 ET / 14:00 UTC, which could trigger sharp swings in both USD and gold.
Adjust position sizing: Expect spread widening and slippage around the release. Reduce leverage or scale into positions.
5. Risk Management
Limit risk per trade to 0.5–1% of account equity.
Avoid chasing price once levels are tested; wait for H15–H1 candle closes for confirmation.
Monitor the U.S. Dollar Index (DXY) and Treasury yields – further dollar weakness would reinforce bullish gold setups.
🔑 Key Takeaway
Gold remains structurally bullish in the broader trend, with immediate support at $3,841–3,844 critical to maintain upside momentum. Watch for reactions around $3,880–3,890 and $3,930–3,940. With NFP possibly delayed, the ISM Services PMI at 10:00 ET / 14:00 UTC will be today’s most important catalyst for directional moves.

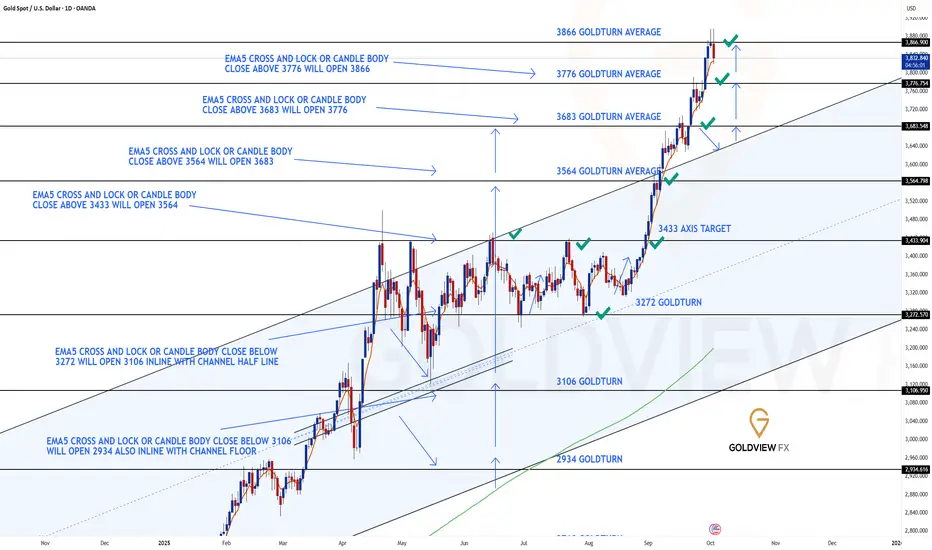
GOLD DAILY CHART UPDATEHey Everyone,
So we finish off with an amazing close to this week with all our chart ideas complete. This Daily chart has now closed above the 3866 final target level, which means the range above is open.
We will update the new range and levels above on Sunday, so keep an eye out for our multi-timeframe analysis.
✅ 3866 Target Achieved with close above
Key Levels
📉 Support: 3776 / 3683
📈 Resistance: 3866
What’s Next?
We’ll be back on Sunday with a fresh Daily chart idea, updated targets, and a full multi-timeframe analysis to guide the next leg of the journey. Stay tuned – momentum is only heating up from here!
Thank you for the continued support, and congratulations to everyone who rode this move with us.
Mr Gold
GoldViewFX
10.3 Gold US Market Technical Analysis!!!Our overall judgment on gold in October is "bumpy", that is, the market has turned from the steady slow bull market in September to a fluctuating rise. There will be a tug-of-war between long and short positions, and there will be a tug-of-war between highs and lows and a rapid rebound. However, this does not mean the end of the bull market, but only a change in the rising rhythm. We should pay attention to this pattern change in the short term. We will still view it as a strong rhythm during the day. After the volatile upward trend in the Asian and European sessions, we will choose to follow up with a bullish trend after a pullback. Pay attention to the suppression around 3874 and 3895 on the upside. At the same time, due to the uncertainty of the non-farm payroll results, whether it is announced or not will have a greater impact on today's operations.
Daily Plan: Gold Targets 7th Straight Weekly Gain📊 Market Context
Gold holds firm above $3,850, aiming for its 7th consecutive weekly gain.
🔥 Main driver: Risks from a prolonged U.S. government shutdown.
📉 54% probability of the shutdown lasting 29 days (Polymarket) → directly impacting gold sentiment.
🛡️ Safe-haven demand & BUY-side FOMO keep fueling momentum.
⚖️ Still, profit-taking at higher resistance zones could trigger sharp swings before the next directional move.
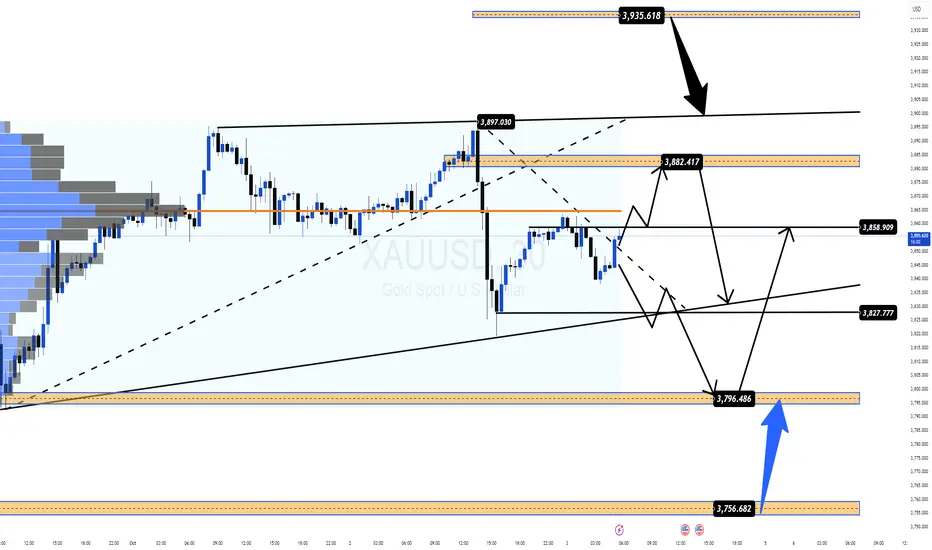
🔎 Technical Analysis (H1/H4)
📈 Main trend: Bullish, but consolidating near 3,850.
🚧 Key Resistances: 3882–3884 & 3934–3936 (Liquidity Sell Zones).
🏦 Key Supports: 3797–3795 & 3756–3754 (Buy Zones).
🎯 Key Levels: 3850 – 3880 – 3900.
📈 Trading Scenarios & Plan
✅ SELL ZONE 1: 3882–3884
SL: 3890
TP: 3878 – 3874 – 3870 – 3865 – 3860 – 3850 – 3840 – ???
✅ SELL ZONE 2: 3934–3936
SL: 3940
TP: 3930 – 3925 – 3920 – 3910 – 3900 – ???
✅ BUY ZONE 1: 3797–3795
SL: 3790
TP: 3800 – 3810 – 3820 – 3830 – 3840 – ???
✅ BUY ZONE 2: 3756–3754
SL: 3750
TP: 3760 – 3770 – 3780 – 3790 – 3800 – ???
⚠️ Risk Management Notes
🌀 U.S. shutdown headlines may spark unexpected volatility.
🕵️♂️ Focus on BUY setups at support, avoid chasing FOMO at highs.
❌ Consider SELL only if clear rejection signals form at resistance zones.
✅ Summary
Gold remains supported by safe-haven flows, eyeing a 7-week winning streak.
🎯 Strategy:
BUY setups: 3797–3795 & 3756–3754.
SELL setups: 3882–3884 & 3934–3936.
📢 Follow MMFLOW TRADING for real-time updates & BIGWIN setups!
9.3 Gold awaits non-farm payrolls!!!Gold's daily candlestick chart continues to fluctuate slightly higher along its short-term moving average, with prices currently under pressure around 3900. Tonight's non-farm payroll data may not be released as expected, adding some uncertainty to the market. On an hourly chart, after a period of narrow range-bound trading, the technical pattern is gradually recovering. With prices slowly breaking through the previous resistance zone, there may be some short-term rebound potential. On a four-hour chart, the short-term moving averages are essentially flat, suggesting continued high-level fluctuations and repairs. Watch for short-term corrections.

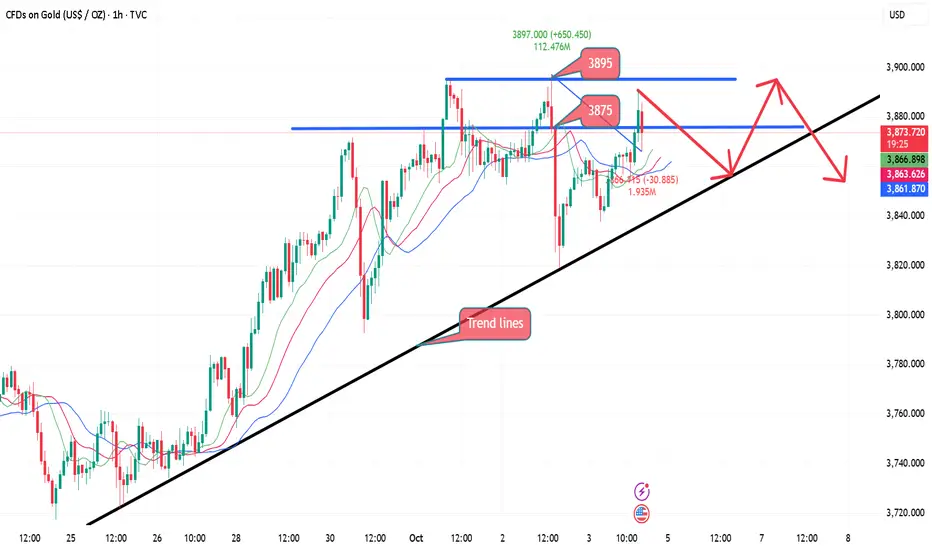
Not the Bottom Yet—Gold Poised to Retest 3800Gold failed to break through 3900 again and fell all the way from around 3897 to 3819, with a drop of $78 again. The two recent declines of this magnitude have greatly hit the confidence and sentiment of market bulls, and the bearish atmosphere in the market may become even stronger.
Although gold rebounded again after touching 3819, it failed to hit 3900 twice and has successfully constructed an M-shaped double top structure in the short-term structure. Suppressed by this technical structure, the bullish momentum may be difficult to sustain and will intensify the short-term volatility. The volatility range is likely to be switched to the 3860-3820 area. Therefore, based on the current market changes, we cannot blindly be bullish on gold for the time being.
From a technical perspective, gold is under pressure in the 3850-3860 area in the short term, so if gold rebounds and touches near this area, we can give priority to shorting gold, first targeting the retracement target area: 3835-3825 area. Once gold falls below the level around 3820, it is very likely to test the support strength of 3800 again.

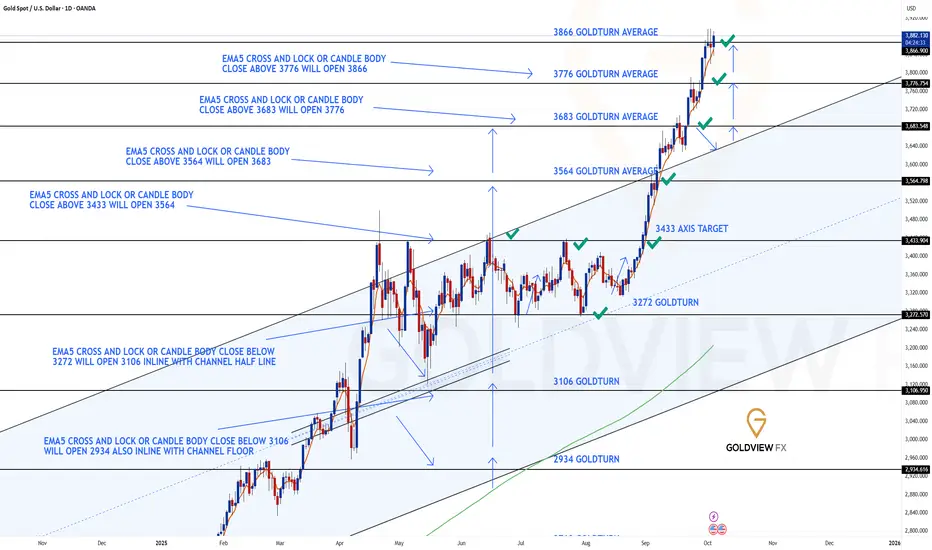
DAILY CHART UPDATEHey Everyone,
Another great day on the charts with all our chart ideas now complete. Please see update on our Daily chart idea, which is now respecting the final target.
✅ 3776 & 3866 Targets Achieved!
Our chart ideas played out perfectly — 3683 → 3776 → 3866 final daily target completed.
Now the focus is on what’s next:
Breakout Scenario: A clear close above 3866 = continuation higher.
Rejection Scenario: Failure to close above = rejection, which we’re already starting to see now. Resistance is holding, and we may get the first leg of a correction.
Let’s see if momentum picks up enough to test the lower Goldturns for support and bounce.
Key Levels
📉 Support: 3776 / 3683
📈 Resistance: Above 3866 (on confirmed breakout)
Stay tuned for the next update as this plays out.
Mr Gold
GoldViewFX
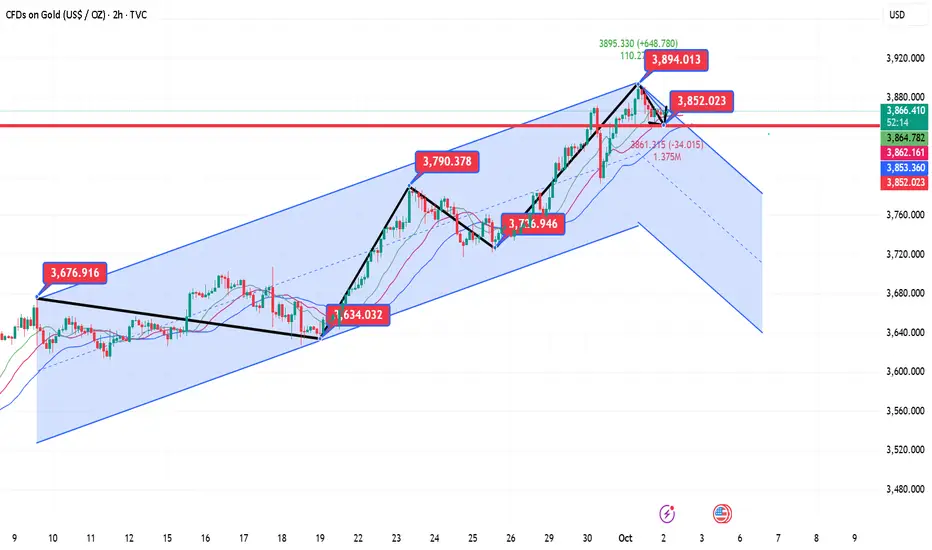
(XAU/USD) – Gold to reach $4,000/oz: Where is the best buy point1. Price Structure & Main Trend
On the H1 timeframe, gold still maintains a bullish structure with higher highs and higher lows.
After the Break of Structure (BoS), price retraced to test the Buy Zone around 3,862 and bounced back up.
Currently, price is trading above both EMA34 and EMA89, confirming that the uptrend remains dominant.
2. Key Zones
Buy Zone: 3,862 – 3,865. Short-term support, aligned with the previous BoS. If price holds above this zone, the bullish scenario is strengthened.
Order Block (OB) 1: 3,806 – 3,810. Next support zone if the Buy Zone is broken.
Order Block (OB) 2: 3,763 – 3,770. Deeper support, activated only in case of a strong correction.
Sell Scalping Zone (Fibo): around 3,912. A potential short-term resistance where profit-taking may occur.
Sell Zone / ATH: 3,933 – 3,935. Breaking above this area may lead gold to a new all-time high.
3. Trading Scenarios
Bullish (Main Scenario):
Look to buy at 3,862 – 3,865 if price retests.
SL: Below 3,850 (under Buy Zone and EMA89).
TP1: 3,912 (Sell Scalping Zone).
TP2: 3,933 – 3,935 (new ATH).
Bearish (Defensive Scenario):
If price breaks below Buy Zone and closes under 3,860, it may test OB 3,806 – 3,810.
In a worse case, if OB1 is also lost, short-term bullish momentum could weaken, pushing gold to OB 3,763 – 3,770.
4. Summary
Gold on H1 maintains strong bullish momentum after breaking structure. The optimal plan is to prioritize buying at key support, manage risk tightly, and gradually take profit at resistance zones. If price surpasses 3,933, gold may enter a new all-time high phase.

9.2 Gold Short-Term Technical Analysis Guide!!!Gold prices naturally retreated after hitting a new high on Wednesday, but the candlestick chart remains oscillating upward (with higher lows). If prices fall below the midline of the trend channel at 3869, the market is likely to shift towards the 3850-35 range. Currently, gold prices are showing this trend. Conservative investors can consider entering the market based on whether the 3834/35 support levels are broken (a rebound could reach as high as 50; if it falls below, the market is bearish and could reach 3810).
Reference support levels: 3849, 3834, and 3794.
Reference resistance levels: 3880, 3903, and 3917.
Bearish Momentum Builds: Gold Aims for 3850–3840Gold touched around 3895 during its rise and then began to retreat, reaching a low of around 3856. Currently, gold is fluctuating in a narrow range around 3870. According to the current trend, gold will not continue to maintain its strong position in the short term, and because of the US government shutdown, there may be no economic data in the short term. Out of caution, the market may also press the pause button on gold to ease the upward trend!
From a technical perspective, gold fell from around 3872 to around 3793 yesterday, with a retracement of as much as $79; while today gold only fell from 3895 to around 3856, with a retracement of only $39. Judging from the adjustment space and testing cycle, the gold correction is not sufficient and there is still demand to continue to fall, at least to the 3850-3840 area.
As gold retreats, it may be difficult for the bullish momentum to regain its strength in the short term. Under the counterattack and pull of the bears, the high-level volatility trend may be exacerbated. In the short term, gold is under pressure in the 3870-3880 area. If it is difficult for gold to break through this area in the short term, gold may continue to fall to the 3850-3840 area through this resistance area. Once it falls below this area, gold may continue to fall to the 3820-3810 area.
So in terms of trading, I still think we can continue to try to short gold in the 3870-3880 area, first looking at the retracement target area: 3860-3850.

GOLD WEEKLY CHART MID/LONG TERM ROUTE MAP UPDATEWeekly Chart Update – Follow Up
3732 Hit & Closed Above, 3806 Gap Opens – Now Completed
Previously we highlighted 3732 as the breakout target after confirming strength above 3659. That level was successfully achieved, and now we’ve gone a step further: 3806 has officially been HIT, completing this weekly chart idea.
This also means all of our multi-timeframe chart ideas have now completed, a full sequence cycle from setup to fulfilment.
Interim Outlook
We’ll share some interim analysis tomorrow to guide through the remainder of this week. On Sunday, a brand-new multi-timeframe analysis will be prepared and shared, laying the foundation for the weeks and months ahead.
In the meantime, if we see any corrections back into the existing chart idea range, the outlined levels remain valid for structure and range management.
Current Outlook
🔹 3806 Range Gap Completed
The final upside expansion objective has now been fulfilled, completing the cycle.
🔹 Correctional Supports – 3659 & 3576
Any detachment below raises correctional risk. 3659 and 3576 (Goldturn) remain critical support zones, with the channel top confluence offering a potential bounce zone.
Updated Levels to Watch
📉 Supports – 3659 & 3576 (correctional zones), deeper floor at 3482
📈 Resistance – 3806 (completed), awaiting new upside mapping in upcoming analysis
Plan
The bullish structure has completed its full range cycle into 3806. From here, corrections into support zones would be healthy resets, while we prepare to track fresh setups in the next multi-timeframe framework.
Flexibility with structure and levels remains key as we transition into the next phase.
Mr Gold
GoldViewFX

10.1 Gold US Trading StrategyJudging from the 4-hour market trend, the bulls closed with a positive sign and fluctuated at a high level. The short-term support below is 3814-25, and the important support is 3800-08. The bulls are rising strongly and there is no top. The operation is mainly to go long on pullbacks. In the middle position, watch more and do less, be cautious in chasing orders, and wait patiently for key points to enter the market.
Gold fell as expected, and subsequent pullbacks led to long posiBased on the 4-hour analysis, support is focused on the 3800-95 level. The bulls are rising strongly and there's no end in sight. Trading strategies should primarily focus on buying on pullbacks. In the intermediate range, be cautious and wait for key entry points. I'll provide detailed trading strategies during the trading session, so please stay tuned.
Gold Trading Strategies:
1. Buy gold at the 3800-05 level, and add to your long position on pullbacks to the 3785-90 level. Set a stop loss at 3778 and target the 3845-3850 level.
Support Unproven: Gold Bears Eye Fresh PullbackGold began retreating from around 3872, hitting 3793 before rebounding again. It has now reached a high of around 3855, recovering most of its losses.
However, it's not difficult to see that since gold's recent decline reached a rare $80, its upward momentum has been lackluster, even somewhat weak. This suggests that the sharp pullback in gold's short-term performance has dampened bullish sentiment to some extent. Furthermore, it's clear that gold has shown clear signs of profit-taking above 3855. While a collapse is far from imminent, further declines are possible as signs of profit-taking intensify.
From a technical perspective, gold experienced a sharp decline in the short term and rebounded near 3793. Technically, the validity of 3793 as a low point needs to be retested and verified. Therefore, a direct upward move in the near term is unlikely, and a retest of the short-term support low is necessary.
So, when judging short-term support and resistance, we first need to pay attention to the role of the 3845-3855 resistance area above; below, we first pay attention to the support area of 3810-3800. If gold falls below the support near the low point of 3793, then gold may fall further to the 3780-3770 area.
Therefore, in terms of short-term trading, we can still take advantage of the rebound in gold and give priority to shorting gold in the 3840-3850 area, first looking at the target 3820-3810 area.

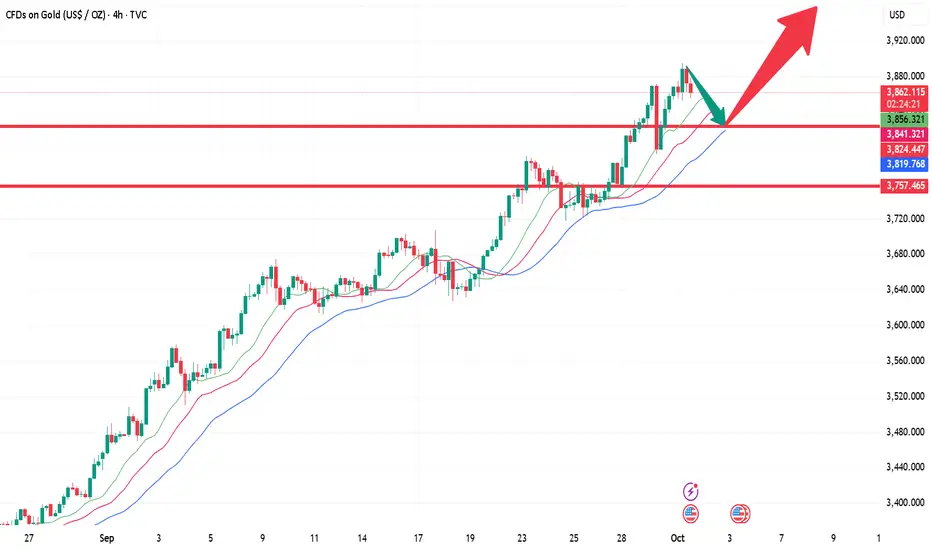
GOLD 4H CHART ROUTE MAP UPDATEHey Everyone,
Another PIPTASTIC day on the charts with our 4H chart also playing out as analysed.
Yesterday we completed our 1H chart idea and today we complete our 4H chart idea. After completing 3778 target, we had ema5 cross and lock gaps open above at 3811 and 3845 - Both of these gaps are now hit complecting this chart idea.
BULLISH TARGET
3696 - DONE
EMA5 CROSS AND LOCK ABOVE 3696 WILL OPEN THE FOLLOWING BULLISH TARGETS
3738 - DONE
EMA5 CROSS AND LOCK ABOVE 3738 WILL OPEN THE FOLLOWING BULLISH TARGET
3778 - DONE
EMA5 CROSS AND LOCK ABOVE 3778 WILL OPEN THE FOLLOWING BULLISH TARGET
3811 - - DONE
EMA5 CROSS AND LOCK ABOVE 3811 WILL OPEN THE FOLLOWING BULLISH TARGET
3845 - DONE
As always, we will keep you all updated with regular updates throughout the week and how we manage the active ideas and setups. Thank you all for your likes, comments and follows, we really appreciate it!
Mr Gold
GoldViewFX

Gold 09/30 |Safe-haven flows surge | Gold sails toward new highs🟡 XAU/USD – 30/09 | Captain Vincent ⚓
🔎 Captain’s Log – Context & News
US Politics : Meeting between Trump and bipartisan leaders ended without agreement → growing risk of a US government shutdown by Wednesday.
Conflict : Democrats demand concessions, Republicans fiercely oppose → wide gap remains, both sides blaming each other.
Market : Investors watch JOLTS data and speeches from 3 FED members, but political risks are the strongest catalyst for Gold.
Trend : Safe-haven flows keep pouring into Gold → increasing likelihood of testing new ATH.
⏩ Captain’s Summary : US political seas are stormy, Gold becomes the fortress of safety. The voyage toward ATH is widening.
📈 Captain’s Chart – Technical Analysis (H1)
EMA : EMA 34 (yellow) > EMA 89 (red) → bullish trend clearly dominant.
Golden Harbor (Support / Buy Zone)
Near FVG: 3,856
FVG Scalping: 3,842
Big Volume Dock: 3,827
Storm Breaker (Resistance / Sell Zone)
ATH test: 3,916 – 3,917
Market Structure : Gold broke out strongly, now trading around 3,870. Main trend remains bullish, with 3,842 – 3,827 as key anchor zones.
🎯 Captain’s Map – Trade Plan
✅ Buy (main priority)
Buy Zone 1 – Scalping FVG
Entry: 3,842 – 3,844
SL: 3,835
TP: 3,846 – 3,849 – 3,852 – 3,859 – 3,8xx
Buy Zone 2 – Big Volume
Entry: 3,827 – 3,824
SL: 3,815
TP: 3,870 – 3,899 – 3,916
⚡ Sell (short scalp – high risk)
Sell Zone – ATH test
Entry: 3,917 – 3,920
SL: 3,925
TP: 3,899 – 3,870 – 3,856
⚓ Captain’s Note
“The Golden sails are filled by safe-haven winds, pushing the ship close to ATH. Golden Harbor 🏝️ (3,842 – 3,827) is the ideal dock for sailors to position Buys. Storm Breaker 🌊 (3,916 – 3,920) may unleash violent waves, suitable only for short Quick Boarding 🚤 scalps. If the political storm from Washington breaks out, Gold’s voyage could surpass the peak and expand its horizon.”
📢 If you find the Captain’s Log useful, don’t forget to Follow for the earliest updates.
💬 What’s your view, crew? Will Gold conquer ATH around 3,917 this week?

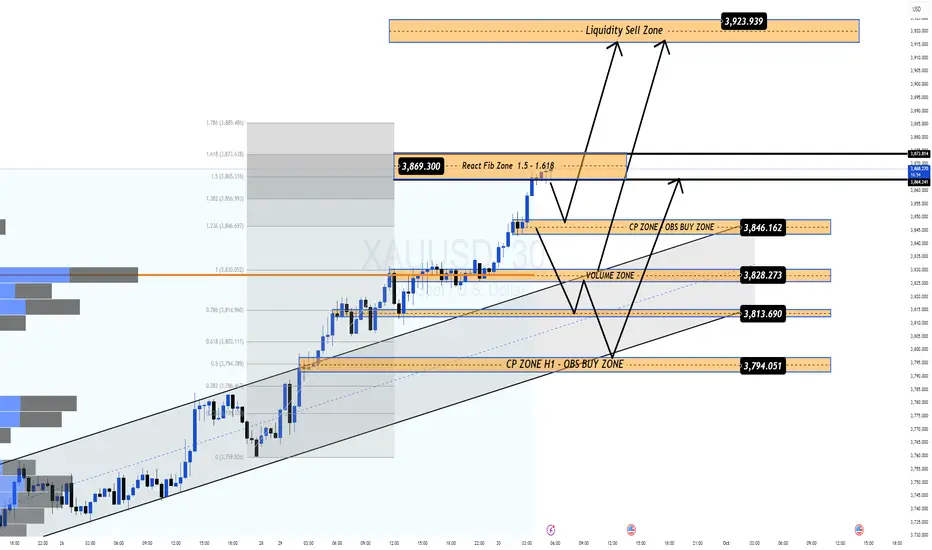
No Room for SELL, Only BUY with Strong Market Flows📊 Market Context
Talks between Trump and US congressional leaders ended with no clear agreement, leaving the threat of a US government shutdown hanging over the market. Both sides continue to blame each other with no common ground in sight.
On the last trading day of the month, focus shifts to the upcoming JOLTS job openings data and speeches from three Fed officials. Combined with political uncertainty and strong safe-haven flows, gold remains heavily supported. For now, there’s no space for SELL setups — the primary direction is still BUY.
🔎 Technical Analysis (H1/H4)
Price has broken higher, continuing to print fresh ATHs with strong bullish momentum.
Main BUY Zone sits at 3846–3844 (confluence of FIB + CP zone).
Secondary support at 3827–3825 (volume zone) where strong reactions are expected.
If momentum persists, medium-term upside targets lie toward the 3923–3930 liquidity zone.
🔑 Key Technical Levels
BUY Zones: 3846–3844, 3827–3825
SELL Zone (Observation only – potential liquidity trap): 3923–3930
📈 Scenarios & Trading Plan
BUY ZONE 1: 3846–3844
SL: 3840
TP: 3850 - 3855 - 3860 - 3870 - 3880 - ???
BUY ZONE 2: 3827–3825
SL: 3820
TP: 3835 - 3840 - 3850 - 3860 - 3870 - 3880 - ???
⚠️ Risk Notes
Expect volatility with JOLTS data and Fed speeches today.
Avoid FOMO buying at highs — wait for price action confirmation at key zones.
Manage position size carefully as end-of-month trading can bring unexpected swings.
✅ Summary
Gold remains firmly in bullish territory, supported by political risks and macroeconomic uncertainty. Plan of the day: prioritize BUY entries at 3846–3844 and 3827–3825, with extended targets at 3880+ and potentially 3920+. Momentum is strong, and following the BUY side remains the higher-probability path.
📢 Stay tuned with MMFLOW TRADING for real-time updates and BIGWIN setups!