Money, Time and Emotions – The Trio before Balance in Trading
Gurus love to tell traders: “You just need to find your balance.”
But to be honest, balance doesn’t exist when Gold just ripped through your stop loss for the second time today, and you do a sneak charts check on your phone while pretending to work.
For sure, you are not calm or zen.
At least in the first 2 years... more like frustrated, scattered, and asking yourself if this whole thing is even worth it.
But you’re not broken.
Just carrying the wrong kind of weight, and it usually shows up in three ways combined.
⏳ The Time Pressure
Trading doesn’t fail because you cannot read the charts when you put a bit of an effort into it.
But your life is already so full. Work, family, bills, endless noise, and you’re trying to squeeze trading into the cracks for the sake of a better financial outcome.
So you start chasing candles and force trades into the tiny windows you’ve got. Plus stare at the screen longer, hoping focus & hidden entries will magically appear.
But Gold does not bend to your schedule. And that mismatch wrecks your decisions.
🔑Shift: Don’t out-stare the chart. Get rid of some stress levels by: Set alerts near the key reaction zones. Create focus slots. Let price knock on your door by doing homework in advance.
💰 The Money Illusion
Every trader has tried it: opening a tiny 200 USD account and hoping it’ll explode into freedom.
But pressure makes that account heavier than it really is.
Instead of freedom, you get fear. So your clarity goes away.
And suddenly every single candle feels like it’s deciding your future. So in the end, that little account gets blown several times.
🔑Shift: Lower the stakes. Trade smaller than you think you should. ALWAYS. Track everything, especially your state of mind, keep a journal, and do not be ashamed to put down some thoughts. The game isn’t about miracles, but making repetition boringly consistent like gym reps.
🐺 The Lone Wolf Spiral
The hardest part isn’t the losses but the silence that surrounds when you choose trading.
When you do it alone, every mistake feels like proof that you are bad at this in the beginning. Every win feels like dumb luck, or it blinds you further more. There’s no feedback loop, no outside voice to ground you.
And that silence eats at you until you are second-guessing everything you do.
🔑Shift: Find real traders to connect with. Not 15 channels and 10 Discords, they will eat your time alive. Not fake hype. Actual humans who talk about process, not just profits. The right community cuts through the spiral faster than any indicator ever will. One group that gives you a direction and you can learn from, or gives you the secrets to the ropes ‘til you catch them.
🧭 And The Good News Is...
Stress doesn’t mean you’re doomed.
It just means the game is heavy in the wrong places: your time, your money, your isolation.
And all three are fixable in time with patience and the right support.
Balance isn’t about meditating after a loss, even though that can be good too:)
Start building a structure in your daily trading schedule bit by bit. And by putting systems around your weak spots. About letting caring trading mentors who guide you well, in your life, instead of doing all of the thinking by yourself.
If this article helped you today and brought you more clarity:
Drop a 🚀 and follow us✅ for more trading ideas and trading psychology. Thank you.
Goldtradingstrategy
Rate Decision Looms: Short Sellers Poised to StrikeGold continued to decline and is currently supported around 3660 and showing signs of rebound. I don’t hold any orders at the moment because I am currently preparing for the Federal Reserve interest rate decision news market! In fact, I have made part of the plan yesterday and today. Until now, I still tend to believe that the gold market will rise and then fall, but we must grasp the trading rhythm and entry price in the transaction.
In fact, before the Fed's interest rate announcement, gold retreated to around 3660. After this significant retreat, we can lower our expectations for a gold rally on news. Based on the current structure, the upper limit for gold bulls lies in the 3710-3720 area, and it's possible that the 3703 area has become the current high.
As gold retreats to around 3660, bullish momentum has weakened, and short-term resistance has shifted to the 3680-3690 area. Therefore, I might consider initiating a short position in gold in this area. If gold falls below the 3660-3650 range due to market news, it could continue its decline to the 3635-3625 range.
Since we currently hold no positions, we have the initiative in trading. As long as we allocate lots appropriately and strictly control risk, it's difficult not to make a profit! So, let's wish you good luck!

GOLD FALL TIME Lets Goo , Gold Selling Now
Reason SMT & BEARISH FVG
And Buy Setup Gold From OB / DEMAND ZONE
LETS GOO , HIGH PROBABILITY SETUP
FOLLOW US FOR MORE TRADES

The trend after 3700 mark is more worth looking forward to!Gold has been hitting new highs recently. Yesterday, it broke through the previous high of 3674 in the US market and surged towards 3685. Despite a brief pullback in early trading, it surged back to 3698 in the European session and even broke through 3703 in the US market, maintaining a clear bullish trend. The current pullback is a normal technical correction and has little impact on the overall uptrend, but instead builds momentum for a subsequent surge. The key support level at 3670 is currently under consideration. This level has become a short-term dividing line between bulls and bears. A break below this level will clearly indicate a bullish advantage, but a potential decline should be viewed with caution. Above this, focus on the 3705 level. A break above this level could test the 3710-3720 area, and a strong breakout could open up further upside potential. Trading strategies should include a light short position near 3705 to capture profits on pullbacks, waiting for a pullback to the 3685-3675 area to stabilize before entering a long position. The bullish trend continues to target the 3700-3705 area. The overall strategy remains to prioritize buying on dips, with a secondary focus on selling on higher levels.

GOLD READY TO FALL ? Gold Prediction
Gold Buy From Order Block / Demand Zone
It Will Sweep The Liquidity And Then Go Long With High Probability Setup

GOLD ROUTE MAP UPDATEHey Everyone,
Another awesome day on the charts with our analysis and levels playing out perfectly.
Yesterday we completed 3653 and 3678, confirmed by the EMA5 lock. After that, we got an EMA5 lock above 3678, which opened up 3702 and it hit right on the nose. Pure perfection.
It’s incredible to see our levels showing this kind of accuracy without any historical data.
Right now, we’re seeing a rejection and some play between 3678 and 3702. We’ll need the EMA5 lock again to confirm the next direction.
We will keep the above in mind when taking buys from dips. Our updated levels and weighted levels will allow us to track the movement down and then catch bounces up.
We will continue to buy dips using our support levels taking 20 to 40 pips. As stated before each of our level structures give 20 to 40 pip bounces, which is enough for a nice entry and exit. If you back test the levels we shared every week for the past 24 months, you can see how effectively they were used to trade with or against short/mid term swings and trends.
The swing range give bigger bounces then our weighted levels that's the difference between weighted levels and swing ranges.
BULLISH TARGET
3653 - DONE
EMA5 CROSS AND LOCK ABOVE 3653 WILL OPEN THE FOLLOWING BULLISH TARGETS
3678 - DONE
EMA5 CROSS AND LOCK ABOVE 3678 WILL OPEN THE FOLLOWING BULLISH TARGET
3702 - DONE
EMA5 CROSS AND LOCK ABOVE 3702 WILL OPEN THE FOLLOWING BULLISH TARGET
3727
EMA5 CROSS AND LOCK ABOVE 3727 WILL OPEN THE FOLLOWING BULLISH TARGET
3747
EMA5 CROSS AND LOCK ABOVE 3747 WILL OPEN THE FOLLOWING BULLISH TARGET
3768
BEARISH TARGETS
3622
EMA5 CROSS AND LOCK BELOW 3622 WILL OPEN THE FOLLOWING BEARISH TARGET
3585
EMA5 CROSS AND LOCK BELOW 3585 WILL OPEN THE SWING RANGE
3556
3528
As always, we will keep you all updated with regular updates throughout the week and how we manage the active ideas and setups. Thank you all for your likes, comments and follows, we really appreciate it!
Mr Gold
GoldViewFX

In the game between bulls and bears, where will gold go?After a slight pullback yesterday, gold broke through the previous high of 3674 in the US session, reaching a high near 3685. After an intraday correction, it reached a new high in the European session, currently reaching 3699. Since the start of its strong rally, gold has gained nearly $386, almost continuously breaking new highs. Market expectations for bullishness have further intensified, and the current trend remains clearly bullish, with no signs of a significant bearish pullback. Short-term support is closely watched at 3675, a previous high and a short-term dividing line between bulls and bears. If it stabilizes above this level, bulls are expected to regain momentum. The European high and the 3700 mark will become key short-term resistance levels. If it breaks through and stabilizes at 3700, it is expected to continue to rise to test resistance in the 3710-3720 area.
In terms of operational thinking, if gold first rebounds to below 3700 and comes under pressure, you can try to short with a light position, with the target at 3685-3670 area; if it stays at 3700 for a long time, you need to adjust the short position in time, follow the trend and go long, waiting for a new round of upward opportunities.

Gold hits a new high again, the opportunity to invest has come!Gold's recent performance remains strong, reaching a new all-time high near 3,685, fully demonstrating the dominance of bullish sentiment. Although inflation remains viscous, the market is increasingly confident that the Federal Reserve will cut interest rates this week. Focus is shifting to the extent of the cut and subsequent policy guidance. If the rate cut exceeds expectations, gold may usher in a new round of liquidity-driven gains. If it falls short of expectations, short-term profit-taking may occur, leading to increased volatility.
From a technical perspective, gold has closed higher for several consecutive days, with short-term moving averages aligned in a bullish pattern. The daily and 4-hour charts remain in an upward trend, with the support center continuously shifting upwards. The bullish structure is solid, but the current price is already at a relatively high level. If the upward push fails to break through with significant volume, there is still room for a short-term pullback, and we need to be wary of the possibility of a technical correction. Today's core trading strategy is to primarily buy on dips, supplemented by shorting at high levels. We should participate with the trend and avoid blindly chasing the market. Support below is the 3650-3635 area. If it stabilizes after a pullback, we can arrange long positions in batches, with the initial target around 3680-3685, and then explore the potential for further growth after breaking through the new high. Resistance above is the 3685-3690 area. If the short-term upward push encounters resistance and fails to break through, we can try shorting with a light position, with a stop-loss placed above the resistance level. Enter and exit quickly, and avoid a prolonged battle. The short-term bullish strength and weakness dividing line is the 3630-3620 level. If it breaks below, we should be wary of the risk of a deep pullback.
This week is packed with macroeconomic events, with the Federal Reserve's interest rate decision in particular under scrutiny, potentially amplifying market volatility. We recommend building positions in batches, maintaining strict position management, and setting effective stop-loss and take-profit targets to ensure profit capture while minimizing drawdown risk.
Do you think the Federal Reserve will cut interest rates beyond expectations this time? We welcome your exchange of views. We will also adjust our strategies immediately based on the data to ensure that our trading rhythm keeps pace with the market.

GOLD ROUTE MAP UPDATEHey Everyone,
Great start to the week with our 1H chart idea playing out as analysed.
We started with our Bullish target 3653 being hit, followed with emA5 cross and lock opening 3678 - This was also hit perfectly completing the setup.
We will now look for a ema56 cross and lock above 3678 for a continuation into 3702 or failure to lock above 3678 will follow with a rejection into the lower Goldturns for support and bounce.
We will keep the above in mind when taking buys from dips. Our updated levels and weighted levels will allow us to track the movement down and then catch bounces up.
We will continue to buy dips using our support levels taking 20 to 40 pips. As stated before each of our level structures give 20 to 40 pip bounces, which is enough for a nice entry and exit. If you back test the levels we shared every week for the past 24 months, you can see how effectively they were used to trade with or against short/mid term swings and trends.
The swing range give bigger bounces then our weighted levels that's the difference between weighted levels and swing ranges.
BULLISH TARGET
3653 - DONE
EMA5 CROSS AND LOCK ABOVE 3653 WILL OPEN THE FOLLOWING BULLISH TARGETS
3678 - DONE
EMA5 CROSS AND LOCK ABOVE 3678 WILL OPEN THE FOLLOWING BULLISH TARGET
3702
EMA5 CROSS AND LOCK ABOVE 3702 WILL OPEN THE FOLLOWING BULLISH TARGET
3727
EMA5 CROSS AND LOCK ABOVE 3727 WILL OPEN THE FOLLOWING BULLISH TARGET
3747
EMA5 CROSS AND LOCK ABOVE 3747 WILL OPEN THE FOLLOWING BULLISH TARGET
3768
BEARISH TARGETS
3622
EMA5 CROSS AND LOCK BELOW 3622 WILL OPEN THE FOLLOWING BEARISH TARGET
3585
EMA5 CROSS AND LOCK BELOW 3585 WILL OPEN THE SWING RANGE
3556
3528
As always, we will keep you all updated with regular updates throughout the week and how we manage the active ideas and setups. Thank you all for your likes, comments and follows, we really appreciate it!
Mr Gold
GoldViewFX

Gold on the eve of interest rate cut: opportunity or trap?Gold Technical Analysis: Further analyzing gold's trend from a technical perspective, since its decline from the 3675 high, the daily chart has failed to show a clear unilateral direction. Instead, it has exhibited a pattern of alternating negative and positive fluctuations with narrowing amplitudes. Furthermore, the K-line chart continues to trade above the unilateral moving average. This pattern clearly points to a period of consolidation within a bullish trend, rather than a trend reversal. This week's daily chart should focus on two key support levels: the 3600 area represents a short-term watershed between strength and weakness. If broken, the market could shift from strong fluctuations to weak corrections. The 3500 area represents a medium-term bull-bear reversal line. A breach of this level could trigger a fundamental trend reversal. Therefore, 3600 should be the primary defensive line.
The 4-hour chart shows more volatile gold: the Bollinger Bands continue to narrow, and the moving averages are highly converging. This indicates a complete lack of momentum needed for a unilateral rise or fall. For the time being, the 3615-3660 range is the preferred range. Based on cyclical patterns, the probability of a breakout of the Bollinger Bands on Monday and Tuesday is extremely low before the bands open. Therefore, high-certainty trading can be conducted on these two trading days around 3615 (lower support) - 3660 (upper resistance), without excessive expectations for a breakout outside the range.
Based on real-time trends, gold has completed a short-term correction since the opening. Based on the logic of oscillation, long positions can be established within the day based on support near the lower edge of the range: enter near 3625-3620 (aligned with the lower edge of the 4-hour range), targeting upward fluctuations. Focus on the 3650-3660 area (where the upper edge of the 4-hour range overlaps with key resistance on the daily chart). If the price rebounds to the 3660-3655 range and finds resistance, a small position can be used to test short positions, targeting a pullback to the 3635-3630 area, forming a closed-loop buy-low-sell-high strategy within the range. Note that after the adjustment, the current price is in the middle of the range. Direct entry is not recommended for now. Wait until the price approaches the -3625-3620 support level or the 3655-3660 resistance level before placing orders based on K-line stabilization/pressure signals to improve trading accuracy. Overall, the recommended short-term trading strategy for gold today is to primarily buy on dips, supplemented by higher rebounds. Focus on the 3655-3665 resistance level on the upside, and the 3625-3615 support level on the downside.

Gold continues to fluctuate before the US interest rate decisionGold, after last Friday's continuation of the previous day's bottoming out and rebound, continued to fall into a range-bound oscillation mode, and after opening today, it continued to retreat to around 3626 before rising. Although there is no breakthrough between the bulls and bears at present, it is still in a tug-of-war, and the support below will also be maintained near the low point of 3626. This position is also the first watershed related to whether gold can continue to fall in the later period. The key pressure above is maintained near the previous secondary high point of 3655. This position is also the key suppression point for the recent retracement after multiple touches. It is also the shoulder position of the head and shoulders top, which also plays a role. It plays a connecting role, and once this position continues to suppress, gold may be under pressure again in the later period. If it does not break through again this week, gold may retreat again next week to test the support level of 3610. Although the daily line is still in a high sideways trend, the upward momentum has also declined significantly. If it bottoms out and rebounds, it needs a secondary definition of the European session, which is also an advance forecast of the US session. If gold rebounds to 3645-3655 during the day, short it and target around 3630-20. The strength of the European session may also determine the direction of the US session.

Will Gold Fly Again 3650 + ? Gold Looking For A High Pump
Gold Will Break The Triangle TL And Hit The BSL 3675
Have A Buy Trendline And RBS Green Box

Big events in gold this week!Gold closed with another positive line on the weekly chart. Although it has a long upper shadow line, the overall upward pattern is still solid, the trend has not been destroyed, and it still maintains a strong pattern. The daily level shows a high-level yin-yang cycle consolidation. It has failed to break through the 3660 high in the short term. Therefore, it will temporarily respond with a shock thinking, waiting for another bullish opportunity after the breakthrough. What needs to be paid attention to is that the Federal Reserve’s interest rate decision is about to come this week. The market may usher in a new direction choice, and volatility may intensify. At that time, the market rhythm will be more critical. Pay attention to the 3620-3660 area in the small range of the day. If it can break through, look at the extension space of the large range of 3675-3610. Remind brothers, this week’s trading should pay more attention to rhythm and risk control, avoid blindly chasing ups and downs, wait patiently for the key positions to be confirmed before entering the market accurately, execute high-winning trading plans, and lock profits firmly in the account.For the specific layout and operation rhythm, please refer to the bottom notification I released at the first time to ensure consistent execution and unified thinking, and avoid blindly following the trend and causing unnecessary risks.

With the interest rate cut coming, will gold fall or soar?The market is ever-changing. It's important to follow the trend; the trend is king. Plan your trades, trade your plans. How far one can go depends on who they walk with. How much a person can achieve in the market depends on who guides him. Let's witness what kind of turmoil gold will face next week with the Federal Reserve interest rate.
Gold has grasped the overall rhythm very well this week, the trading plan was executed smoothly, and the profit performance was satisfactory. After a slight pullback on Friday, gold rose again, and was suppressed near 3655-3660 above, and the oscillation stopped. This position also plays a role of connecting the above and the following. If this position continues to fail to break through, gold may pull back again next week to test the support position below. Although it is still in a high sideways trend at the close, the upward momentum has also declined significantly. I think whether the bulls can regroup next week is particularly important, which directly affects the later trend. Next week's interest rate decision has become the focus. Both market news and technical aspects are bullish for gold. Let us wait and see next week. If you feel your recent trading results are unsatisfactory and would like to avoid detours through clearer trading strategies and risk control, please feel free to discuss this with me.
Gold is currently in a high-level volatile pattern. After rising sharply and falling on Tuesday, it fell into a yin-yang alternating sweeping market. Before the Fed's interest rate decision, it is expected that the deadlock will be difficult to break. The market is waiting for guidance on policy direction. The key support is at the top and bottom conversion point and starting point of the 3610-3600 area. The bullish trend is maintained above it. If it breaks down, it may peak in stages. The trend suppression below Tuesday's highest point of 3674 is obvious. Next week, focus on the short-term support of the 3635-3630 area. If the Asian session tends to test the decline, the focus of the support below is near Thursday's low of 3610. If it breaks down, look at the 3600 and 3580 areas. If it breaks through the 3655 resistance above, it will turn strong in the short term and look at 3660 and the previous high. After breaking the high, focus on the 3680-3690 area. Maintain the overall range operation idea and follow the break.

GOLD 1H CHART ROUTE MAP UPDATE & TRADING PLAN FOR THE WEEKHey Everyone,
Please see our updated 1h chart levels and targets for the coming week.
We are seeing price play between two weighted levels with a gap above at 3653 and a gap below at 3622. We will need to see ema5 cross and lock on either weighted level to determine the next range.
We will see levels tested side by side until one of the weighted levels break and lock to confirm direction for the next range.
We will keep the above in mind when taking buys from dips. Our updated levels and weighted levels will allow us to track the movement down and then catch bounces up.
We will continue to buy dips using our support levels taking 20 to 40 pips. As stated before each of our level structures give 20 to 40 pip bounces, which is enough for a nice entry and exit. If you back test the levels we shared every week for the past 24 months, you can see how effectively they were used to trade with or against short/mid term swings and trends.
The swing range give bigger bounces then our weighted levels that's the difference between weighted levels and swing ranges.
BULLISH TARGET
3653
EMA5 CROSS AND LOCK ABOVE 3653 WILL OPEN THE FOLLOWING BULLISH TARGETS
3678
EMA5 CROSS AND LOCK ABOVE 3678 WILL OPEN THE FOLLOWING BULLISH TARGET
3702
EMA5 CROSS AND LOCK ABOVE 3702 WILL OPEN THE FOLLOWING BULLISH TARGET
3727
EMA5 CROSS AND LOCK ABOVE 3727 WILL OPEN THE FOLLOWING BULLISH TARGET
3747
EMA5 CROSS AND LOCK ABOVE 3747 WILL OPEN THE FOLLOWING BULLISH TARGET
3768
BEARISH TARGETS
3622
EMA5 CROSS AND LOCK BELOW 3622 WILL OPEN THE FOLLOWING BEARISH TARGET
3585
EMA5 CROSS AND LOCK BELOW 3585 WILL OPEN THE SWING RANGE
3556
3528
As always, we will keep you all updated with regular updates throughout the week and how we manage the active ideas and setups. Thank you all for your likes, comments and follows, we really appreciate it!
Mr Gold
GoldViewFX

GOLD 4H CHART ROUTE MAP UPDATE & TRADING PLAN FOR THE WEEKHey Everyone,
Please see our updated 4h chart levels and targets for the coming week.
We are seeing price play between two weighted levels with a gap above at 3655 and a gap below at 3615. We will need to see ema5 cross and lock on either weighted level to determine the next range.
We will see levels tested side by side until one of the weighted levels break and lock to confirm direction for the next range.
We will keep the above in mind when taking buys from dips. Our updated levels and weighted levels will allow us to track the movement down and then catch bounces up.
We will continue to buy dips using our support levels taking 20 to 40 pips. As stated before each of our level structures give 20 to 40 pip bounces, which is enough for a nice entry and exit. If you back test the levels we shared every week for the past 24 months, you can see how effectively they were used to trade with or against short/mid term swings and trends.
The swing range give bigger bounces then our weighted levels that's the difference between weighted levels and swing ranges.
BULLISH TARGET
3655
EMA5 CROSS AND LOCK ABOVE 3655 WILL OPEN THE FOLLOWING BULLISH TARGETS
3696
EMA5 CROSS AND LOCK ABOVE 3696 WILL OPEN THE FOLLOWING BULLISH TARGET
3738
BEARISH TARGETS
3615
EMA5 CROSS AND LOCK BELOW 3615 WILL OPEN THE FOLLOWING BEARISH TARGET
3583
EMA5 CROSS AND LOCK BELOW 3583 WILL OPEN THE FOLLOWING BEARISH TARGET
3545
EMA5 CROSS AND LOCK BELOW 3545 WILL OPEN THE FOLLOWING BEARISH TARGET
3509
EMA5 CROSS AND LOCK BELOW 3509 WILL OPEN THE SWING RANGE
3458
3409
EMA5 CROSS AND LOCK BELOW 3409 WILL OPEN THE SECONDARY SWING RANGE
3360
3320
As always, we will keep you all updated with regular updates throughout the week and how we manage the active ideas and setups. Thank you all for your likes, comments and follows, we really appreciate it!
Mr Gold
GoldViewFX

GOLD DAILY CHART ROUTE MAPDaily Chart Update
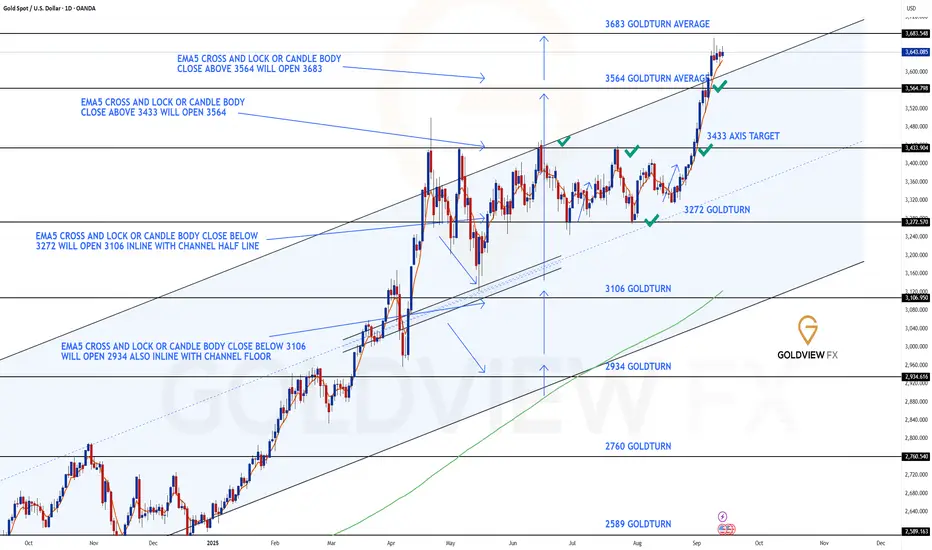
3564 Target Hit, Fresh Gap at 3683 & Breakout Confirmation
As projected in our previous update, the 3564 target has now been reached perfectly following EMA5 lock confirmation above 3433. This milestone completes the initial breakout structure and validates the bullish momentum sequence laid out earlier.
With 3564 achieved, price action has now opened a long-range gap toward 3683. The EMA5 cross and lock above 3564 provides strong continuation evidence, but we must now monitor whether support can be sustained above the channel top. A successful hold here will confirm continuation higher; however, a break back within the channel would classify this as a fake breakout attempt.
Current Outlook
🔹 3564 Target Reached
Upside momentum played out as expected, with EMA5 lock above 3433 providing early confirmation. The move delivered a clean hit of the 3564 target zone.
🔹 Next Objective – 3683
Momentum now extends toward 3683, with EMA5 lock above 3564 giving weight to this projection. Sustaining price above the channel top remains crucial to validating the next leg higher.
🔹 Breakout Validation Needed
Continuation depends on maintaining support above channel resistance. Failure to hold here risks invalidating the breakout and shifting price back into the prior range.
Updated Key Levels
📉 Support – 3272 (pivotal floor)
📉 Short-Term Supports – 3433 & 3564
📈 Resistance / Next Upside Objective – 3683
Thanks as always for your continued support,
Mr Gold
GoldViewFX
Next week's Fed decision,Has the gold bull market peaked?Let's take a look at the trend of gold this week at the weekend. The strong bull market of gold has slowed down this week. After continuing to rise to 3600 on Monday, it rose and fell to a peak of 3675 on Tuesday. From Wednesday to Friday, it fluctuated at a high level. So, does gold still have the motivation to continue to rise in the current situation? Or is 3675 the ceiling? This recent surge in gold prices began at 3311, reaching a high of $364 at 3675. Based on previous upward trends, a bull market typically peaks just over $400. Therefore, with limited room above 3700, blind buying is discouraged. Be wary of a potential reversal of price action after reaching the peak, with the upper limit at 3750. All of this depends on the Federal Reserve's interest rate decision next week. The market will become increasingly cautious as we approach this date. Therefore, gold is currently adjusting at a high level, just shy of a final acceleration towards the top. The uncertainty remains as to whether this acceleration will occur before or after the Fed's decision. If the rate cut is just 25 basis points, gold will have no further momentum to rally. Buying on expectations and selling on facts will lead to a peak and decline upon the announcement. However, if the rate cut is aggressively implemented by 50 basis points, gold will likely experience further upward momentum, most likely leading to a decline after a sharp rise. Therefore, gold is currently in a tailspin. At the end of the bull run, it's best to be bullish rather than chasing the market. It's prudent to wait for a pullback at key support levels before resuming a bullish trend. Two key support levels to watch are 3580 and 3511-3512. Having already seen four consecutive weekly gains, there's a high probability of a negative correction next week. Even if gold does rally next week, it will be the final stretch. The world's largest gold ETF has been steadily reducing its holdings in recent days, with bulls gradually taking profits. We shouldn't be tempted to buy at high levels, especially for medium- and long-term investors. It's important to emphasize that the overall trend and direction of gold remains upward, directly linked to the weakening US dollar. However, market trends aren't linear. After each bullish cycle, there's a deep correction, and this cycle repeats. This is how trends form. See if this pattern persists. Trading, then, is a process of finding the right position, following the trend and the swings. A cost-effective position gives you the confidence to hold onto your position without panic. For gold on Monday, expect continued volatility. Upper pressure lies between 3655 and 3660. A breakout would undoubtedly trigger a test of the 3675 high, leading to a potential surge and then a decline. Whether it can reach 3700 depends on the strength of the market, but I don't think the probability is high, at least for Monday. Lower support lies between 3635 and 3630, the 618 golden ratio. A break below would signal a short-term bearish bias, potentially leading to further declines to the 3610-3600 support levels.

How to seize the certain opportunity of gold?Gold prices are currently consolidating within a yellow parallel channel on the hourly chart, forming a rising flag pattern. We anticipate an eventual breakout and the start of a unilateral rally. The key short-term move lies in the middle band. If the price holds support at the middle band and 3630, a volatile upward trend is likely. A break above the upper band at 3665 could accelerate the upward trend. If the price loses control of the middle band and falls below 3630, the market will continue to fluctuate within the channel, potentially testing the lower band and support near the 10-day moving average early next week, offering a bullish opportunity at low levels.
The 3635-3630 support level should be closely monitored. If a bottoming-out rebound signal emerges, consider buying on dips. If the price effectively breaks below 3630, wait patiently for a pullback to the lower band next Monday before entering a long position. The primary resistance area above is 3665. Only a break above this level would confirm the formation of a rising flag pattern and trigger a unilateral rally. Caution is advised throughout trading, awaiting clarity on the direction of key levels.

GOLD ROUTE MAP UPDATEHey Everyone,
This is the 1H chart route map we tracked this week and it played out beautifully once again.
We got the expected play between 3613 and 3638, followed by a break above 3638 which re-opened the range to the upside. That move gave the strong push up we were looking for, just short of 3658.
Importantly, 3638 flipped into support and continued to provide precision bounces exactly in line with our dip-buying plans. A great finish to the week and a clear demonstration of how our levels consistently deliver structure and tradeable opportunities.
To recap:
3613 → 3638 gave the initial range.
The break and hold above 3638 confirmed upside continuation.
Price pushed toward 3658, with dips to 3638 giving repeated buy opportunities.
We will now come back Sunday with a full multi timeframe analysis to prepare for next week’s setups, including updated views on the higher timeframes, EMA5 alignments, and structure expectations going forward.
Thanks again for all your likes, comments, and follows.
Wishing you all a fantastic weekend!!
Mr Gold
GoldViewFX

Bulls and Bears Poised to StrikeGold is currently fluctuating in a narrow range around 3635-3655, with no clear signs of a breakthrough. However, judging from the current structure, gold has been showing an overall volatile upward trend since it rebounded near 3615.
What needs to be paid close attention to at present is the support performance near 3635. If gold can stand firmly above 3635, it will perfectly maintain the volatile upward structure and provide the prerequisite for breaking through the short-term resistance area of 3655-3665. Once gold uses this as a basis and breaks through the 3655-3665 area, then gold is expected to set a new high again, and even hit the area near 3700.
Since the bulls are still in an advantageous position and the overall structure of the market is oscillating upward, we have no reason not to execute long trades based on the long structure. Therefore, I think that in short-term trading, we can consider going moderately long on gold in the 3640-3630 area.

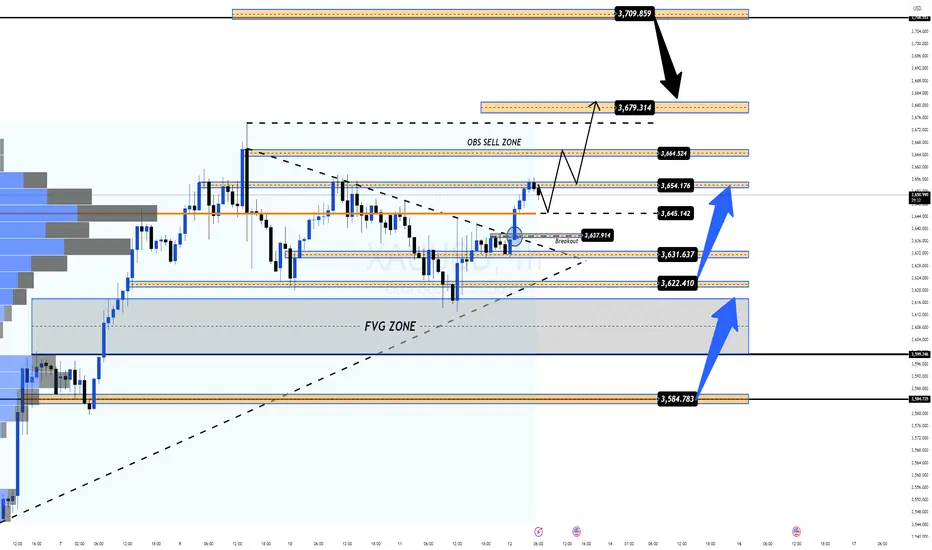
Breakout Confirmed, Macro Drivers & Key Liquidity Zones 🚀 XAUUSD | MMFLOW TRADING
📊 Market Context & Macro View
Gold (XAUUSD) has confirmed a breakout above its short-term descending trendline, signalling renewed bullish momentum after several sessions of compression. This move comes as traders price in slowing US inflation and increasing confidence that the Federal Reserve could pause or even ease monetary policy in the coming months.
🔹 Macro Drivers Supporting Gold:
US CPI & PPI softness → Indicates cooling inflation, reinforcing expectations for stable or lower rates.
Treasury yields steady, while a weaker USD provides an additional tailwind for gold prices.
Geopolitical tensions and central bank accumulation continue to underpin long-term bullish sentiment.
⚠ Risk: Liquidity sweeps remain a possibility ahead of next week’s Fed meeting—watch for false breakouts and sharp reversals.
🔑 Key Technical Levels (H1)
Immediate Resistance: 3,654.17 (React Zone FIB)
OBS Sell Zone: 3,664.52
Upper Liquidity Target: 3,679.31
Major Sell Liquidity: 3,709.85
Supports / Buy Liquidity Zones:
• 3,637.91 – Breakout Retest
• 3,631.63 – CP Support
• 3,622.41 – Deeper Liquidity Layer
• 3,584.78 – END Liquidity BUY ZONE
📈 Scenario & Outlook
London Session: Expect a retest of breakout zones (3,638–3,632) for liquidity collection before another potential leg higher.
A clean break through 3,654 → 3,664 could trigger fresh buying momentum toward 3,679–3,709.
Failure to hold 3,622 would expose deeper support at 3,584 as the next key level.
📌 Trading Plan
🔵 BUY ZONE 1: 3,635 – 3,633
SL: 3,629
TP: 3,640 → 3,645 → 3,650 → 3,660 → 3,670 → ???
🔵 BUY ZONE 2: 3,621 – 3,619
SL: 3,615
TP: 3,625 → 3,630 → 3,635 → 3,640 → 3,650 → 3,660 → ???
🔴 SELL ZONE: 3,708 – 3,710
SL: 3,715
TP: 3,704 → 3,700 → 3,695 → 3,690 → 3,680 → ???
🔴 SELL SCALP: 3,679 – 3,681
SL: 3,685
TP: 3,675 → 3,670 → 3,665 → 3,660 → ???
✅ Summary
Gold is holding its breakout above key levels, supported by softer US inflation data and a weaker USD. Liquidity sweeps may occur in the near term, but the broader trend remains bullish as long as 3,622 holds.
👉 Follow MMFLOW TRADING for real-time updates, liquidity scenarios, and BIGWIN trade setups as gold reacts to macro drivers and critical technical zones.
A pullback is an opportunity, go long decisively!Yesterday, the technical analysis of gold first declined and then rose. It was suppressed below the 3650 mark during the Asian and European sessions and showed a continuous decline. It further accelerated its decline before the European and US sessions, breaking through the 3630 mark, and continued to decline to around 3613 to stabilize and rebound. It rebounded strongly during the US session and finally closed above the 3630 mark with a small negative fluctuation. The overall price still held the 3610 mark, forming a support and stabilization pattern. After the opening of today, gold once again rose and broke through the 3640 mark. In the short term, it has experienced continuous retracements to test the 3610 mark support, which is still valid. The long position at the daily level is continuing well, and it is expected to further impact the previous high of 3675 resistance area. Today, the short-term support below is around 3630-3620, and the important support is 3610. If it falls back to this position during the day, the main bullish trend will remain unchanged. The short-term bullish strong dividing line is 3600. If the daily level stabilizes above this position, the rhythm of falling back to low and long and following the trend will continue. The specific execution plan of the counter-trend short order will be updated as soon as possible according to the real-time trend, and I will remind everyone to respond flexibly to ensure that every step of the operation is carried out under controllable risks. Remember to pay attention in time.
Gold operation strategy: Go long when gold falls back to around 3630-3620, with the target at 3650-3660. Continue to hold if it breaks through.
