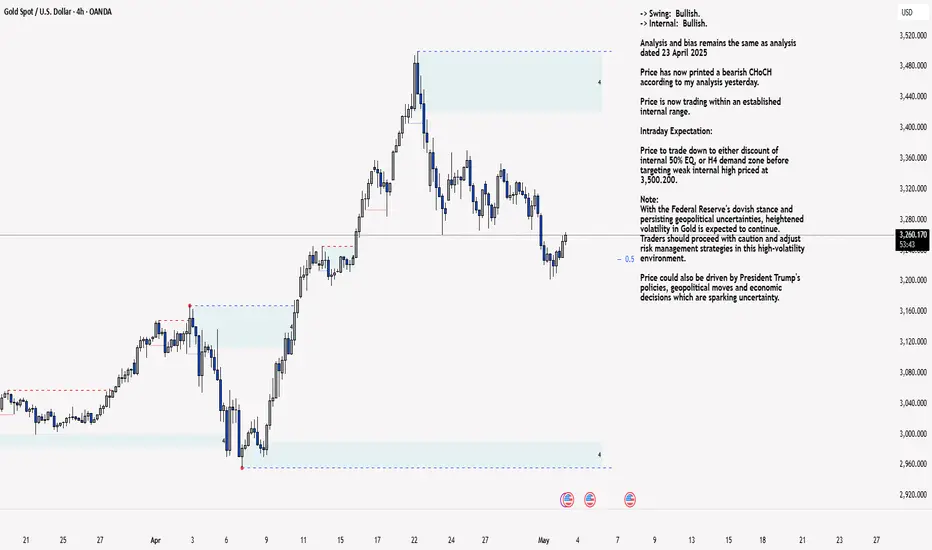
XAU/USD 12 May 2025 Intraday AnalysisH4 Analysis:
-> Swing: Bullish.
-> Internal: Bullish.
Analysis and bias remains the same as analysis dated 23 April 2025
Price has now printed a bearish CHoCH according to my analysis yesterday.
Price is now trading within an established internal range.
Intraday Expectation:
Price to trade down to either discount of internal 50% EQ, or H4 demand zone before targeting weak internal high priced at 3,500.200.
Note:
With the Federal Reserve's dovish stance and persisting geopolitical uncertainties, heightened volatility in Gold is expected to continue. Traders should proceed with caution and adjust risk management strategies in this high-volatility environment.
Price could also be driven by President Trump's policies, geopolitical moves and economic decisions which are sparking uncertainty.
H4 Chart:
M15 Analysis:
-> Swing: Bullish.
-> Internal: Bullish.
As mentioned previously mentioned that I would continue to monitor price and depth of bearish pullback following previous bullish iBOS.
Price did not pull back with any significance, therefore, I will apply discretion and not mark the previous iBOS. I have however marked this in red.
Price continued bullish and subsequently printed a bearish iBOS to indicate, but not confirm bearish pullback phase initiation.
Price is now trading within an established internal range, however, I will continue to monitor depth of pullback.
Intraday Expectation:
Price to trade down to either discount of internal 50% EQ, or M15 supply zones before targeting weak internal high priced at 3,435.055.
Alternative scenario:
Price has this far failed to target to target weak internal high, as has H4 TF. This could be related to the fact that all higher timeframes remain in corrective bearish pullback phase initiation, therefore, it should not come as a surprise if price prints a bearish iBOS.
Note:
Gold price volatility is expected to remain heightened due to the Federal Reserve’s dovish approach and persistent geopolitical uncertainties. Traders should remain vigilant, fine-tune their risk management strategies, and be prepared for potential price fluctuations in this highly volatile market. Additionally, recent tariff announcements by former President Trump are likely to exacerbate market instability, leading to further price swings.
M15 Chart:
Goldupdate

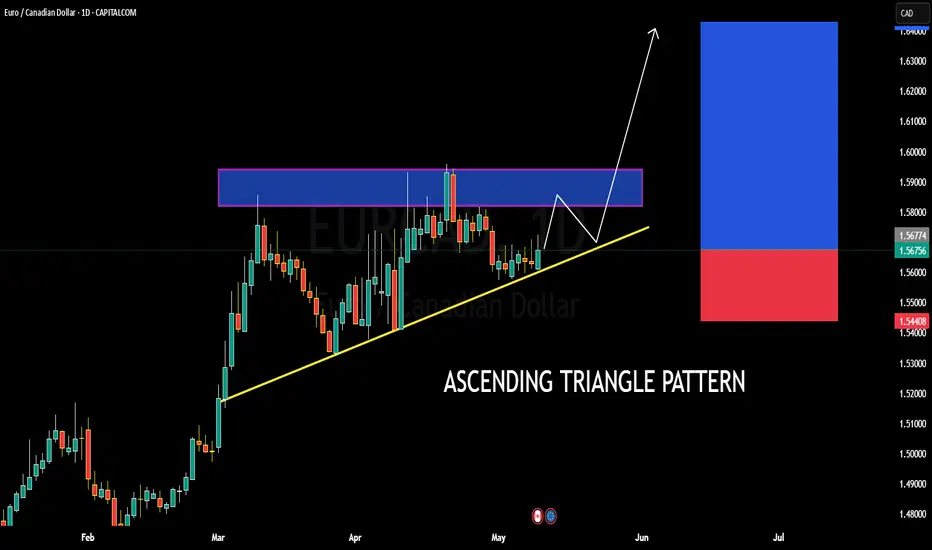
EURCAD BULLISH OR BEARISH DETAILED ANALYSISEURCAD is currently trading around 1.5600 and is consolidating within a textbook ascending triangle pattern on the daily timeframe. This setup signals a strong bullish bias as the pair continues to form higher lows, tightening under a key horizontal resistance zone between 1.5730 and 1.5770. Price is respecting the ascending trendline very well, indicating buyer strength. A breakout above this resistance zone could open the doors for a clean rally toward the 1.6400 psychological level, offering a strong risk-to-reward opportunity.
From a fundamental standpoint, the euro is gaining traction as recent Eurozone economic indicators suggest improving sentiment and a potential shift in ECB tone toward neutral. Meanwhile, the Canadian dollar remains pressured by falling crude oil prices and softening domestic data, including disappointing employment numbers this week. This divergence in fundamentals aligns well with the bullish technical structure for EURCAD, creating a high-probability scenario for buyers.
Looking ahead, a confirmed breakout above 1.5770 with volume could trigger a strong bullish impulse. The measured move from the triangle’s base supports a projection toward the 1.6400 area, making this setup attractive for swing traders aiming to ride the next leg higher. Risk should remain controlled below 1.5440, where the ascending structure would be invalidated.
I’m closely monitoring the price action near the breakout zone. Patience is key, but once we see bullish momentum pushing through the resistance, this trade setup has the potential to deliver a solid upside run. EURCAD remains one of my top bullish forex plays going into mid-May.
EURJPY BULLISH OR BEARISH DETAILED ANALYSIS ??EURJPY is currently trading around 162.800 and showing clear bullish momentum after a clean bounce off a strong support zone. Price has been consolidating above a well-established demand area, and today's candle confirms renewed buyer interest. The reaction from this level highlights a potential shift back to the upside, with 169.000 marked as the next significant target. The rejection wicks and structure suggest accumulation, with the market gearing up for a bullish continuation.
From a fundamental perspective, the euro is gaining strength on the back of better-than-expected economic data across the eurozone, while the Japanese yen continues to face broad pressure due to the Bank of Japan's dovish stance. The BOJ remains committed to ultra-loose monetary policy, which puts the yen at a disadvantage against stronger currencies like the euro, especially when inflation expectations in Europe remain sticky.
Technically, EURJPY has respected this support zone multiple times, creating a solid base of demand. Each test has been met with higher lows, reinforcing the bullish bias. The price action is forming a classic support-retest continuation pattern, and if this structure holds, we could see a swift move toward 169.000. Volume and momentum indicators are also beginning to align in favor of the bulls.
Looking forward, as long as price holds above the 162.200 area, the path of least resistance remains upward. Traders will be watching for continuation signals and breakouts of minor resistance zones to confirm the move. This setup offers a favorable risk-reward structure, and with market sentiment tilting toward euro strength, EURJPY has the potential to deliver solid gains in the coming sessions.

XAUUSD Bullish or bearish Detailed AnalysisXAUUSD is currently trading around 3380, continuing its bullish momentum as previously anticipated. The price action has followed the projected path, delivering substantial profits for those positioned early. The next key resistance level is at 3450, aligning with the upper boundary of the ascending channel.
Fundamentally, gold's rally is supported by heightened safe-haven demand amid ongoing geopolitical tensions and a weakening U.S. dollar. Investors are closely watching the upcoming Federal Reserve meeting, with expectations leaning toward a dovish stance, which could further bolster gold prices .
Technical indicators suggest that the bullish trend remains intact, with the price maintaining its position above key moving averages. However, traders should be cautious of potential pullbacks as the market approaches overbought conditions.
In summary, XAUUSD is on track toward the 3450 target, supported by both technical and fundamental factors. Traders should monitor key resistance levels and macroeconomic developments to manage their positions effectively.

XAU/USD 02 May 2025 Intraday AnalysisH4 Analysis:
-> Swing: Bullish.
-> Internal: Bullish.
Analysis and bias remains the same as analysis dated 23 April 2025
Price has now printed a bearish CHoCH according to my analysis yesterday.
Price is now trading within an established internal range.
Intraday Expectation:
Price to trade down to either discount of internal 50% EQ, or H4 demand zone before targeting weak internal high priced at 3,500.200.
Note:
With the Federal Reserve's dovish stance and persisting geopolitical uncertainties, heightened volatility in Gold is expected to continue. Traders should proceed with caution and adjust risk management strategies in this high-volatility environment.
Price could also be driven by President Trump's policies, geopolitical moves and economic decisions which are sparking uncertainty.
H4 Chart:
M15 Analysis:
-> Swing: Bullish.
-> Internal: Bearish.
As mentioned in yesterday's analysis dated 01 May 2025 whereby I mentioned that I would continue to monitor price and depth of bullish pullback following the printing of a bearish iBOS followed by a bullish CHoCH.
Price did not pullback significantly enough to warrant a further bearish iBOS, therefore, I will apply discretion and not classify this as such, I have however marked in red.
Price has since continued bearish, subsequently printing a bullish CHoCH.
Internal structure is now established, however, I will continue to monitor price regarding depth of pullback as previous.
Intraday Expectation:
Price to trade up to either premium of internal 50% EQ, or M15 supply zone before targeting weak internal low priced at 3,201.955
Note:
With the Federal Reserve maintaining a dovish stance and ongoing geopolitical tensions, volatility in Gold prices is expected to remain elevated. Traders should exercise caution, adjust risk management strategies, and stay prepared for potential price whipsaws in this high-volatility environment.
Trump's tariff announcement will most likely cause considerably increased volatility and whipsaws.
M15 Chart:
XAUUSD DETAILED ANALYSIS TECHNICAL AND FUNDAMENTALS XAUUSD is currently trading around the 3256 level and is clearly respecting a descending channel on the 1-hour timeframe. The price is now pushing higher from the lower boundary of the channel, suggesting short-term bullish momentum. Based on the current technical structure, I am anticipating a clean breakout above the channel resistance, with the next key target at 3300. The marked purple resistance zone around 3310–3320 also acts as a magnet for price once the breakout is confirmed.
On the fundamental side, gold remains supported by ongoing geopolitical uncertainty and speculation around the Fed's next rate decision. With recent U.S. economic data showing mixed signals—strong labor market figures but slowing inflation momentum—the market is pricing in fewer rate hikes, which weakens the USD and favors upside in XAUUSD. Additionally, central bank gold demand remains strong globally, acting as a long-term support for bullion.
Traders are currently reacting to a softening dollar index and treasury yields, which further underpins bullish sentiment in gold. A clear break above the upper boundary of this channel, ideally with strong volume confirmation, could set the stage for a swift move to retest the 3300 psychological level. From a risk-reward perspective, the breakout trade setup here aligns well with institutional strategies that favor trend continuation post-consolidation.
In summary, XAUUSD is trading inside a clean descending channel, with buyers stepping in aggressively near the support zone. A breakout above the structure could trigger a bullish continuation move toward 3300, backed by strong macro tailwinds and technical confirmation. This setup offers an excellent opportunity for swing traders to capitalize on short-term momentum. Are you also tracking gold fundamentals this week?

Gold Price (XAUUSD) Retesting Fibonacci Support ZoneGold (XAUUSD) is currently in a technical phase that aligns with a classic **retesting formation**, where price action returns to previous support levels before resuming its bullish trend. After hitting a recent high near 3,350–3,400, gold has begun a healthy retracement, with key Fibonacci levels acting as potential demand zones. The 3,200–3,150 range appears to be a strong support zone, and if this level holds, it could trigger the next leg up in the bullish trend. Volume remains supportive, suggesting market interest is still intact, and buyers may be preparing for re-entry.
This consolidation phase could offer an excellent opportunity for smart money accumulation, particularly as gold respects major technical levels and Fibonacci retracement zones. From a macro perspective, continued geopolitical tensions, inflationary concerns, and central bank accumulation of gold provide a strong fundamental backdrop that supports a long-term bullish outlook. If gold maintains above the key 0.5 and 0.618 retracement levels, we could soon witness a new wave targeting the 3,350 to 3,400 resistance zone once again.
Market participants should watch for confirmation through bullish candlestick patterns and increasing volume in the coming sessions. A break above 3,275 would further validate bullish continuation and may serve as a trigger point for momentum traders. The broader trend remains intact, and current price action fits the pattern of a technical breather before the next impulsive rally.
✅ Show your support by hitting the like button and
✅ Leaving a comment below! (What is You opinion about this Coin)
Your feedback and engagement keep me inspired to share more insightful market analysis with you!

XAU/USD 01 May 2025 Intraday AnalysisH4 Analysis:
-> Swing: Bullish.
-> Internal: Bullish.
Analysis and bias remains the same as analysis dated 23 April 2025
Price has now printed a bearish CHoCH according to my analysis yesterday.
Price is now trading within an established internal range.
Intraday Expectation:
Price to trade down to either discount of internal 50% EQ, or H4 demand zone before targeting weak internal high priced at 3,500.200.
Note:
With the Federal Reserve's dovish stance and persisting geopolitical uncertainties, heightened volatility in Gold is expected to continue. Traders should proceed with caution and adjust risk management strategies in this high-volatility environment.
Price could also be driven by President Trump's policies, geopolitical moves and economic decisions which are sparking uncertainty.
H4 Chart:
M15 Analysis:
-> Swing: Bullish.
-> Internal: Bearish.
Price has printed as per my analysis dated 24 April 2025 by targeting weak internal low and printing a bearish iBOS.
Price has subsequently printed a bullish CHoCH to indicate, but not confirm bullish pullback phase initiation.
Internal structure is now established, however, I will continue to monitor price regarding depth of pullback.
Intraday Expectation:
Price to trade up to either premium of internal 50% EQ, or M15 supply zone before targeting weak internal low priced at 3,221.320
Note:
With the Federal Reserve maintaining a dovish stance and ongoing geopolitical tensions, volatility in Gold prices is expected to remain elevated. Traders should exercise caution, adjust risk management strategies, and stay prepared for potential price whipsaws in this high-volatility environment.
Trump's tariff announcement will most likely cause considerably increased volatility and whipsaws.
M15 Chart:

XAU/USD 25 April 2025 Intraday AnalysisH4 Analysis:
-> Swing: Bullish.
-> Internal: Bullish.
Analysis and bias remains the same as yesterday's analysis dated 23 April 2025
Price has now printed a bearish CHoCH according to my analysis yesterday.
Price is now trading within an established internal range.
Intraday Expectation:
Price to trade down to either discount of internal 50% EQ, or H4 demand zone before targeting weak internal high priced at 3,500.200.
Note:
With the Federal Reserve's dovish stance and persisting geopolitical uncertainties, heightened volatility in Gold is expected to continue. Traders should proceed with caution and adjust risk management strategies in this high-volatility environment.
Price could also be driven by President Trump's policies, geopolitical moves and economic decisions which are sparking uncertainty.
H4 Chart:
M15 Analysis:
-> Swing: Bullish.
-> Internal: Bearish.
Analysis and Bias remains the same as yesterday's analysis dated 24 April 2025.
Price printed as per my note yesterday whereby I mentioned that we should be surprised if price printed a bearish iBOS as all HTF's require a pullback.
Price subsequently printed a bearish iBOS which confirms internal structure.
Intraday Expectation:
Price has traded up to just short of premium of internal 50% EQ where we are seeing a reaction. Price could potentially trade further into premium of 50%, or H4/M15 nested supply zone before targeting weak internal low priced at 3,260.190.
Note:
With the Federal Reserve maintaining a dovish stance and ongoing geopolitical tensions, volatility in Gold prices is expected to remain elevated. Traders should exercise caution, adjust risk management strategies, and stay prepared for potential price whipsaws in this high-volatility environment.
Trump's tariff announcement will most likely cause considerably increased volatility and whipsaws.
M15 Chart:

XAU/USD 24 April 2025 Intraday AnalysisH4 Analysis:
-> Swing: Bullish.
-> Internal: Bullish.
Analysis and bias remains the same as yesterday's analysis dated 23 April 2025
Price has now printed a bearish CHoCH according to my analysis yesterday.
Price is now trading within an established internal range.
Intraday Expectation:
Price to trade down to either discount of internal 50% EQ, or H4 demand zone before targeting weak internal high priced at 3,500.200.
Note:
With the Federal Reserve's dovish stance and persisting geopolitical uncertainties, heightened volatility in Gold is expected to continue. Traders should proceed with caution and adjust risk management strategies in this high-volatility environment.
Price could also be driven by President Trump's policies, geopolitical moves and economic decisions which are sparking uncertainty.
H4 Chart:
M15 Analysis:
-> Swing: Bullish.
-> Internal: Bearish.
Price printed as per my note yesterday whereby I mentioned that we should be surprised if price printed a bearish iBOS as all HTF's require a pullback.
Price subsequently printed a bearish iBOS which confirms internal structure.
Intraday Expectation:
Price has traded up to just short of premium of internal 50% EQ where we are seeing a reaction. Price could potentially trade further into premium of 50%, or H4/M15 nested supply zone before targeting weak internal low priced at 3,260.190.
Note:
With the Federal Reserve maintaining a dovish stance and ongoing geopolitical tensions, volatility in Gold prices is expected to remain elevated. Traders should exercise caution, adjust risk management strategies, and stay prepared for potential price whipsaws in this high-volatility environment.
Trump's tariff announcement will most likely cause considerably increased volatility and whipsaws.
M15 Chart:

Gold Updates April 17th ahead of Unemployment Claims🧠 Updated Structure & Trend (April 17 – Pre-Weekend Trading)
✅ HTF (D1, H4): Price has made a new all-time high at 3357, extending the bullish run — but we're now deep in premium exhaustion territory.
🟠 M30–H1: First signs of distribution and internal CHoCH on M15 are showing. No follow-through above ATH. Price is stalling, likely waiting for NY volume.
⚠️ Volatility is low, and Friday is a market holiday, so any manipulation or rejection will likely happen today.
🔼 New ATH: 3357
This makes previous zones like 3333–3340 less relevant for traps.
Focus shifts to the true inducement zone:
🔻 3355–3365 → Main sniper short zone, valid only with clear M5 structure (BOS or reversal FVG).
🔻 Key Sell Zones (Updated):
3355–3365 → Final inducement / exhaustion zone near new ATH
3342–3345 → OB retest below weak high, valid only if confirmed with bearish PA on M5
🟢 Key Buy Zones (Same):
3284–3288 → OB + FVG + discount zone
3260–3265 → H1 equilibrium and last clean demand
3230–3235 → Deeper reentry zone if we get a flash crash before NY
📊 Trading Logic:
If NY session spikes again into 3355–3365, we're ready to snipe with precision.
If price fails to reclaim 3345 and breaks M5 structure, we target early shorts.
On a clean dump, we look for longs in the 3280–3260 range, with confirmation.
📌 Important Notice!!!
The above analysis is for educational purposes only and does not constitute financial advice. Always compare with your plan and wait for confirmation before taking action.

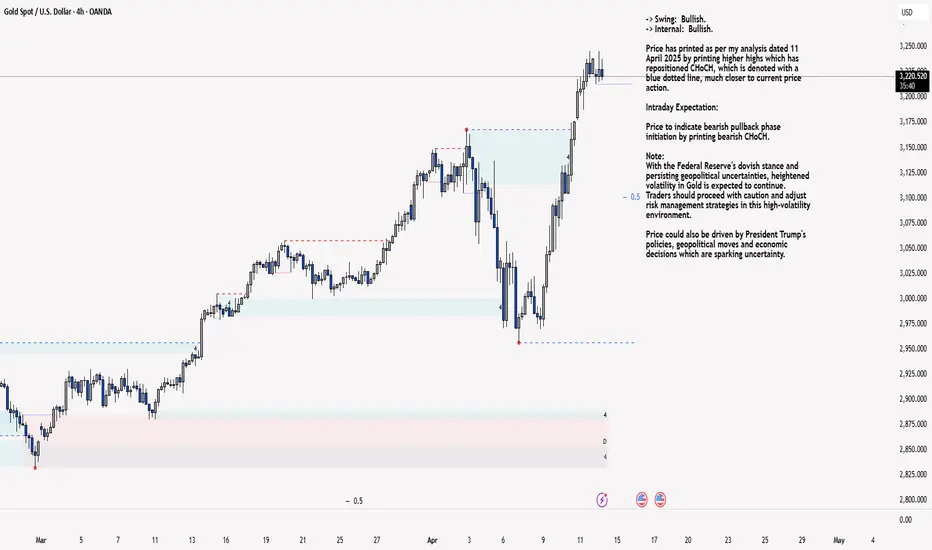
XAU/USD 14 April 2025 Intraday AnalysisH4 Analysis:
-> Swing: Bullish.
-> Internal: Bullish.
Price has printed as per my analysis dated 11 April 2025 by printing higher highs which has repositioned CHoCH, which is denoted with a blue dotted line, much closer to current price action.
Intraday Expectation:
Price to indicate bearish pullback phase initiation by printing bearish CHoCH.
Note:
With the Federal Reserve's dovish stance and persisting geopolitical uncertainties, heightened volatility in Gold is expected to continue. Traders should proceed with caution and adjust risk management strategies in this high-volatility environment.
Price could also be driven by President Trump's policies, geopolitical moves and economic decisions which are sparking uncertainty.
H4 Chart:
M15 Analysis:
-> Swing: Bullish.
-> Internal: Bullish.
As mentioned in previous analysis that I will continue to monitor internal structure following the printing of a bearish CHoCH.
Due to the extreme bullishness of the market I will be mapping internal structure as it appears.
The reasoning behind this due to the fact of the increasing range of the internal structure. By mapping internal structure as it appears we are more likely to be in a good position to have an early warning of all HTF bearish pullback phase initiations.
Price has printed a double bullish iBOS since last analysis and we are now trading within an establish internal range where you will note that price has printed a double top and has been unable to close above weak internal high.
Intraday Expectation:
Technically price should target weak internal high priced at 3,244.340.
Alternative scenario:
Due to the narrowing of internal range, it could be a potential early signal that all HTF's are beginning their bearish pullback phase initiation. I would therefore not be surprised if price printed a bearish iBOS.
Note:
With the Federal Reserve maintaining a dovish stance and ongoing geopolitical tensions, volatility in Gold prices is expected to remain elevated. Traders should exercise caution, adjust risk management strategies, and stay prepared for potential price whipsaws in this high-volatility environment.
Trump's tariff announcement will most likely cause considerably increased volatility and whipsaws.
M15 Chart:
XAU/USD 10 April 2025 Intraday Analysis H4 Analysis:
-> Swing: Bullish.
-> Internal: Bullish.
Analysis and bias remains the same as analysis dated 04 April 2025.
Since last analysis price has printed a bearish CHoCH which is the first indication, but not confirmation of bearish pullback phase initiation.
Price is now trading within an established internal range.
Intraday Expectation:
Price to trade down to either discount of internal 50% EQ, or H4 demand zone before targeting weak internal high priced at 3,187,835
Note:
With the Federal Reserve's dovish stance and persisting geopolitical uncertainties, heightened volatility in Gold is expected to continue. Traders should proceed with caution and adjust risk management strategies in this high-volatility environment.
Price could also be driven by President Trump's policies, geopolitical moves and economic decisions which are sparking uncertainty.
H4 Chart:
M15 Analysis:
-> Swing: Bullish.
-> Internal: Bullish.
Price has printed as I mentioned in yesterday's analysis whereby I commented that it would be worthwhile to note that price could potentially print a bullish iBOS as H4 TF has printed a bullish reaction from discount of 50% EQ.
Price subsequently printed a bearish CHoCH, however, price quickly once again formed a higher high, therefore, I will apply discretion and not classify previous CHoCH in order not to distort internal structure as the move was most probably an outlier due to Trump announcing 90 day pause on tariffs.
Price has printed a further bearish CHoCH, however, I will continue to monitor price.
Price is now trading within an established internal range.
Intraday Expectation:
Price to continue bearish, react at either discount of 50% internal EQ, or M15 demand zone, of which one is well positioned at 50% of internal EQ, before targeting weak internal high priced at 3,132.630
Note:
With the Federal Reserve maintaining a dovish stance and ongoing geopolitical tensions, volatility in Gold prices is expected to remain elevated. Traders should exercise caution, adjust risk management strategies, and stay prepared for potential price whipsaws in this high-volatility environment.
Trump's tariff announcement will most likely cause considerably increased volatility and whipsaws.
M15 Chart:

WHY EURUSD IS BULLISH ?? DETAILED ANALYSISEURUSD has officially broken out of a clean bullish pennant pattern on the 4H chart, confirming the bullish momentum that has been building over the past week. After a sharp rally, price consolidated within a contracting range, forming the classic pennant shape. With the breakout now confirmed and price currently trading at 1.106, I’m anticipating a continuation toward the projected target at 1.143 — offering a potential 300+ pip gain in this move.
Technically, the breakout is supported by increasing bullish volume, strong impulse candles, and a clear structure of higher lows. The pennant served as a healthy consolidation zone, allowing buyers to regain control before the next leg up. Price has respected support at 1.096 and is now printing bullish continuation signals with momentum indicators pointing north.
Fundamentally, today’s market sentiment favors EUR strength, especially as the US dollar comes under pressure due to rising expectations of Federal Reserve rate cuts later in the year. Inflation data in the eurozone remains sticky, supporting the ECB’s cautious stance on monetary easing. Meanwhile, weaker US labor market data and softening retail figures are weighing on dollar demand.
With both technicals and fundamentals aligned, I’m expecting further upside on EURUSD. The structure is solid, the breakout is clean, and sentiment supports continued bullish flow. I’ll be holding my bias firmly bullish unless the price falls back below 1.096, which would invalidate the setup. For now, all eyes are on 1.120 short term and eventually 1.143 as the full pennant projection completes.

WHY XAUUSD IS BULLISH ?? TECHNICAL AND FUNDAMENTALSXAUUSD is currently trading around the key psychological level of 3000, and as expected, price action has just completed a textbook retest of the previous breakout zone. The support level near 2960–2980 has held strongly, giving gold the momentum it needs for the next leg up. Price has reacted with a clear bullish bounce from this demand zone, confirming the structure and setting up for a potential continuation toward the 3100 target.
From a technical perspective, we’re seeing a classic bullish continuation move. The previous impulse to the upside was followed by a correction phase, which respected the support area now acting as a launchpad. This bounce, combined with strong candle formations on the 12H and daily charts, suggests bulls are regaining control. Volume is gradually increasing, aligning with the anticipated breakout from the recent consolidation.
On the fundamentals side, the gold market remains well-supported. Recent macroeconomic data shows inflationary pressures are still lingering, while expectations for Federal Reserve rate cuts later in the year continue to weigh on the US dollar. Geopolitical tensions and increased central bank gold accumulation are adding further demand for safe-haven assets like gold. These drivers remain bullish catalysts as long as uncertainty stays elevated and real yields remain low.
With price holding above 3000 and a strong structure in place, I expect continuation toward 3100 in the near term. This is a high-probability setup supported by both technicals and fundamentals. I’ll be closely watching for higher lows and continuation signals above 3020 for additional confirmation. Risk management remains key, but the market structure strongly favors further upside.

XAU/USD 24 March 2025 Intraday AnalysisH4 Analysis:
-> Swing: Bullish.
-> Internal: Bullish.
Bias and analysis remains the same as analysis dated 23 March 2025.
Price has printed a bearish CHoCH following printing further all time highs.
Price is now trading within an established internal range. I will however continue to monitor price.
Intraday Expectation:
Price to trade down to either discount of internal 50% EQ, or nested Daily and H4 demand levels before targeting weak internal high priced at 3,057.590.
Note:
With the Federal Reserve's dovish stance and persisting geopolitical uncertainties, heightened volatility in Gold is expected to continue. Traders should proceed with caution and adjust risk management strategies in this high-volatility environment.
Price could also be driven by President Trump's policies, geopolitical moves and economic decisions which are sparking uncertainty.
H4 Chart:
M15 Analysis:
-> Swing: Bullish.
-> Internal: Bearish.
As per analysis dated 19 March 2025 whereby I mentioned as an alternative scenario that internal range has significantly narrowed. All HTF's require a pullback, therefore, it would be completely viable if price printed a bearish iBOS.
This is how price printed, by printing a bearish iBOS.
Price has yet to print a bullish CHoCH to indicate bullish pullback phase initiation, however, price has traded into premium of 50% internal EQ, therefore, I am happy to confirm internal range.
Intraday Expectation:
Price has traded in to premium of 50% EQ and has mitigated M15 supply zone.
Technically, price to target weak internal low priced at 2,999.465.
Note:
With the Federal Reserve maintaining a dovish stance and ongoing geopolitical tensions, volatility in Gold prices is expected to remain elevated. Traders should exercise caution, adjust risk management strategies, and stay prepared for potential price whipsaws in this high-volatility environment.
M15 Chart:

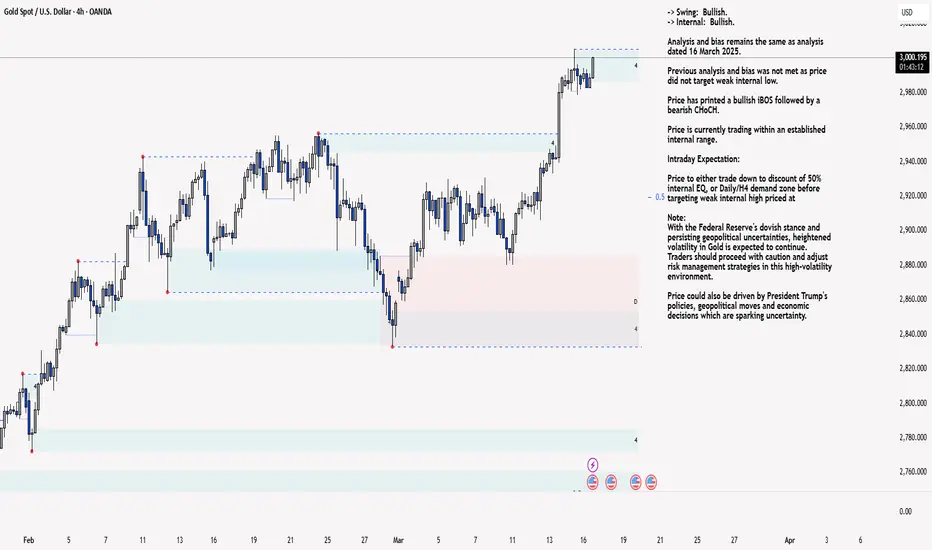
XAU/USD 17 March 2025 Intraday AnalysisH4 Analysis:
-> Swing: Bullish.
-> Internal: Bullish.
Analysis and bias remains the same as analysis dated 16 March 2025.
Previous analysis and bias was not met as price did not target weak internal low.
Price has printed a bullish iBOS followed by a bearish CHoCH.
Price is currently trading within an established internal range.
Intraday Expectation:
Price to either trade down to discount of 50% internal EQ, or Daily/H4 demand zone before targeting weak internal high priced at
Note:
With the Federal Reserve's dovish stance and persisting geopolitical uncertainties, heightened volatility in Gold is expected to continue. Traders should proceed with caution and adjust risk management strategies in this high-volatility environment.
Price could also be driven by President Trump's policies, geopolitical moves and economic decisions which are sparking uncertainty.
H4 Chart:
M15 Analysis:
-> Swing: Bullish.
-> Internal: Bullish.
Price has printed a bearish CHoCH confirming internal range, however, price has not in any way pulled back significantly enough to classify current internal high as an iBOS, should price print higher than current internal high.
Remainder of analysis and bias remains the same as yesterday's analysis dated 13 March 2025
Analysis and bias has not been met, largely due macroeconomic events, particularly the Trump trade tariff war, which is causing uncertainty within the markets which is supporting Gold price.
Price has printed a bullish iBOS.
Within the structure following the iBOS, price has printed a several bearish CHoCH's with very minimal pullbacks before continuing bullish.
In order not to distort internal structure range I will apply discretion and not classify bearish CHoCH without considerable pullback.
Intraday Expectation:
Await for price to print Bearish CHoCH which is supported by a pullback relative to recent price action.
Note:
With the Federal Reserve maintaining a dovish stance and ongoing geopolitical tensions, volatility in Gold prices is expected to remain elevated. Traders should exercise caution, adjust risk management strategies, and stay prepared for potential price whipsaws in this high-volatility environment.
M15 Chart:
AUDUSD BULLISH OR BEARISH ??? DETAILED ANALYSISAUDUSD is currently trading around 0.62900 and forming a **bearish flag pattern**, a well-known continuation pattern that suggests further downside momentum. After a sharp downward move, price action is consolidating within a parallel channel, indicating a potential breakdown. If the bearish flag confirms with a breakout below the support zone, we could see a strong move toward 0.60900.
Technically, the **0.62500 level acts as a critical support**, and a breakdown below it could accelerate selling pressure. The next key support zone aligns around 0.62000, followed by the ultimate target of 0.60900. Volume confirmation and a decisive close below the flag's lower boundary will strengthen the bearish outlook. Traders should watch for price rejection near resistance levels and any signs of increased selling pressure.
From a fundamental perspective, the **us dollar remains strong amid hawkish Federal Reserve policy**, while risk-off sentiment is weighing on the australian dollar. Factors such as weaker economic data from China, declining commodity prices, and lower demand for high-yielding currencies could further drive audusd lower. Additionally, expectations of **RBA's monetary policy stance** and global risk trends will play a crucial role in shaping the pair’s direction.
In conclusion, audusd is on the verge of breaking out of a **bearish flag pattern**, signaling potential downside movement toward 0.60900. Traders should stay alert for a confirmed breakout with strong bearish momentum, as this setup offers a high-probability trade opportunity.

XAUUSD Bullish Pennant Breakout: Gold Aiming for 3020XAUUSD is currently consolidating around 2920, forming a **bullish pennant pattern**, a strong continuation signal indicating potential upside momentum. Gold has been in a steady uptrend, and this consolidation phase suggests that the market is gathering strength before the next move. A breakout above the pennant resistance could push prices toward the psychological level of **3000**, with an extended target of **3020**.
From a technical perspective, a **bullish pennant** is characterized by a brief consolidation after a strong rally, typically leading to another upward surge. If gold **breaks out with strong volume**, it could confirm further bullish momentum. **Key resistance levels** to watch are 2950 and 2970, while **strong support levels** are at 2900 and 2880. A successful breakout could attract more buyers, fueling a strong rally toward the **3020 level**.
On the **fundamental side**, gold remains well-supported by **geopolitical tensions, central bank gold purchases, and expectations of Federal Reserve rate adjustments**. If economic uncertainty increases or the Fed signals a more dovish stance, gold prices could gain further momentum. Additionally, a weaker **U.S. dollar and falling bond yields** could add fuel to the bullish case for XAUUSD.
In conclusion, XAUUSD is forming a **bullish pennant**, signaling a potential breakout toward 3020. **Traders should watch for volume confirmation and breakout signals above resistance levels** to enter positions strategically. If the breakout is confirmed, we can expect gold to gain further strength, presenting a great buying opportunity for traders.

XAU/USD 10 March 2025 Intraday AnalysisH4 Analysis:
-> Swing: Bullish.
-> Internal: Bearish.
Analysis/Bias remains the same as analysis dated 07 March 2024.
Price has printed a bullish CHoCH according to analysis and bias dated 28 February 2025.
Price is currently trading within an established internal range.
Intraday Expectation:
Price is now trading in premium of 50% internal EQ where we could see a reaction at any point. Price could also target H4 supply zone before targeting weak internal low, priced at 2,832.720
Note:
With the Federal Reserve's dovish stance and persisting geopolitical uncertainties, heightened volatility in Gold is expected to continue. Traders should proceed with caution and adjust risk management strategies in this high-volatility environment.
Price could also be driven by President Trump's policies, geopolitical moves and economic decisions which are sparking uncertainty.
H4 Chart:
M15 Analysis:
-> Swing: Bullish.
-> Internal: Bearish.
Analysis and bias remains the same as analysis dated 03 March 2023.
As mentioned in my analysis dated 28 February 2025, whereby price printed a bullish CHoCH but stated I would continue to monitor price.
On this occasion I have marked the previous bullish CHoCH in red as price did not pull back deeply enough to warrant internal structure breaks, additionally, there was minimal time spent .
Price has printed a further bullish CHoCH which is now confirmed. Price is not trading within an established internal range.
Intraday Expectation:
Price to continue bullish, react at either premium of internal 50% EQ, or M15 supply zone before targeting weak internal low priced at 2,832.720.
Note:
With the Federal Reserve maintaining a dovish stance and ongoing geopolitical tensions, volatility in Gold prices is expected to remain elevated. Traders should exercise caution, adjust risk management strategies, and stay prepared for potential price whipsaws in this high-volatility environment.
M15 Chart:

XAU/USD 04 March 2025 Intraday AnalysisH4 Analysis:
-> Swing: Bullish.
-> Internal: Bearish.
Price has printed a bullish CHoCH according to analysis and bias dated 28 February 2025.
Price is currently trading within an established internal range.
Intraday Expectation:
Price is now trading in premium of 50% internal EQ where we could see a reaction at any point. Price could also target H4 supply zone before targeting weak internal low, priced at 2,832.720
Note:
With the Federal Reserve's dovish stance and persisting geopolitical uncertainties, heightened volatility in Gold is expected to continue. Traders should proceed with caution and adjust risk management strategies in this high-volatility environment.
Price could also be driven by President Trump's policies, geopolitical moves and economic decisions which are sparking uncertainty.
H4 Chart:
M15 Analysis:
-> Swing: Bullish.
-> Internal: Bearish.
Analysis and bias remains the same as analysis dated 03 March 2023.
As mentioned in my analysis dated 28 February 2025, whereby price printed a bullish CHoCH but stated I would continue to monitor price.
On this occasion I have marked the previous bullish CHoCH in red as price did not pull back deeply enough to warrant internal structure breaks, additionally, there was minimal time spent .
Price has printed a further bullish CHoCH which is now confirmed. Price is not trading within an established internal range.
Intraday Expectation:
Price to continue bullish, react at either premium of internal 50% EQ, or M15 supply zone before targeting weak internal low priced at 2,832.720.
Note:
With the Federal Reserve maintaining a dovish stance and ongoing geopolitical tensions, volatility in Gold prices is expected to remain elevated. Traders should exercise caution, adjust risk management strategies, and stay prepared for potential price whipsaws in this high-volatility environment.
M15 Chart:

JUVUSDT: Descending Channel – 120%-130% Gains on Breakout!JUVUSDT is currently forming a Descending Channel pattern, and it is looking for a breakout in the near future. The Descending Channel is a bearish technical pattern where the price oscillates between parallel descending trendlines, indicating that the price is in a downtrend. However, the pattern often leads to a breakout to the upside once the price clears the upper resistance trendline. With strong volume backing the pattern, the breakout could signal the start of a major bullish move, potentially driving the price up by 120% to 130%+.
The good volume behind the Descending Channel formation shows that the market is actively watching this level. A breakout from a descending channel often leads to a sharp rally, as many traders will jump in once the price breaks through the upper resistance. The growing investor interest in JUVUSDT suggests that the market is becoming more optimistic about the potential upside. This increasing participation could fuel the breakout, pushing the price higher and leading to the anticipated 120% to 130%+ gain.
The potential for substantial gains in JUVUSDT becomes more apparent as the price nears the breakout point. The Descending Channel pattern is typically followed by a reversal, especially when the price breaks through the resistance and gains momentum. If JUVUSDT can maintain strength at these levels and break above the upper trendline of the channel, a bullish phase could begin, driving the price to new highs. With the increasing volume and investor interest, the projected 120% to 130%+ gain is within reach.
Traders should monitor the price closely as it approaches the resistance trendline, looking for confirmation of the breakout. A successful breakout above the Descending Channel could result in a swift upward movement, providing significant returns for those who position themselves ahead of the move. The combination of a clear technical setup, strong volume, and growing investor interest makes JUVUSDT a prime candidate for those seeking high-potential trades.
✅ Show your support by hitting the like button and
✅ Leaving a comment below!
Your feedback and engagement keep me inspired to share more insightful market analysis with you!

MOVEUSDT: Falling Wedge Pattern – 130%-140% Gains ExpectedMOVEUSDT is currently forming a Falling Wedge pattern, a bullish chart formation that signals the potential for a significant breakout. The Falling Wedge is a consolidation pattern where the price gradually narrows between converging trendlines, indicating that the market is coiling up for a possible explosive move. Although the breakout has not yet occurred, the setup is promising, and traders are anticipating a strong upward move once the price breaks through the upper trendline. With good volume supporting the formation, the breakout could lead to substantial gains in the range of 130% to 140%+.
The Falling Wedge pattern is a reliable indicator of an impending trend reversal, and the good volume accompanying this formation increases the likelihood of a successful breakout. When a price breaks above the resistance trendline, it often triggers a surge in buying activity, pushing the price higher. The growing investor interest in MOVEUSDT highlights that many traders are positioning themselves ahead of the anticipated move, ready to take advantage of the potential upside. With expectations of 130% to 140%+ gains, MOVEUSDT presents an exciting opportunity for those looking for high-reward setups in the market.
Investor confidence in MOVEUSDT is building as more participants notice the bullish potential of this setup. The volume accompanying the Falling Wedge formation suggests that there is enough market interest to drive the price higher once the breakout happens. If the price breaks above the upper trendline, it could see a sharp rally toward the projected gains, as further resistance levels are taken out. The current market sentiment, coupled with strong technical signals, positions MOVEUSDT as a strong candidate for an upward price movement.
Traders should stay alert and monitor the breakout point closely. Once MOVEUSDT clears the upper trendline with good volume, the move could trigger a chain reaction of buying, pushing the price toward the expected gain range. The combination of a well-formed technical pattern, solid volume, and increasing investor interest makes MOVEUSDT a crypto pair to watch closely for potential significant returns in the near future.
✅ Show your support by hitting the like button and
✅ Leaving a comment below!
Your feedback and engagement keep me inspired to share more insightful market analysis with you!
