XAU/USD 17 November 2025 Intraday AnalysisH4 Analysis:
-> Swing: Bullish.
-> Internal: Bullish.
Analysis and bias remains the same as analysis dated 20 October 2025.
Price has printed as per previous intraday expectation by printing a bearish CHoCH which indicates, but not confirms, bullish pullback phase initiation.
Price is currently trading within an established internal range, however, I will continue to monitor price with regards to depth of pullback.
Intraday expectation:
Price to continue bearish, react at either discount of 50% internal EQ, or H4 supply zone before targeting weak internal high priced at 4,380.990.
Note:
The Federal Reserve’s sustained dovish stance, coupled with ongoing geopolitical uncertainties, is likely to prolong heightened volatility in the gold market. Given this elevated risk environment, traders should exercise caution and recalibrate risk management strategies to navigate potential price fluctuations effectively.
Additionally, gold pricing remains sensitive to broader macroeconomic developments, including policy decisions under President Trump. Shifts in geopolitical strategy and economic directives could further amplify uncertainty, contributing to market repricing dynamics.
H4 Chart:
M15 Analysis:
-> Swing: Bullish.
-> Internal: Bullish.
As per analysis dated 14 November 2025, price has printed a bearish CHoCH to indicate, but not confirm bearish pullback phase initiation.
Price is currently trading within an established internal range.
Intraday expectation:
Price to trade down to either discount of 50% internal EQ, or M15 demand zone before targeting weak internal high, priced at 4,245.195
Note:
Gold remains highly volatile amid the Federal Reserve's continued dovish stance, persistent and escalating geopolitical uncertainties. Traders should implement robust risk management strategies and remain vigilant, as price swings may become more pronounced in this elevated volatility environment.
Additionally, President Trump’s tariff announcements, particularly against China, are expected to further amplify market turbulence, potentially triggering sharp price fluctuations and whipsaws.
M15 Chart:
Goldusd

XAU/USD 14 November 2025 Intraday AnalysisH4 Analysis:
-> Swing: Bullish.
-> Internal: Bullish.
Analysis and bias remains the same as analysis dated 20 October 2025.
Price has printed as per previous intraday expectation by printing a bearish CHoCH which indicates, but not confirms, bullish pullback phase initiation.
Price is currently trading within an established internal range, however, I will continue to monitor price with regards to depth of pullback.
Intraday expectation:
Price to continue bearish, react at either discount of 50% internal EQ, or H4 supply zone before targeting weak internal high priced at 4,380.990.
Note:
The Federal Reserve’s sustained dovish stance, coupled with ongoing geopolitical uncertainties, is likely to prolong heightened volatility in the gold market. Given this elevated risk environment, traders should exercise caution and recalibrate risk management strategies to navigate potential price fluctuations effectively.
Additionally, gold pricing remains sensitive to broader macroeconomic developments, including policy decisions under President Trump. Shifts in geopolitical strategy and economic directives could further amplify uncertainty, contributing to market repricing dynamics.
H4 Chart:
M15 Analysis:
-> Swing: Bullish.
-> Internal: Bullish.
As per yesterday's analysis, price has printed a bearish CHoCH to indicate, but not confirm bearish pullback phase initiation.
Price is currently trading within an established internal range.
Intraday expectation:
Price to trade down to either discount of 50% internal EQ, or M15 demand zone before targeting weak internal high, priced at 4,245.195
Note:
Gold remains highly volatile amid the Federal Reserve's continued dovish stance, persistent and escalating geopolitical uncertainties. Traders should implement robust risk management strategies and remain vigilant, as price swings may become more pronounced in this elevated volatility environment.
Additionally, President Trump’s tariff announcements, particularly against China, are expected to further amplify market turbulence, potentially triggering sharp price fluctuations and whipsaws.
M15 Chart:

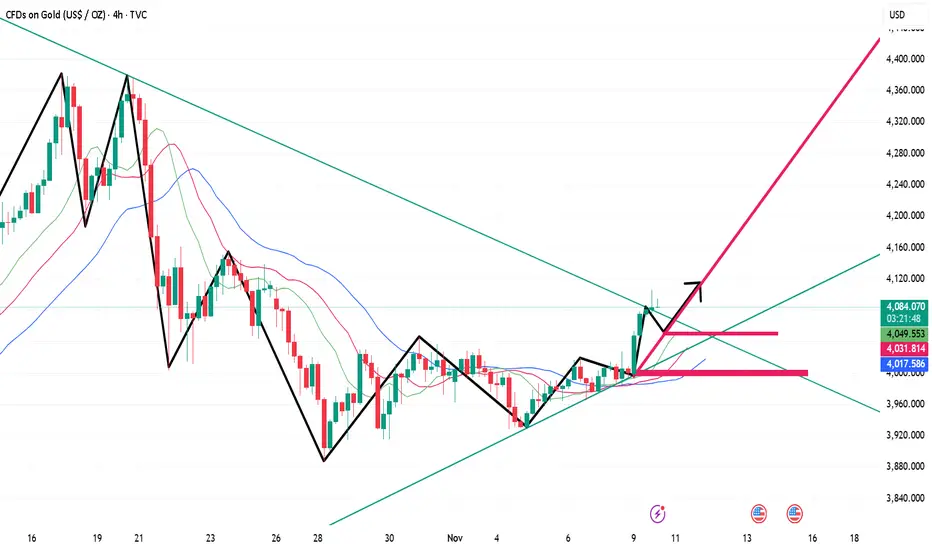
Gold US Session Short-Term Technical Analysis Guide (November 13Gold is currently trending slightly higher on the 4-hour chart, maintaining a slightly bullish bias along the short-term moving averages. The price is currently trading near the previous resistance zone, but there hasn't been much room for a pullback. We should be wary of a potential continuation of the upward trend during the European and American sessions. On the hourly chart, after a second upward move from the highs, it's currently consolidating in a narrow range with insufficient momentum. We should watch for a pullback before a continuation of the upward trend. There's some divergence on the smaller timeframes; we should monitor the short-term correction and recovery.
XAU/USD 13 November 2025 Intraday AnalysisH4 Analysis:
-> Swing: Bullish.
-> Internal: Bullish.
Analysis and bias remains the same as analysis dated 20 October 2025.
Price has printed as per previous intraday expectation by printing a bearish CHoCH which indicates, but not confirms, bullish pullback phase initiation.
Price is currently trading within an established internal range, however, I will continue to monitor price with regards to depth of pullback.
Intraday expectation:
Price to continue bearish, react at either discount of 50% internal EQ, or H4 supply zone before targeting weak internal high priced at 4,380.990.
Note:
The Federal Reserve’s sustained dovish stance, coupled with ongoing geopolitical uncertainties, is likely to prolong heightened volatility in the gold market. Given this elevated risk environment, traders should exercise caution and recalibrate risk management strategies to navigate potential price fluctuations effectively.
Additionally, gold pricing remains sensitive to broader macroeconomic developments, including policy decisions under President Trump. Shifts in geopolitical strategy and economic directives could further amplify uncertainty, contributing to market repricing dynamics.
H4 Chart:
M15 Analysis:
-> Swing: Bullish.
-> Internal: Bullish.
Price did not print according to my analysis. Price instead targeted strong internal high by printing a bullish iBOS.
This could potentially indicate H4 bearish pullback phase is complete.
Price has since printed a couple of bearish CHoCH's, however, I will not mark them as such due to very insignificant depth of pullback.
Intraday expectation:
Price to indicate bearish pullback phase initiation by printing a bearish CHoCH. CHoCH positioning is demoted with a blue horizontal dotted line.
Note:
Gold remains highly volatile amid the Federal Reserve's continued dovish stance, persistent and escalating geopolitical uncertainties. Traders should implement robust risk management strategies and remain vigilant, as price swings may become more pronounced in this elevated volatility environment.
Additionally, President Trump’s tariff announcements, particularly against China, are expected to further amplify market turbulence, potentially triggering sharp price fluctuations and whipsaws.
M15 Chart:

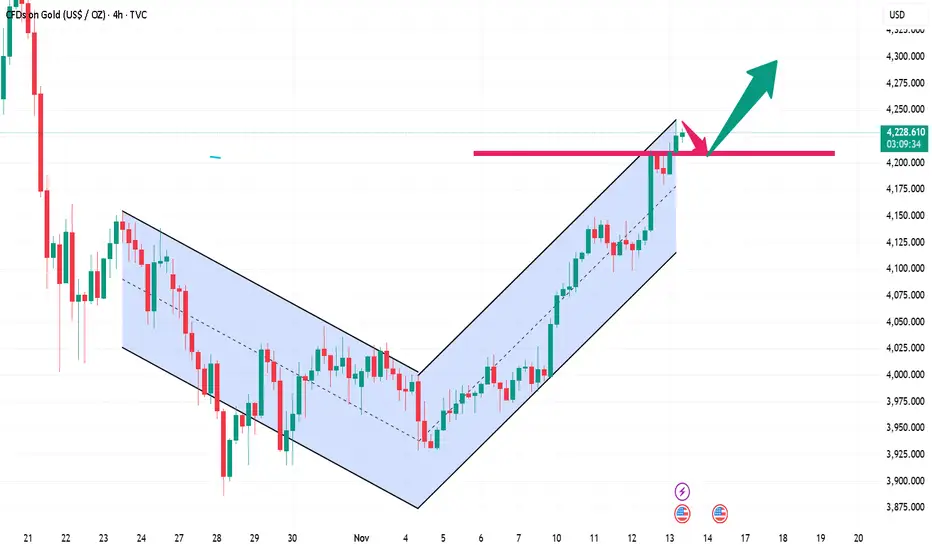
GOLD USD📊 GOLD / USD – 2H Technical Analysis
Price is currently trading around 4,195, still below the key 4,254 pressure zone.
The market remains in a clear bullish channel with momentum gradually slowing down as price approaches this critical area.
🔹 Current Structure:
The uptrend is still intact with higher highs and higher lows.
4,254 acts as a potential liquidity / reaction zone where short-term rejection or consolidation may occur.
If the price holds above 4,232 – 4,213, continuation toward the 4,336 – 4,370 supply zone is likely.
A strong rejection from 4,254 could trigger a correction toward 4,100 (major demand area).
🔹 Expected Scenario:
Price may first push up to test 4,254, then react with a minor pullback before continuing higher.
If momentum breaks through cleanly, bulls may target the 4,336 – 4,370 range.
📈 Bias: Bullish, but with caution near 4,254 (liquidity zone).
⚠️ Disclaimer:
This analysis represents personal opinion only and is not financial advice.
Always manage your own risk before taking any trades.

Gold prices fluctuated at high levels on November 12th; a short-Gold has recently surged, but some uncertainty has led to fluctuations at higher levels. After reaching a high of around 4145 today, it experienced a significant pullback, briefly touching a low of around 4098 before a rapid rebound. This forms a double bottom support level with yesterday's pullback to around 4097 in the US session. The key level to watch in the near term is 4100. A decisive break below this level would indicate further upside potential; otherwise, the bulls may experience further fluctuations. For tonight, consider buying around 4100/4105, and follow the trend after a breakout.
11/12 Gold Short-Term Trading Strategy:
Sell gold around 4138, with a stop-loss at 4146, targeting below 4120/10. If it breaks below 4100, continue selling with a target around 4070. Buy gold on a pullback around 4102/4, with a stop-loss at 4096, targeting above 4120/30.

Gold pullback on November 12th: Buy on dips!The hourly moving averages for gold continue their bullish crossover and upward divergence, indicating continued upward momentum. The 4-hour chart shows gold continuing its consolidation phase, likely preparing for a breakout above the resistance level of 4160. Gold may have dipped slightly below 4100 to around 4098 before rebounding. Buying on dips above 4098 is recommended.

XAU/USD 12 October 2025 Intraday AnalysisH4 Analysis:
-> Swing: Bullish.
-> Internal: Bullish.
Analysis and bias remains the same as analysis dated 20 October 2025.
Price has printed as per previous intraday expectation by printing a bearish CHoCH which indicates, but not confirms, bullish pullback phase initiation.
Price is currently trading within an established internal range, however, I will continue to monitor price with regards to depth of pullback.
Intraday expectation:
Price to continue bearish, react at either discount of 50% internal EQ, or H4 supply zone before targeting weak internal high priced at 4,380.990.
Note:
The Federal Reserve’s sustained dovish stance, coupled with ongoing geopolitical uncertainties, is likely to prolong heightened volatility in the gold market. Given this elevated risk environment, traders should exercise caution and recalibrate risk management strategies to navigate potential price fluctuations effectively.
Additionally, gold pricing remains sensitive to broader macroeconomic developments, including policy decisions under President Trump. Shifts in geopolitical strategy and economic directives could further amplify uncertainty, contributing to market repricing dynamics.
H4 Chart:
M15 Analysis:
-> Swing: Bullish.
-> Internal: Bearish.
You will note how price remains contained in consolidation between a supply and demand zone. The rest of my analysis and bias remains the same as bias date 29 October 2025.
As expected, price has printed a bullish CHoCH to indicate bullish pullback phase initiation.
Price is now trading within an established internal range.
Intraday expectation:
Price to continue bullish, react at either premium of internal 50% EQ or M15 demand zone before targeting weak internal low, priced at 3,886.465.
Note:
Gold remains highly volatile amid the Federal Reserve's continued dovish stance, persistent and escalating geopolitical uncertainties. Traders should implement robust risk management strategies and remain vigilant, as price swings may become more pronounced in this elevated volatility environment.
Additionally, President Trump’s tariff announcements, particularly against China, are expected to further amplify market turbulence, potentially triggering sharp price fluctuations and whipsaws.
M15 Chart:

XAU/USD 11 November 2025 Intraday AnalysisH4 Analysis:
-> Swing: Bullish.
-> Internal: Bullish.
Analysis and bias remains the same as analysis dated 20 October 2025.
Price has printed as per previous intraday expectation by printing a bearish CHoCH which indicates, but not confirms, bullish pullback phase initiation.
Price is currently trading within an established internal range, however, I will continue to monitor price with regards to depth of pullback.
Intraday expectation:
Price to continue bearish, react at either discount of 50% internal EQ, or H4 supply zone before targeting weak internal high priced at 4,380.990.
Note:
The Federal Reserve’s sustained dovish stance, coupled with ongoing geopolitical uncertainties, is likely to prolong heightened volatility in the gold market. Given this elevated risk environment, traders should exercise caution and recalibrate risk management strategies to navigate potential price fluctuations effectively.
Additionally, gold pricing remains sensitive to broader macroeconomic developments, including policy decisions under President Trump. Shifts in geopolitical strategy and economic directives could further amplify uncertainty, contributing to market repricing dynamics.
H4 Chart:
M15 Analysis:
-> Swing: Bullish.
-> Internal: Bearish.
You will note how price remains contained in consolidation between a supply and demand zone. The rest of my analysis and bias remains the same as bias date 29 October 2025.
As expected, price has printed a bullish CHoCH to indicate bullish pullback phase initiation.
Price is now trading within an established internal range.
Intraday expectation:
Price to continue bullish, react at either premium of internal 50% EQ or M15 demand zone before targeting weak internal low, priced at 3,886.465.
Note:
Gold remains highly volatile amid the Federal Reserve's continued dovish stance, persistent and escalating geopolitical uncertainties. Traders should implement robust risk management strategies and remain vigilant, as price swings may become more pronounced in this elevated volatility environment.
Additionally, President Trump’s tariff announcements, particularly against China, are expected to further amplify market turbulence, potentially triggering sharp price fluctuations and whipsaws.
M15 Chart:

Gold bulls are making a strong comeback; buy on dips and follow From the 4-hour chart, the current resistance level to watch is 4115-23, with a key resistance level at 4145. Short-term support is at 4060-68, with a key support level at the previous low of 4030-4035.
Gold Trading Strategy:
1. Buy gold on a pullback to 4063-68, add to the position on a pullback to 4047-55, stop loss at 4039, target 4100-4106, break above to 4120-28.
Gold has broken out strongly; watch for resistance at 4086-4096.Gold opened easily above 4035, showing strong bullish momentum. Short-term focus is on the 4086-96 range, which acts as short-term resistance at the 4-hour trendline. A strong break above this level could lead to a further attack towards 4130. However, today's gains are not expected to be that significant. If the US session provides an opportunity around 4090-95, a short position can be considered, with a stop-loss at 4103, targeting support at 4055 and 4021. These levels also represent potential entry points for buying in batches during the US session.
Short near 4092, stop-loss at 4103, take-profit at 4055
Long near 4055, stop-loss at 4037, take-profit at 4075

XAU/USD 10 September 2025 Intraday AnalysisH4 Analysis:
-> Swing: Bullish.
-> Internal: Bullish.
Analysis and bias remains the same as analysis dated 20 October 2025.
Price has printed as per previous intraday expectation by printing a bearish CHoCH which indicates, but not confirms, bullish pullback phase initiation.
Price is currently trading within an established internal range, however, I will continue to monitor price with regards to depth of pullback.
Intraday expectation:
Price to continue bearish, react at either discount of 50% internal EQ, or H4 supply zone before targeting weak internal high priced at 4,380.990.
Note:
The Federal Reserve’s sustained dovish stance, coupled with ongoing geopolitical uncertainties, is likely to prolong heightened volatility in the gold market. Given this elevated risk environment, traders should exercise caution and recalibrate risk management strategies to navigate potential price fluctuations effectively.
Additionally, gold pricing remains sensitive to broader macroeconomic developments, including policy decisions under President Trump. Shifts in geopolitical strategy and economic directives could further amplify uncertainty, contributing to market repricing dynamics.
H4 Chart:
M15 Analysis:
-> Swing: Bullish.
-> Internal: Bearish.
You will note how price remains contained in consolidation between a supply and demand zone. The rest of my analysis and bias remains the same as bias date 29 October 2025.
As expected, price has printed a bullish CHoCH to indicate bullish pullback phase initiation.
Price is now trading within an established internal range.
Intraday expectation:
Price to continue bullish, react at either premium of internal 50% EQ or M15 demand zone before targeting weak internal low, priced at 3,886.465.
Note:
Gold remains highly volatile amid the Federal Reserve's continued dovish stance, persistent and escalating geopolitical uncertainties. Traders should implement robust risk management strategies and remain vigilant, as price swings may become more pronounced in this elevated volatility environment.
Additionally, President Trump’s tariff announcements, particularly against China, are expected to further amplify market turbulence, potentially triggering sharp price fluctuations and whipsaws.
M15 Chart:

Investing in the World Market (Global Investing)🌍 1. What Is the World Market?
The world market refers to all financial markets across the globe where people trade assets such as stocks, bonds, currencies, commodities, and real estate. When you invest globally, you are participating in this large network of financial activities happening in different regions and time zones.
It includes:
Developed markets like the U.S., U.K., Japan, Germany, and France.
Emerging markets like India, Brazil, China, and Indonesia.
Frontier markets, which are smaller and less developed, like Vietnam or Nigeria.
Each region has its own economic drivers, growth opportunities, and risks. Together, they form the world market.
💡 2. Why Invest in the World Market?
Here are the main reasons why global investing makes sense:
a. Diversification of Risk
When you invest only in your home country, your money depends heavily on one economy. But global investing spreads your risk across multiple countries.
If one market underperforms—say, the Indian market slows down—the U.S. or Japanese markets might still perform well, balancing your returns.
b. Access to Global Growth
Different parts of the world lead in different industries.
For example:
The U.S. dominates technology (Apple, Microsoft, Google).
Europe leads in luxury goods (LVMH, Ferrari).
Asia excels in manufacturing and electronics (Samsung, TSMC).
By investing globally, you gain exposure to all these growth stories.
c. Currency Advantage
If your home currency weakens compared to others, your foreign investments may gain in value when converted back. For instance, if you invest in U.S. stocks and the U.S. dollar strengthens, your returns increase when converted to Indian rupees.
d. Inflation Hedge
Global assets, especially commodities or foreign real estate, can protect against inflation. When local inflation rises, global investments may provide a cushion.
🏗️ 3. How to Start Investing in the World Market
Here’s a step-by-step guide that’s easy to follow:
Step 1: Understand Your Goals and Risk
Decide why you want to invest globally.
Are you seeking growth opportunities abroad?
Do you want to hedge against domestic risks?
Or do you just want to diversify your portfolio?
Your goal determines where and how much you should invest. For example, a conservative investor may prefer global mutual funds or ETFs, while an aggressive investor might buy foreign stocks directly.
Step 2: Choose the Right Route
There are several ways to invest globally:
Global Mutual Funds:
These are mutual funds in your country that invest in international markets. You don’t need a foreign trading account. Examples include funds focused on U.S. technology or global healthcare sectors.
Exchange-Traded Funds (ETFs):
ETFs are like mutual funds but trade on stock exchanges. You can buy global ETFs that track indexes like:
S&P 500 (U.S.)
MSCI World Index (global developed markets)
MSCI Emerging Markets Index
Direct International Stocks:
You can buy shares of global companies such as Apple, Google, or Toyota through platforms that allow cross-border trading.
Foreign Index Funds:
These funds track international indexes. They’re low-cost and simple for beginners.
Alternative Assets:
You can even invest globally in commodities (like gold, oil), real estate, or startups through specialized funds.
Step 3: Understand Costs
Global investing involves certain costs, such as:
Currency conversion fees
Brokerage charges
Tax implications
Expense ratios in global funds
Before investing, compare these costs to your potential returns.
Step 4: Learn About Tax Rules
Different countries have different tax laws. For instance, U.S. dividends are taxed for foreign investors, and you might need to declare them in your home country too. Always check Double Taxation Avoidance Agreements (DTAA) to avoid paying tax twice.
Step 5: Stay Updated
Global markets react to different economic events—like U.S. Federal Reserve rate changes, European inflation, or China’s manufacturing output.
Keep track of global trends, news, and currency movements that can impact your portfolio.
📊 4. Examples of Global Investment Options
Here are some easy examples to understand where people commonly invest globally:
Investment Type Example Region Focus
U.S. Stocks Apple, Microsoft, Amazon USA Tech innovation
European Stocks Nestlé, BMW, LVMH Europe Consumer goods & luxury
Asian Stocks Samsung, Toyota, TSMC Asia Manufacturing & electronics
ETFs S&P 500 ETF, MSCI World ETF Global Broad diversification
Global Mutual Funds Franklin Global Equity Fund Global Mixed assets
🌐 5. Understanding Global Market Risks
Just like domestic investing, global investing has risks. Here are key ones to know:
a. Currency Risk
When foreign exchange rates move against you, returns can drop. For instance, if the dollar weakens after you invest in U.S. stocks, your profits may reduce in your home currency.
b. Political and Economic Risk
Every country faces unique challenges—like wars, elections, policy changes, or recessions—that can affect its market.
c. Liquidity Risk
Some foreign markets may not have as many buyers and sellers, making it harder to sell your investments quickly.
d. Regulatory Differences
Different countries have different rules and reporting standards, which may affect transparency.
📈 6. Strategies for Success in Global Investing
Here are a few simple strategies that can help:
1. Start Small
You don’t need to move all your money abroad. Start with 10–20% of your total portfolio in global assets.
2. Diversify Across Regions
Avoid putting everything into one country. Instead, mix developed markets (like the U.S.) with emerging markets (like India or Brazil).
3. Use Global Index Funds
If you’re unsure which countries or stocks to pick, use broad index funds that automatically diversify your investments.
4. Focus on Long-Term Growth
Global investments might fluctuate in the short term but tend to deliver solid returns over time. Patience is key.
5. Rebalance Regularly
Revisit your portfolio every 6–12 months. Adjust if one region becomes overweight or underperforming.
🌎 7. The Future of Global Investing
Global investing is becoming easier and more digital. With the rise of fintech platforms, fractional investing, and ETFs, even small investors can own global assets.
Emerging themes include:
Sustainable investing (ESG) – investing in companies with environmental and social responsibility.
Artificial Intelligence (AI) and Tech – global funds focusing on innovation.
Renewable Energy – a growing global sector as the world moves toward clean energy.
Healthcare and Biotech – driven by aging populations and new medical breakthroughs.
As economies become more connected, global investing will no longer be an “option”—it’ll be a necessity for building wealth.
💬 Final Thoughts
Investing in the world market opens doors to immense opportunities beyond your borders. It allows you to benefit from global innovation, economic growth, and diversification. But it also requires understanding of currency risks, market differences, and long-term patience.
Start small, choose the right instruments, and gradually expand your exposure. With a disciplined and informed approach, global investing can transform your portfolio into a balanced, future-ready powerhouse that grows with the world economy.
In short — think global, invest wisely, and stay patient. 🌍💰
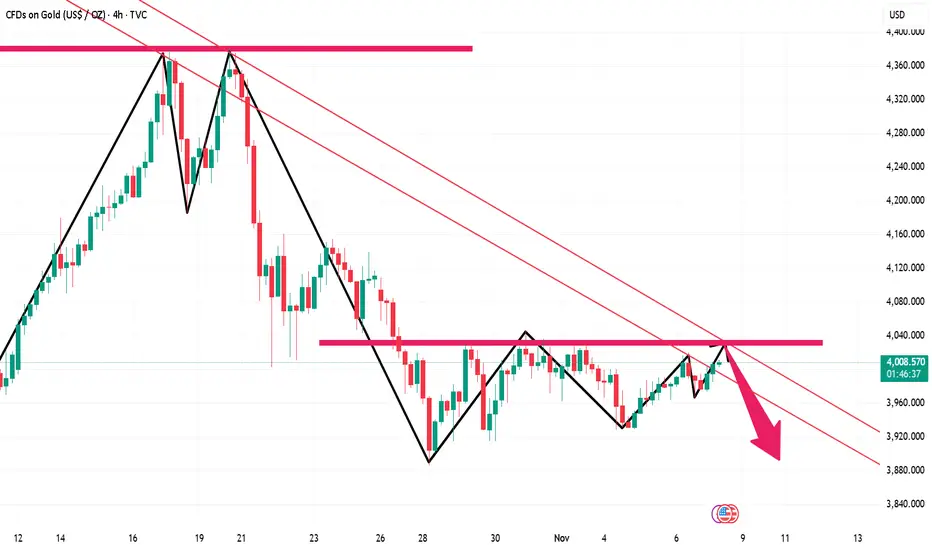
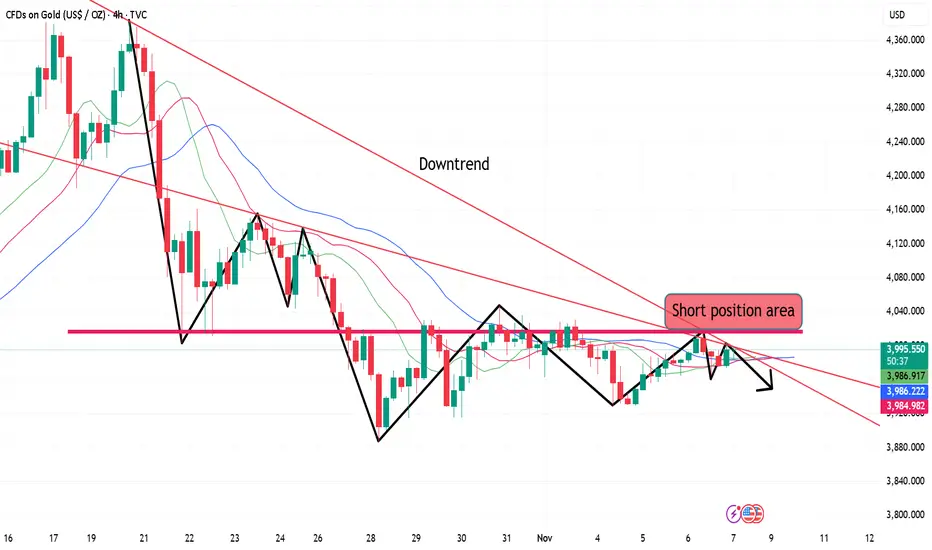
Gold continues to fluctuate; patiently await the onset of a downGold prices traded in a narrow range this week, fluctuating between 3925 and 4030. The overall volatility was not significant, indicating some market caution. However, since the second decline from 4381, gold prices have shown a pullback trend, oscillating around 4000. This pullback is a corrective move within a downtrend, suggesting further downside potential. The strategy of shorting on rallies remains unchanged. Continue to monitor the 4030-50 resistance level. If this level is not broken, the short-term bias will be bearish. Key support levels to watch are the 3950-60 and 3930-20 ranges. A break below these levels would lead to a break below the recent low of 3880. Conversely, a break above 4050 would require abandoning short positions and reassessing the market.

Gold prices are consolidating on November 7th, awaiting the non-Gold has completed its technical adjustment after a period of consolidation on the hourly chart. Short-term moving averages are starting to turn upwards, and the price is gradually rising above them, suggesting potential for further rebound in the short term. The key resistance level to watch is around 4020-30. On the 4-hour chart, short-term moving averages are largely flat and converging, indicating a potential breakout. The non-farm payroll data is unlikely to be released tonight. On the hourly chart, the price is gradually trending upwards along the short-term moving averages; monitor the short-term correction.
Trading Recommendation: Focus on the 4020-30 resistance zone and begin gradually establishing short positions.
XAU/USD 07 November 2025 Intraday AnalysisH4 Analysis:
-> Swing: Bullish.
-> Internal: Bullish.
Analysis and bias remains the same as analysis dated 20 October 2025.
Price has printed as per previous intraday expectation by printing a bearish CHoCH which indicates, but not confirms, bullish pullback phase initiation.
Price is currently trading within an established internal range, however, I will continue to monitor price with regards to depth of pullback.
Intraday expectation:
Price to continue bearish, react at either discount of 50% internal EQ, or H4 supply zone before targeting weak internal high priced at 4,380.990.
Note:
The Federal Reserve’s sustained dovish stance, coupled with ongoing geopolitical uncertainties, is likely to prolong heightened volatility in the gold market. Given this elevated risk environment, traders should exercise caution and recalibrate risk management strategies to navigate potential price fluctuations effectively.
Additionally, gold pricing remains sensitive to broader macroeconomic developments, including policy decisions under President Trump. Shifts in geopolitical strategy and economic directives could further amplify uncertainty, contributing to market repricing dynamics.
H4 Chart:
M15 Analysis:
-> Swing: Bullish.
-> Internal: Bearish.
You will note how price remains contained in consolidation between a supply and demand zone. The rest of my analysis and bias remains the same as bias date 29 October 2025.
As expected, price has printed a bullish CHoCH to indicate bullish pullback phase initiation.
Price is now trading within an established internal range.
Intraday expectation:
Price to continue bullish, react at either premium of internal 50% EQ or M15 demand zone before targeting weak internal low, priced at 3,886.465.
Note:
Gold remains highly volatile amid the Federal Reserve's continued dovish stance, persistent and escalating geopolitical uncertainties. Traders should implement robust risk management strategies and remain vigilant, as price swings may become more pronounced in this elevated volatility environment.
Additionally, President Trump’s tariff announcements, particularly against China, are expected to further amplify market turbulence, potentially triggering sharp price fluctuations and whipsaws.
M15 Chart:

The 11.7 range is narrowing; buy low and sell high.Gold has recently exhibited a typical consolidation pattern. After a brief dip to 3928 at the beginning of the week, it gradually stabilized and rebounded from Wednesday, briefly surging to 4020 yesterday, forming a V-shaped rebound overall, but failing to break out of the large consolidation range of 4060-3915. As time progresses, the range of fluctuation continues to narrow, forming a converging triangle pattern, suggesting the market is at a critical juncture in choosing a direction.
Today's trading should focus on two key price levels: 4020 represents significant short-term resistance, while 3965 is a support level that has been repeatedly tested recently. Strategically, short-term investors can buy low and sell high within the 4020-3965 range.
XAU/USD 06 November 2025 Intraday AnalysisH4 Analysis:
-> Swing: Bullish.
-> Internal: Bullish.
Analysis and bias remains the same as analysis dated 20 October 2025.
Price has printed as per previous intraday expectation by printing a bearish CHoCH which indicates, but not confirms, bullish pullback phase initiation.
Price is currently trading within an established internal range, however, I will continue to monitor price with regards to depth of pullback.
Intraday expectation:
Price to continue bearish, react at either discount of 50% internal EQ, or H4 supply zone before targeting weak internal high priced at 4,380. 990.
Note:
The Federal Reserve’s sustained dovish stance, coupled with ongoing geopolitical uncertainties, is likely to prolong heightened volatility in the gold market. Given this elevated risk environment, traders should exercise caution and recalibrate risk management strategies to navigate potential price fluctuations effectively.
Additionally, gold pricing remains sensitive to broader macroeconomic developments, including policy decisions under President Trump. Shifts in geopolitical strategy and economic directives could further amplify uncertainty, contributing to market repricing dynamics.
H4 Chart:
M15 Analysis:
-> Swing: Bullish.
-> Internal: Bearish.
You will note how price remains contained in consolidation between a supply and demand range. The rest of my analysis and bias remains the same as bias date 29 October 2025.
As expected, price has printed a bullish CHoCH to indicate bullish pullback phase initiation.
Price is now trading within an established internal range.
Intraday expectation:
Price to continue bullish, react at either premium of internal 50% EQ or M15 demand zone before targeting weak internal low, priced at 3,886.465.
Note:
Gold remains highly volatile amid the Federal Reserve's continued dovish stance, persistent and escalating geopolitical uncertainties. Traders should implement robust risk management strategies and remain vigilant, as price swings may become more pronounced in this elevated volatility environment.
Additionally, President Trump’s tariff announcements, particularly against China, are expected to further amplify market turbulence, potentially triggering sharp price fluctuations and whipsaws.
M15 Chart:

XAU/USD 05 November 2025 Intraday AnalysisH4 Analysis:
-> Swing: Bullish.
-> Internal: Bullish.
Analysis and bias remains the same as analysis dated 20 October 2025.
Price has printed as per previous intraday expectation by printing a bearish CHoCH which indicates, but not confirms, bullish pullback phase initiation.
Price is currently trading within an established internal range, however, I will continue to monitor price with regards to depth of pullback.
Intraday expectation:
Price to continue bearish, react at either discount of 50% internal EQ, or H4 supply zone before targeting weak internal high priced at 4,380. 990.
Note:
The Federal Reserve’s sustained dovish stance, coupled with ongoing geopolitical uncertainties, is likely to prolong heightened volatility in the gold market. Given this elevated risk environment, traders should exercise caution and recalibrate risk management strategies to navigate potential price fluctuations effectively.
Additionally, gold pricing remains sensitive to broader macroeconomic developments, including policy decisions under President Trump. Shifts in geopolitical strategy and economic directives could further amplify uncertainty, contributing to market repricing dynamics.
H4 Chart:
M15 Analysis:
-> Swing: Bullish.
-> Internal: Bearish.
Analysis and bias to remain the same as yesterday's bias date 29 October 2025.
As expected, price has printed a bullish CHoCH to indicate bullish pullback phase initiation.
Price is now trading within an established internal range.
Intraday expectation:
Price to continue bullish, react at either premium of internal 50% EQ or M15 demand zone before targeting weak internal low, priced at 3,886.465.
Note:
Gold remains highly volatile amid the Federal Reserve's continued dovish stance, persistent and escalating geopolitical uncertainties. Traders should implement robust risk management strategies and remain vigilant, as price swings may become more pronounced in this elevated volatility environment.
Additionally, President Trump’s tariff announcements, particularly against China, are expected to further amplify market turbulence, potentially triggering sharp price fluctuations and whipsaws.
M15 Chart:

Gold prices fell back during the US session on November 5th.From the 4-hour chart, the current short-term resistance levels to watch are 3965-70 and 4020-55. Short-term support is at 3918-20, with a key support level at the previous low of 3888-90. The strategy is to sell on rallies.
Gold Trading Strategy:
1. Sell gold at 3980-70, add to the short position at 4020-25, stop loss at 4039, target 3940-3930.

XAU/USD 04 November 2025 Intraday AnalysisH4 Analysis:
-> Swing: Bullish.
-> Internal: Bullish.
Analysis and bias remains the same as analysis dated 20 October 2025.
Price has printed as per previous intraday expectation by printing a bearish CHoCH which indicates, but not confirms, bullish pullback phase initiation.
Price is currently trading within an established internal range, however, I will continue to monitor price with regards to depth of pullback.
Intraday expectation:
Price to continue bearish, react at either discount of 50% internal EQ, or H4 supply zone before targeting weak internal high priced at 4,380. 990.
Note:
The Federal Reserve’s sustained dovish stance, coupled with ongoing geopolitical uncertainties, is likely to prolong heightened volatility in the gold market. Given this elevated risk environment, traders should exercise caution and recalibrate risk management strategies to navigate potential price fluctuations effectively.
Additionally, gold pricing remains sensitive to broader macroeconomic developments, including policy decisions under President Trump. Shifts in geopolitical strategy and economic directives could further amplify uncertainty, contributing to market repricing dynamics.
H4 Chart:
M15 Analysis:
-> Swing: Bullish.
-> Internal: Bearish.
Analysis and bias to remain the same as yesterday's bias date 29 October 2025.
As expected, price has printed a bullish CHoCH to indicate bullish pullback phase initiation.
Price is now trading within an established internal range.
Intraday expectation:
Price to continue bullish, react at either premium of internal 50% EQ or M15 demand zone before targeting weak internal low, priced at 3,886.465.
Note:
Gold remains highly volatile amid the Federal Reserve's continued dovish stance, persistent and escalating geopolitical uncertainties. Traders should implement robust risk management strategies and remain vigilant, as price swings may become more pronounced in this elevated volatility environment.
Additionally, President Trump’s tariff announcements, particularly against China, are expected to further amplify market turbulence, potentially triggering sharp price fluctuations and whipsaws.
M15 Chart:

Gold prices fluctuated upwards on November 3rd, but bulls faced From the 4-hour chart, the current resistance level to watch is 4030-35, with a key resistance level at 4047-55. The short-term support level is 3965-70. The recommended strategy is to primarily sell on rallies, avoiding chasing the market and patiently waiting for key entry points. Specific trading strategies will be provided during trading hours; please pay close attention.
Gold Trading Strategy:
1. Sell gold on rallies to 4030-35, add to the short position on rallies to 4047-55, stop loss at 4069, target 3960-3965, hold if it breaks through.

XAU/USD 03 November 2025 Intraday AnalysisH4 Analysis:
-> Swing: Bullish.
-> Internal: Bullish.
Analysis and bias remains the same as analysis dated 20 October 2025.
Price has printed as per previous intraday expectation by printing a bearish CHoCH which indicates, but not confirms, bullish pullback phase initiation.
Price is currently trading within an established internal range, however, I will continue to monitor price with regards to depth of pullback.
Intraday expectation:
Price to continue bearish, react at either discount of 50% internal EQ, or H4 supply zone before targeting weak internal high priced at 4,380. 990.
Note:
The Federal Reserve’s sustained dovish stance, coupled with ongoing geopolitical uncertainties, is likely to prolong heightened volatility in the gold market. Given this elevated risk environment, traders should exercise caution and recalibrate risk management strategies to navigate potential price fluctuations effectively.
Additionally, gold pricing remains sensitive to broader macroeconomic developments, including policy decisions under President Trump. Shifts in geopolitical strategy and economic directives could further amplify uncertainty, contributing to market repricing dynamics.
H4 Chart:
M15 Analysis:
-> Swing: Bullish.
-> Internal: Bearish.
Analysis and bias to remain the same as yesterday's bias date 29 October 2025.
As expected, price has printed a bullish CHoCH to indicate bullish pullback phase initiation.
Price is now trading within an established internal range.
Intraday expectation:
Price to continue bullish, react at either premium of internal 50% EQ or M15 demand zone before targeting weak internal low, priced at 3,886.465.
Note:
Gold remains highly volatile amid the Federal Reserve's continued dovish stance, persistent and escalating geopolitical uncertainties. Traders should implement robust risk management strategies and remain vigilant, as price swings may become more pronounced in this elevated volatility environment.
Additionally, President Trump’s tariff announcements, particularly against China, are expected to further amplify market turbulence, potentially triggering sharp price fluctuations and whipsaws.
M15 Chart:
