Go Bold with Gold I’m expecting gold to rise from the current levels — around 4110.
The invalidation zone for this plan is marked in red on the chart
Goldusd

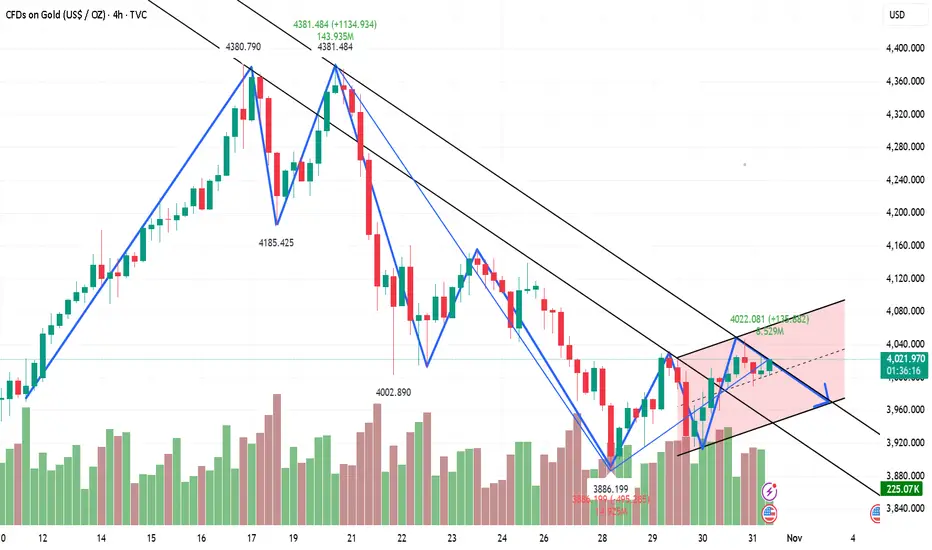
October 31st Gold Intraday Short-Term Trading Guide!!!Gold prices retreated from around 4044-46 during the day, hitting a low of 3988 in the morning. Currently, it's oscillating within the 4000-4126 range. Today is the weekly and monthly close, potentially triggering a significant price movement. From a trend perspective, short-term gains remain limited. A further dip to 4000 is possible amidst the consolidation. A break below 3986/3960 could lead to a move towards 3920-3900. The recommended strategy is to sell on rallies, but be aware of the risks.
US Session Trading Strategy:
Sell near 40120-25, stop loss at 4035, target 4000-3990, continue to look for further downside if the price breaks through.
XAU/USD 31 October 2025 Intraday AnalysisH4 Analysis:
-> Swing: Bullish.
-> Internal: Bullish.
Analysis and bias remains the same as analysis dated 20 October 2025.
Price has printed as per previous intraday expectation by printing a bearish CHoCH which indicates, but not confirms, bullish pullback phase initiation.
Price is currently trading within an established internal range, however, I will continue to monitor price with regards to depth of pullback.
Intraday expectation:
Price to continue bearish, react at either discount of 50% internal EQ, or H4 supply zone before targeting weak internal high priced at 4,380. 990.
Note:
The Federal Reserve’s sustained dovish stance, coupled with ongoing geopolitical uncertainties, is likely to prolong heightened volatility in the gold market. Given this elevated risk environment, traders should exercise caution and recalibrate risk management strategies to navigate potential price fluctuations effectively.
Additionally, gold pricing remains sensitive to broader macroeconomic developments, including policy decisions under President Trump. Shifts in geopolitical strategy and economic directives could further amplify uncertainty, contributing to market repricing dynamics.
H4 Chart:
M15 Analysis:
-> Swing: Bullish.
-> Internal: Bearish.
Analysis and bias to remain the same as yesterday's bias date 29 October 2025.
As expected, price has printed a bullish CHoCH to indicate bullish pullback phase initiation.
Price is now trading within an established internal range.
Intraday expectation:
Price to continue bullish, react at either premium of internal 50% EQ or M15 demand zone before targeting weak internal low, priced at 3,886.465.
Note:
Gold remains highly volatile amid the Federal Reserve's continued dovish stance, persistent and escalating geopolitical uncertainties. Traders should implement robust risk management strategies and remain vigilant, as price swings may become more pronounced in this elevated volatility environment.
Additionally, President Trump’s tariff announcements, particularly against China, are expected to further amplify market turbulence, potentially triggering sharp price fluctuations and whipsaws.
M15 Chart:

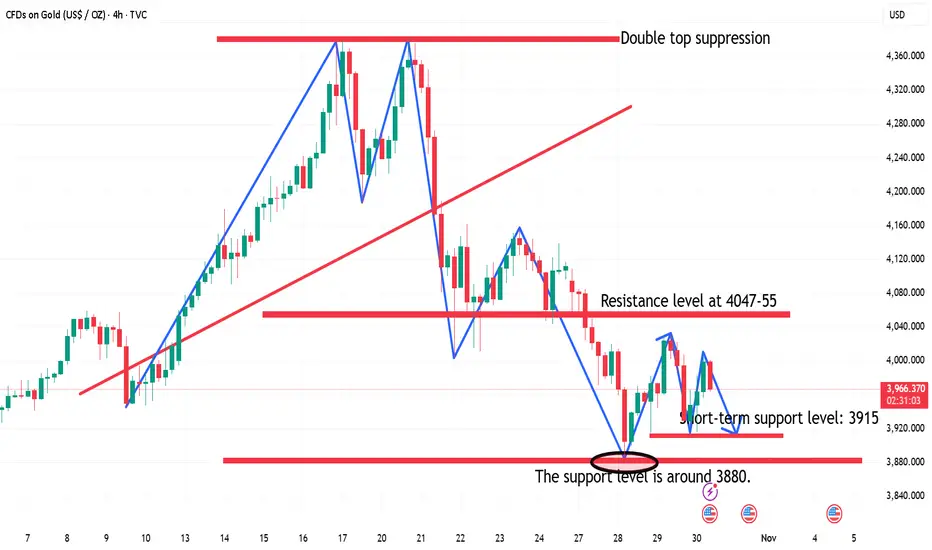
October 31st, Golden Week Holiday, Monthly Closing DateFrom the 4-hour chart, the current short-term resistance level to watch is 4030-35, with a key resistance level at 4047-55. Short-term support is at 3965-70. For overnight trading, focus on range trading; avoid chasing the market and wait patiently for key entry points. Specific trading strategies will be provided during trading hours, so please pay close attention.
Gold Trading Strategy:
1. Sell gold at 4030-35, add to the short position at 4047-55, stop loss at 4069, target 3970-3965.
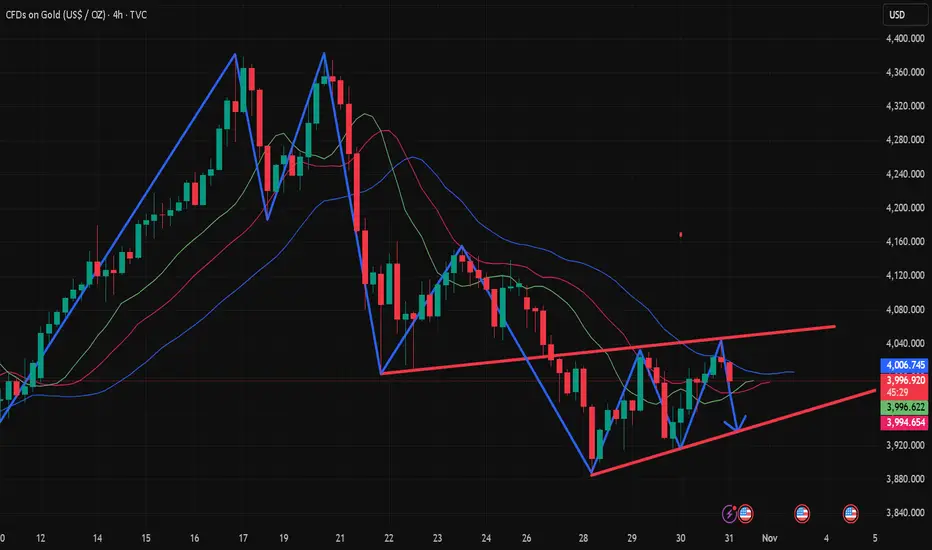
US session short-term trading strategy guidance at 10:30!From a 4-hour chart perspective, the current short-term resistance level to watch is 3978-85, with a key resistance level at 4047-55. Short-term support is at 3915-20. Trading should focus on range trading; avoid chasing the market and patiently wait for key entry points.
Gold Trading Strategy:
1. Sell gold at 3978-3985, stop loss at 4009, target 3880-3895, hold if it breaks through;
2. Buy gold at 3915-20, stop loss at 3896, target 3977-85, hold if it breaks through.
XAU/USD 30 October 2025 Intraday AnalysisH4 Analysis:
-> Swing: Bullish.
-> Internal: Bullish.
Analysis and bias remains the same as analysis dated 20 October 2025.
Price has printed as per previous intraday expectation by printing a bearish CHoCH which indicates, but not confirms, bullish pullback phase initiation.
Price is currently trading within an established internal range, however, I will continue to monitor price with regards to depth of pullback.
Intraday expectation:
Price to continue bearish, react at either discount of 50% internal EQ, or H4 supply zone before targeting weak internal high priced at 4,380. 990.
Note:
The Federal Reserve’s sustained dovish stance, coupled with ongoing geopolitical uncertainties, is likely to prolong heightened volatility in the gold market. Given this elevated risk environment, traders should exercise caution and recalibrate risk management strategies to navigate potential price fluctuations effectively.
Additionally, gold pricing remains sensitive to broader macroeconomic developments, including policy decisions under President Trump. Shifts in geopolitical strategy and economic directives could further amplify uncertainty, contributing to market repricing dynamics.
H4 Chart:
M15 Analysis:
-> Swing: Bullish.
-> Internal: Bearish.
Analysis and bias to remain the same as yesterday's bias date 29 October 2025.
As expected, price has printed a bullish CHoCH to indicate bullish pullback phase initiation.
Price is now trading within an established internal range.
Intraday expectation:
Price to continue bullish, react at either premium of internal 50% EQ or M15 demand zone before targeting weak internal low, priced at 3,886.456.
Note:
Gold remains highly volatile amid the Federal Reserve's continued dovish stance, persistent and escalating geopolitical uncertainties. Traders should implement robust risk management strategies and remain vigilant, as price swings may become more pronounced in this elevated volatility environment.
Additionally, President Trump’s tariff announcements, particularly against China, are expected to further amplify market turbulence, potentially triggering sharp price fluctuations and whipsaws.
M15 Chart:

Gold’s New Game — Higher Highs Again!In my view, gold has completed its correction from the previous rally and is now preparing to renew its all-time high.
On the chart, I’ve marked a 5-wave structure, which I believe represents the first wave of a much larger 5-wave sequence.
This suggests we could see gold far above $4600.
Honestly, I can’t even imagine how high it could go — or what might drive that kind of move.
It’s insane.

De-Dollarization and Global Currency ShiftsIntroduction
For over seven decades, the U.S. dollar has been the undisputed king of global finance — the preferred reserve currency, the benchmark for international trade, and the foundation of global capital markets. However, recent years have seen increasing talk and tangible actions toward de-dollarization — the gradual movement away from dependence on the U.S. dollar in global trade, finance, and reserves. This shift is not merely theoretical but increasingly visible in trade agreements, reserve allocations, and cross-border payment systems. Understanding this process requires exploring its historical roots, current dynamics, major players, and the profound implications for the global economy.
1. Historical Dominance of the U.S. Dollar
The dollar’s dominance began after World War II, cemented through the Bretton Woods Agreement of 1944, which established the dollar as the central currency in the international monetary system. Under this system, other currencies were pegged to the dollar, which itself was backed by gold at a fixed rate of $35 per ounce. The U.S. economy, being the largest and most stable, became the anchor of global trade and finance.
Even after the Nixon Shock of 1971, when the U.S. abandoned the gold standard, the dollar maintained its supremacy due to America’s economic might, deep financial markets, and the establishment of the petrodollar system — where oil and other commodities were priced and traded in U.S. dollars. This gave the U.S. an “exorbitant privilege,” enabling it to run large deficits and influence global financial flows without losing credibility.
2. The Concept of De-Dollarization
De-dollarization refers to the global trend of countries reducing their reliance on the U.S. dollar for international trade, reserves, and financial transactions. It encompasses several dimensions:
Trade De-dollarization: Using alternative currencies for bilateral or multilateral trade settlements.
Financial De-dollarization: Diversifying reserves and foreign assets away from the dollar.
Institutional De-dollarization: Creating mechanisms that bypass U.S.-dominated systems like SWIFT.
While the dollar still dominates, de-dollarization is gradually reshaping the landscape, driven by economic pragmatism, geopolitical tensions, and the desire for monetary sovereignty.
3. Factors Driving De-Dollarization
a. Geopolitical Motivations
The most significant catalyst has been geopolitics. The U.S. has frequently used the dollar as a geopolitical weapon, imposing sanctions on nations like Russia, Iran, and Venezuela. This weaponization of the dollar has alarmed countries that fear similar vulnerabilities. For example, after Russia’s exclusion from the SWIFT system in 2022, Moscow and Beijing accelerated moves to use their national currencies for trade.
b. Economic Diversification
Emerging economies, especially China, India, Brazil, and Russia, are seeking greater autonomy in financial dealings. Holding large dollar reserves exposes them to U.S. monetary policy and inflation risks. Diversifying into gold, yuan, or euro assets reduces exposure to dollar volatility.
c. Rise of Alternative Economic Blocs
The BRICS alliance (Brazil, Russia, India, China, and South Africa) has become a strong advocate for a multipolar currency system. Their growing share of global GDP and trade makes it feasible to trade among themselves in local currencies, reducing the dollar’s centrality.
d. Technological Innovation and Digital Currencies
Blockchain technology and Central Bank Digital Currencies (CBDCs) are providing infrastructure for cross-border payments independent of the dollar system. China’s digital yuan and experiments by the European Central Bank and Reserve Bank of India are examples of monetary innovation accelerating de-dollarization.
e. U.S. Fiscal and Monetary Policies
Massive U.S. debt, persistent deficits, and inflationary pressures have raised concerns about long-term dollar stability. As the Federal Reserve’s interest rate policies cause volatility in global markets, many nations seek alternatives to reduce vulnerability to U.S. economic cycles.
4. Key Players in the De-Dollarization Movement
China
China is at the forefront of de-dollarization. Through its Belt and Road Initiative (BRI), it has expanded yuan-denominated trade and investment. The Cross-Border Interbank Payment System (CIPS) is Beijing’s alternative to SWIFT, facilitating international settlements in yuan. The digital yuan (e-CNY) further strengthens China’s ability to bypass the dollar in trade.
Russia
Following Western sanctions after the annexation of Crimea (2014) and the 2022 Ukraine war, Russia drastically reduced its dollar holdings, increasing reserves in gold and yuan. Russian oil and gas are now traded with countries like China and India in local currencies or through barter mechanisms.
India
India has begun signing bilateral trade agreements that allow settlement in Indian Rupees (INR). For example, the INR-Vostro account system facilitates trade with countries like Russia and Sri Lanka. India’s cautious yet steady participation highlights its interest in a diversified currency regime without abruptly destabilizing its financial relations with the West.
Middle East and Africa
Saudi Arabia, traditionally a key pillar of the petrodollar system, has signaled openness to accepting yuan or euros for oil sales, particularly with China. African nations engaged with BRICS and China’s infrastructure projects are also using local currency or yuan settlements, contributing to the multipolar trend.
European Union
The euro remains the second-most used currency in global reserves. The EU’s promotion of the euro in energy and technology trade aims to strengthen its global role and reduce dependence on U.S. financial systems, particularly in the face of unilateral sanctions.
5. Mechanisms of De-Dollarization
a. Bilateral Currency Swaps
Central banks are entering currency swap agreements, enabling direct trade in local currencies. China has over 40 such agreements worldwide, including with nations like Argentina, Pakistan, and Russia.
b. Local Currency Settlements
Countries like India, Brazil, and Indonesia are developing systems for local currency trade settlements, bypassing the dollar in invoicing and payment processing.
c. Multilateral Platforms
The Asian Infrastructure Investment Bank (AIIB) and the New Development Bank (BRICS Bank) are examples of financial institutions providing loans and investments in local currencies rather than dollars.
d. Gold Accumulation
Several nations have increased gold reserves as a hedge against dollar volatility. Central banks worldwide, led by China and Russia, are buying gold at record levels, viewing it as a neutral asset outside U.S. control.
6. Implications for Global Trade and Finance
a. Reduced Dollar Demand
As trade and financial flows diversify, global demand for U.S. dollars may decline gradually. This could weaken the dollar’s exchange rate and reduce the U.S.’s ability to finance its deficits cheaply.
b. Rise of Multipolar Currency System
A more balanced currency system may emerge, dominated by the U.S. dollar, euro, and Chinese yuan, with regional currencies playing niche roles. This diversification could enhance global stability but complicate exchange rate management and liquidity flows.
c. Shifts in Reserve Composition
According to IMF data, the dollar’s share of global reserves has declined from over 70% in 2000 to about 58% in 2024. This trend is expected to continue as central banks increase allocations to gold, yuan, and other assets.
d. New Trade Alliances
Countries prioritizing local currency trade are forming new alliances and payment networks, reshaping global trade routes. For instance, the India-Russia-China corridor and BRICS payment system are notable examples.
e. Impact on U.S. Influence
De-dollarization could gradually diminish U.S. geopolitical leverage. The ability to impose sanctions, control global liquidity, or influence monetary policy worldwide would be reduced. However, this process will likely be slow, given the depth and liquidity of U.S. financial markets.
7. Challenges and Limitations
While the momentum toward de-dollarization is real, several constraints limit its pace:
a. Lack of Deep Capital Markets
The U.S. still offers the largest, most liquid, and transparent capital markets. Alternatives like the yuan or rupee lack full convertibility, regulatory clarity, and global trust.
b. Network Effects
Once a currency dominates, it benefits from self-reinforcing network effects. Most global commodities are priced in dollars, and firms prefer it due to stability and universal acceptance.
c. Political and Institutional Trust
Many countries still view the U.S. legal and financial framework as safer than those of emerging powers. China’s capital controls and Russia’s geopolitical isolation hinder full global acceptance of their currencies.
d. Technological Fragmentation
Although CBDCs and digital platforms offer alternatives, interoperability and security issues remain unresolved. Competing systems could lead to inefficiency rather than integration.
8. Future Outlook: The Road Ahead
The world is unlikely to see the immediate end of the dollar era, but a gradual rebalancing is underway. The next decade could witness:
A tripolar currency system led by the U.S. dollar, euro, and Chinese yuan.
Expansion of digital and regional currencies for trade within Asia, Africa, and Latin America.
Declining U.S. dominance in global reserves but continued dollar primacy due to market depth.
Growth of commodity-backed and digital settlement systems to stabilize cross-border payments.
The dollar’s resilience should not be underestimated — it remains a symbol of trust, backed by strong institutions and deep markets. Yet, as emerging powers grow and technology disrupts traditional finance, the unipolar dollar era is transforming into a multipolar monetary order.
Conclusion
De-dollarization represents one of the most significant shifts in the global economic landscape of the 21st century. It is not an overnight revolution but a gradual evolution driven by geopolitical tensions, technological progress, and the rise of new economic powers. While the U.S. dollar will likely remain dominant for the foreseeable future, its uncontested supremacy is fading. The emerging multipolar currency world — led by the dollar, yuan, and euro — will redefine global finance, trade, and geopolitics.
In essence, de-dollarization is not just a financial adjustment; it is a statement of sovereignty, resilience, and the world’s ongoing journey toward a more balanced and diversified economic order.

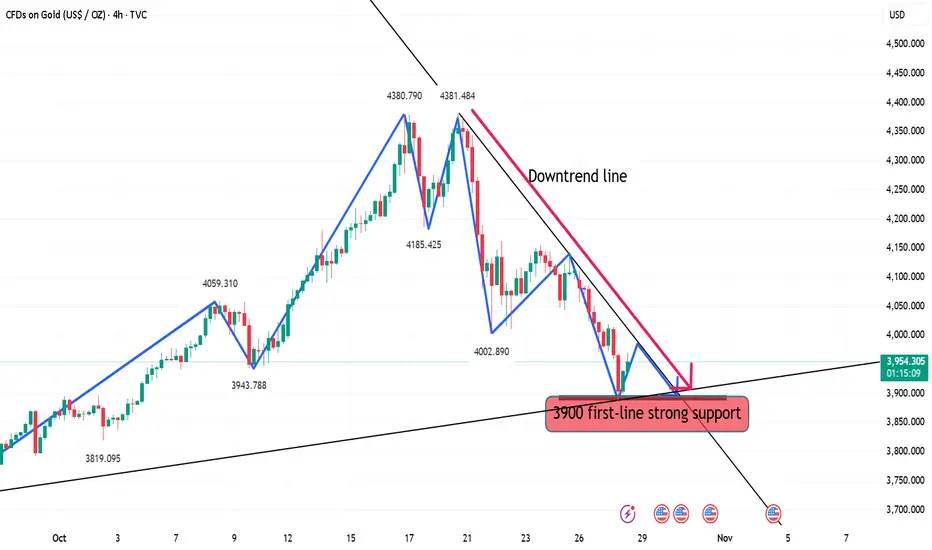
‘10.29 Buy first below 3900 and then sell!Technical Analysis:
The first resistance area above is 3960-70. Maintain a short position below this level. If the market unexpectedly breaks higher, focus on the 3995-4005 area, which remains bearish. If the market weakens, the 3945-50 area, previously the starting point for the rally, has become a source of pressure after breaking below it today.
Key support areas below are the 20-day moving average (SMA) at 3865-70 and the 50% level at 3840-45.
Trading strategy: Maintain a short position on rebounds.
Participate in the 3960-70 area, targeting a new low. After a new low, consider entering long positions based on the 20-day moving average and the 50% level.
XAU/USD 28 October 2025 Intraday AnalysisH4 Analysis:
-> Swing: Bullish.
-> Internal: Bullish.
Analysis and bias remains the same as analysis dated 20 October 2025.
Price has printed as per previous intraday expectation by printing a bearish CHoCH which indicates, but not confirms, bullish pullback phase initiation.
Price is currently trading within an established internal range, however, I will continue to monitor price with regards to depth of pullback.
Intraday expectation:
Price to continue bearish, react at either discount of 50% internal EQ, or H4 supply zone before targeting weak internal high priced at 4,380. 990.
Note:
The Federal Reserve’s sustained dovish stance, coupled with ongoing geopolitical uncertainties, is likely to prolong heightened volatility in the gold market. Given this elevated risk environment, traders should exercise caution and recalibrate risk management strategies to navigate potential price fluctuations effectively.
Additionally, gold pricing remains sensitive to broader macroeconomic developments, including policy decisions under President Trump. Shifts in geopolitical strategy and economic directives could further amplify uncertainty, contributing to market repricing dynamics.
H4 Chart:
M15 Analysis:
-> Swing: Bullish.
-> Internal: Bearish.
Price printed according to my analysis dated 22 October 2025 where I mentioned price to react at either premium of 50% internal EQ, or M15 demand zone, before targeting weak internal low priced at 4,004.280.
Price has printed a bullish CHoCH, however, depth of pullback was insignificant.
Price is now trading within an internal high and fractal low. CHoCH positioning is denoted with a blue horizontal dotted line.
Intraday expectation:
Await for price to print bullish CHoCH to indicate bullish pullback phase.
Note:
Gold remains highly volatile amid the Federal Reserve's continued dovish stance, persistent and escalating geopolitical uncertainties. Traders should implement robust risk management strategies and remain vigilant, as price swings may become more pronounced in this elevated volatility environment.
Additionally, President Trump’s tariff announcements, particularly against China, are expected to further amplify market turbulence, potentially triggering sharp price fluctuations and whipsaws.
M15 Chart:

Gold kissed the wall.Gold touched both the top band of the rising wedge and the 0.618 Fib level on the 3M timeframe… and was rejected.
Is this just a correction, or the beginning of a historic reversal?
Time will tell, but the chart is already whispering.
TVC:GOLD | TVC:XAU 🔻

Gold shorts are coming, rebound under pressure and short sellGold hit resistance twice today and broke new lows again. Currently, the market is fluctuating at a low level, with resistance levels decreasing and the lows falling. The overall trend remains weak. Previous support at 4047-55 has become resistance. Focus on the downside: last week's lows of 4000-4004. The 4000 level will be the first barrier for bears to break through. Key resistance from above remains around the 4047-55 level we identified earlier.
Technical Analysis:
From the 4-hour market trend, short-term resistance at 4047-55 is currently under pressure. Gold is struggling to break through this resistance. Trading strategies should prioritize shorting on rebounds. In the intermediate range, be cautious and watchful, and wait patiently for key entry points.

XAU/USD 27 October 2025 Intraday AnalysisH4 Analysis:
-> Swing: Bullish.
-> Internal: Bullish.
Analysis and bias remains the same as analysis dated 20 October 2025.
Price has printed as per previous intraday expectation by printing a bearish CHoCH which indicates, but not confirms, bullish pullback phase initiation.
Price is currently trading within an established internal range, however, I will continue to monitor price with regards to depth of pullback.
Intraday expectation:
Price to continue bearish, react at either discount of 50% internal EQ, or H4 supply zone before targeting weak internal high priced at 4,380. 990.
Note:
The Federal Reserve’s sustained dovish stance, coupled with ongoing geopolitical uncertainties, is likely to prolong heightened volatility in the gold market. Given this elevated risk environment, traders should exercise caution and recalibrate risk management strategies to navigate potential price fluctuations effectively.
Additionally, gold pricing remains sensitive to broader macroeconomic developments, including policy decisions under President Trump. Shifts in geopolitical strategy and economic directives could further amplify uncertainty, contributing to market repricing dynamics.
H4 Chart:
M15 Analysis:
-> Swing: Bullish.
-> Internal: Bearish.
Analysis and bias remains the same as yesterday's analysis dated 22 October 2025.
Price has printed according to my analysis dated 20 October 2025 where I mention that price is to continue bullish, react at either premium of 50% internal EQ, or M15 demand zone, before targeting weak internal low priced at 4,185.910.
Price has printed a bearish iBOS and subsequently a bullish CHoCH to indicate, but not confirm bullish pullback phase initiation.
Price is now trading within an established internal range.
Intraday expectation:
Price to react at either premium of 50% internal EQ, or M15 demand zone, before targeting weak internal low priced at 4,004.280.
Note:
Gold remains highly volatile amid the Federal Reserve's continued dovish stance, persistent and escalating geopolitical uncertainties. Traders should implement robust risk management strategies and remain vigilant, as price swings may become more pronounced in this elevated volatility environment.
Additionally, President Trump’s tariff announcements, particularly against China, are expected to further amplify market turbulence, potentially triggering sharp price fluctuations and whipsaws.
M15 Chart:

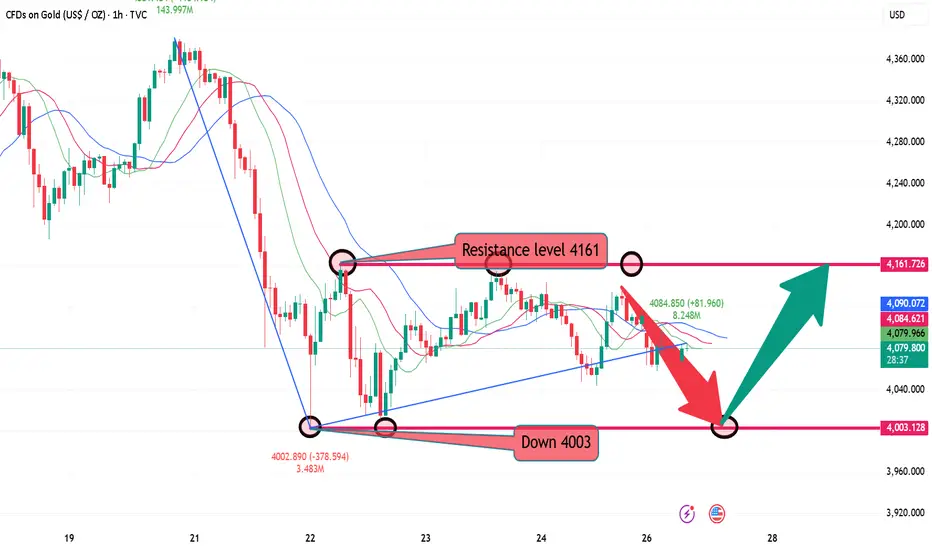
Gold continues to maintain the oscillation range of 03-60Gold's potential correction from its highs lies between 4003 and 4161, with room for a significant correction of 160 pips. Gold plummeted during today's Asian and European trading sessions, leaving a clear resistance level. We should focus on the minor resistance level of 4097. If it fails to hold above, bears will continue their decline and seek deeper support. Shorts should avoid candlestick charts near 4003. A break below the bottom of the oscillation this week could lead to a deeper correction for bears.
Resistance levels are 4097 and 4035, while support levels are 4065 and 4045. The dividing line between strength and weakness is 4097.
Gold daily K-line stopped falling, and the slow bull correction On Friday, the market corrected for 2 hours, finding support near 4045 on the lower 2-hour band, before retracing upwards. Next week, tomorrow, the 3-hour correction will gradually begin. Currently, the 3-hour BOLL is moving sideways, further oscillating within the range. Once the 3-hour correction concludes, the 4-, 6-, 8-, and 12-hour bands will begin to correct. Ultimately, the next bullish and bearish trend will unfold during this 4- to 12-hour correction.
On Monday, we'll initially focus on the 3-hour BOLL band range. Currently, the range is between 4155 and 4050. Within this range, the market will continue to fluctuate, with buy low and sell high being the primary strategy. Therefore, a buy low, sell high strategy within the 4155-=4050 range should be sufficient.
Technical Analysis:
1: The 3-hour correction is evident, with the BOLL range moving sideways, within the 4050-4155 range. Buy low, sell high is a viable strategy within this range.
2: The 4-hour Stochastic and MACD lines are both blunting, indicating a temporary sideways trend. The central axis of pressure is near 4145 .
3: In the daily K-line chart, the Stochastic is blunting and moving downward, signaling a bearish bias. The MACD is initially forming a death cross and moving downward, signaling a bearish bias. However, the central axis of the daily K-line is holding support, currently moving up to around 4085, followed by support around 4000.
Overall, the technical outlook suggests a range-bound trend within the 3-hour chart, followed by a gradual upward trend within the 4-hour chart, followed by a volatile upward trend within the daily K-line. This is the corresponding signal of the current market; but the specific approach is mainly to wait and see and respond as needed!
$GOLD at Top, $BTC at Bottom.Gold has received rejection at the top band of the rising wedge formation and the 0.618 Fib channel, making the top signal clear.
Bitcoin, on the other hand, is at the opposite end of the same structure, at the bottom band...
At the next stage, Bitcoin should move towards the 0.618 fib channel and the upper band of the rising wedge

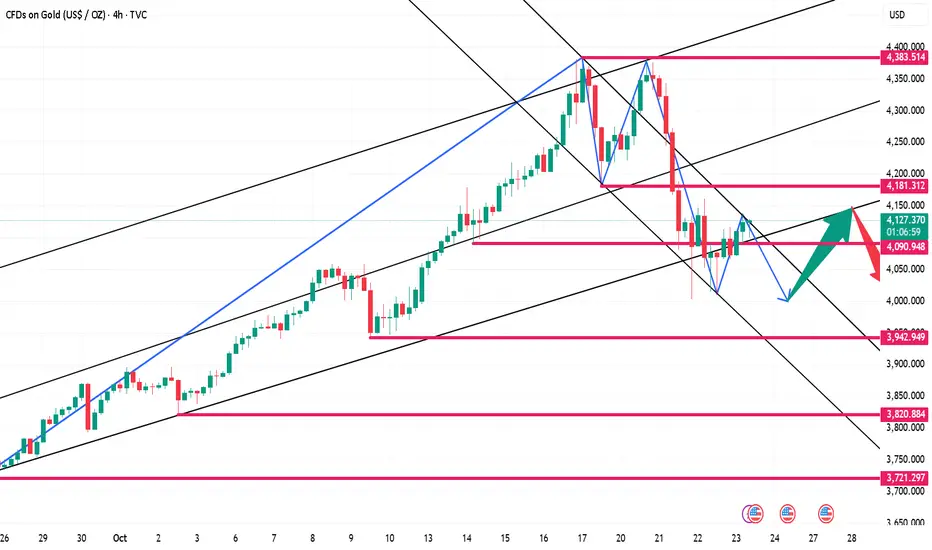
10.24 Gold US Trading Strategy, Bulls Bottom Out and Rebound as Looking at the 4-hour market trend, the current short-term resistance level at 4142-50 is being monitored on the upside, while the short-term support level at 4065-4070 is being monitored on the downside. Gold is under pressure and difficult to break through. For trading, the primary strategy is to go long on pullbacks. In the middle, be cautious and follow orders carefully, patiently waiting for key entry points. I will provide detailed trading strategies during the trading session, so please stay tuned.
Gold Trading Strategy:
1. If gold rebounds and doesn't break through the 4145-52 level, go short. Set a stop-loss at 4160, and target the 4015-4000 level. Hold if it breaks through!
2. If gold retraces to the 4085-93 level, go long. Set a stop-loss at 4073, and target the 4130-35 level. Hold if it breaks through!
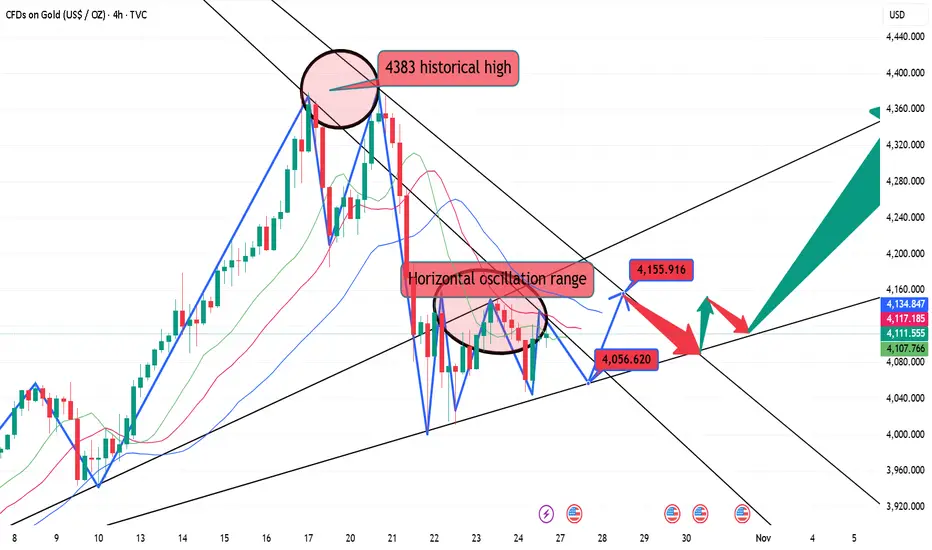
10.23 Gold Intraday Short-Term Technical Guide!!!From a big-picture perspective, gold should continue its upward trend as real interest rates are expected to continue to decline as the Fed's policy turns dovish. However, in the short term, a re-adjustment of interest rate expectations could trigger a further correction.
Technical Analysis:
On the 4-hour chart, gold prices have broken below the neckline of the double top pattern, strengthening bearish momentum. The neckline will now become a new resistance level, where bears may position themselves, with stops set above resistance, aiming for a further break below the trendline. Bulls, on the other hand, would like to see gold prices re-break through the neckline, thereby negating the bearish pattern and pushing prices back to higher levels.
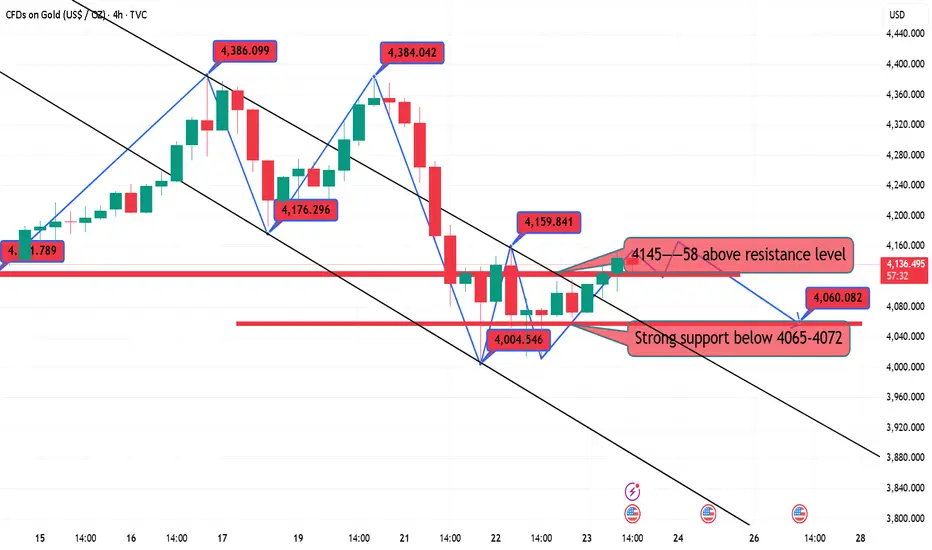
10, 23 gold is still expected to fall!!!This week, gold hit $4380 for the second time before retreating, forming a double top. The upward rebound was interrupted by a break below 4293. A break below the previous low of 4186 marked the first time a secondary decline has occurred, breaking the previous correction pattern. Previous declines have not resulted in a secondary break below the previous low, let alone a downward extension. Therefore, this time represents a shift in rhythm, a pause in the bull market, and a period of rest and consolidation. The bull market needs rest!
Short-term, yesterday's Asian session rebounded, reaching 4161 before retreating around 2:00 PM. Today, we will focus on the overnight rebound high of 4118 and the 2:00 PM timeframe. Specifically, relying on the resistance at 4118, we can short in the European session and continue to watch for a decline.
Specifically, keep an eye on the resistance at 4118 and consider shorting when the time is right.

Gold goes on a roller coaster ride. Continue to short below 4100Looking back at the price of gold since the beginning of the year, it has risen by over 50%, with an increase of over 25% in just two months. Those who bought in early on have made a killing, and at the first sign of trouble, they naturally want to sell to lock in profits. This concentrated sell-off can easily trigger panic. Leveraged margin calls exacerbate volatility: The recent surge has attracted many investors to leverage their positions. If prices fall rapidly, these leveraged positions will be forced to close, amplifying the decline like dominoes.
Returning to the one-hour gold chart, US gold will continue to fluctuate between 4100 and 4020. The current trend is volatile and weak, so adopt a high-sell strategy! Go short on a dip to 4080, with an eye on the 4000 area below!
Specific Strategy
Sell gold below 4100, stop loss at 4110, target 4000.

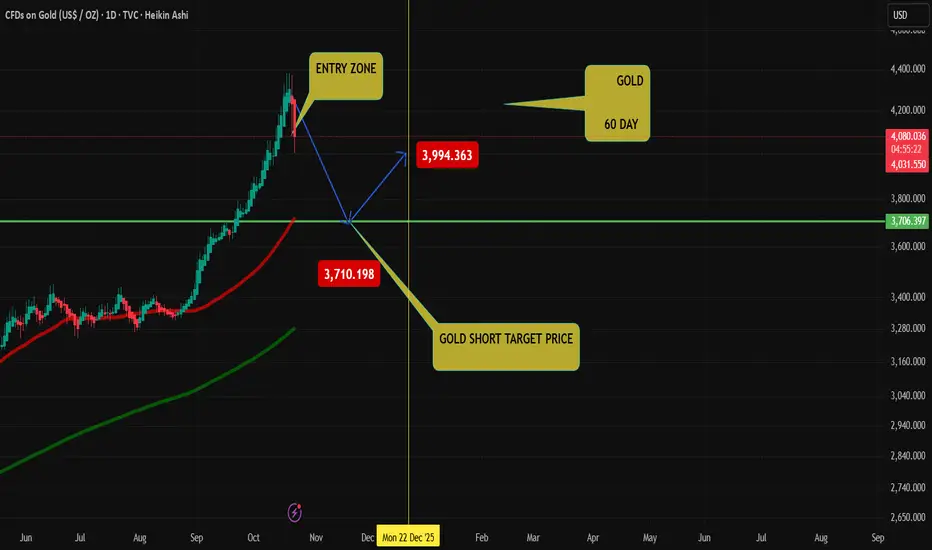
GOLD US SHORTGOLD 60 DAY Target point
You try! Easy Money,
The gold Only long position after!!!
check my profile gold / play button
10.22 Gold rebounds and continues to be shortGold's 4-hour moving average has formed a death cross, signaling a downward bearish trend. Gold still has downward momentum. Despite today's rebound in the US market, it continued to decline rapidly. This suggests the bullish rally is weakening. Gold rebounded to around 4085 before turning downward. While gold remains under pressure at 4085, it's still a good time to continue shorting.
Gold has formed a short-term bearish double top, and the bullish rebound has failed to re-stabilize the neckline of the double top. Gold remains a bearish market, and rebounds continue to offer opportunities for short sellers.

Bitcoin V Gold V DXY. Who is loosing less right now ?
These charts are all 4 hour charts
The Main chart is Bitcoin USD INDEX and on the Right is CFD's on GOLD
The SMA's are 50 - RED, 100 - BLUE, 128 - GREEN and 200 - YELLOW
Just in the SMA's we can see Gold is in better shape with PA above all SMA lines.
Gold also coming down onto a strong Fib line of support just below the 100 SMA that it just bounced on.
We have to wait and see if this holds.
Bitcoin PA is under resistance, below its SMA's and below the nearest Fib Extension line
However, Strong line of support just below.
So, initially, it looks line GOLD is doing better.
One way to know for sure is to look at the BTCXAUt chart. This is BTC trade Pair with GOLD
This is the 4 hour BITCXAUt left and Gold on the right again. Same colour code for SMA'a
Lopk at that GREEN Candle on the BTCXAUt chart
This implies that BITCOIN is gaining on Gold, OR more accurately, is loosing LESS
This needs to be watched closely as both are approaching lies of support / Resistance.
The rest of this week is going to be interesting to say the least.
And we do have to look at how the USD DXY INDEX is doing.
So, on this 4 hour chart, we see DXY gaining and above its SMA's
The DXY is simply the $ performance against other major currencies.
CONCLUSION
If you want to remain in an asset, it is better to hold on to your BITCOIN for a number of reasons.
Mostly as it is loosing less than Gold right now and, after it has been falling a lot longer, is more likely to Rise again soon, providing the Bulls are ready to step in.
Bitcoin is OVERSOLD on 4 hour & Daily and getting there on the weekly.
GOLD is OVERBOUGHT on most time frames now.
CAUTION is the name of the Game right now.
However, You could sell out to a USD stable coin and while the amount of USDT may not increase, its Value appears to be climbing.
The question is for how long ----------- Amd as mentioned just above, there is little point selling out to another currency as the $ is outperforming them all
In the USA, on the 24th, we have the updated inflation figures Due with the figures expected to remain static.
This WILL effect markets and, for me, is certainly why we may just hang around where we are right now in prices.
BUT we should also be prepared for some Volatility. We have been seeing how markets seem to move just before announcements....
stay safe and , as always, Time will tell
