XAU/USD 21 October 2025 Intraday AnalysisH4 Analysis:
-> Swing: Bullish.
-> Internal: Bullish.
Analysis and bias remains the same as yesterday's analysis dated 20 October 2025.
Price has printed as per previous intraday expectation by printing a bearish CHoCH which indicates, but not confirms, bullish pullback phase initiation.
Price is currently trading within an established internal range, however, I will continue to monitor price with regards to depth of pullback.
Intraday expectation:
Price to continue bearish, react at either discount of 50% internal EQ, or H4 supply zone before targeting weak internal high priced at 4,380. 990.
Note:
The Federal Reserve’s sustained dovish stance, coupled with ongoing geopolitical uncertainties, is likely to prolong heightened volatility in the gold market. Given this elevated risk environment, traders should exercise caution and recalibrate risk management strategies to navigate potential price fluctuations effectively.
Additionally, gold pricing remains sensitive to broader macroeconomic developments, including policy decisions under President Trump. Shifts in geopolitical strategy and economic directives could further amplify uncertainty, contributing to market repricing dynamics.
H4 Chart:
M15 Analysis:
-> Swing: Bullish.
-> Internal: Bearish.
Analysis and bias remains the same as yesterday's analysis dated 20 October 2025.
I have been mentioning in my alternative scenario for almost 1-month that all higher timeframes are requiring a pullback, and we are seeing a narrowing of internal structure, price could target strong internal low. This is how price printed.
Price has printed a bearish iBOS after a very long duration and subsequently a bullish CHoCH to indicate, but not confirm bullish pullback phase initiation.
The bearish iBOS has also confirmed the swing-high.
Intraday expectation:
Price to continue bullish, react at either premium of 50%, or M15 demand zone, before targeting weak internal low priced at 4,185.910.
Note:
Gold remains highly volatile amid the Federal Reserve's continued dovish stance, persistent and escalating geopolitical uncertainties. Traders should implement robust risk management strategies and remain vigilant, as price swings may become more pronounced in this elevated volatility environment.
Additionally, President Trump’s tariff announcements, particularly against China, are expected to further amplify market turbulence, potentially triggering sharp price fluctuations and whipsaws.
M15 Chart:
Goldusd

Gold (XAUUSD) Weekly TF 2025Overview
This analysis outlines the structural Fibonacci confluences, scenario planning, and macro-aligned projections for Gold (XAUUSD) on the weekly timeframe. It integrates multi-layered Fibonacci extensions and retracements, mapping out key support and resistance levels, and proposes a nuanced primary scenario that includes both intermediate rallies and corrective movements.
Primary Scenario – Multi-Stage Movement Hypothesis
We anticipate that gold may initially extend higher from the current level (~$3,325) to test the 127.2% Fibonacci extension at $3,435, with the possibility of a further intermediate peak near $3,500. This level marks a psychological and technical resistance zone and could act as a temporary top.
Following this local peak, a corrective phase may unfold. This pullback could evolve into one of the two outlined correction scenarios:
1 TP Correction Scenario
Support Target: ~$2,950
Basis: 100% Fib extension confluence and prior resistance turned support
Expected Outcome: Price stabilizes at this level and resumes upward momentum
2 TP Correction Scenario
Support Target: ~$2,650
Basis: Strong historical structure + 100% Fib confluence from a broader cycle
Expected Outcome: This zone acts as a long-term demand accumulation area
Upon completion of the corrective structure, we expect gold to reinitiate its primary bullish trend.
Bullish Continuation Targets
TP1: ~$4,050 (161.8% Fibonacci extension)
TP2: ~$4,319 (261.8% Fibonacci extension)
These targets align with macroeconomic conditions, central bank accumulation trends, and long-term structural cycles.
Supporting Technicals
RSI: Holding above 50, indicating preserved bullish momentum
MACD: Positive crossover with widening histogram on weekly timeframe
Price Action: Strong support zone between $3,280–$3,300 aligning with 161.8% Fib retracement of the recent minor wave
Macro Fundamentals & Correlations
Central Bank Gold Demand: Sustained net buying by BRICS nations, particularly China and Russia, supports the structural bid on gold
Fed Policy: Market anticipates a prolonged pause or gradual rate cuts, favoring non-yielding assets like gold
DXY & US10Y Yields: Any further decline in DXY or softening yields would add tailwinds to gold
Crypto Correlation: During inflationary hedging or systemic risk periods, gold and crypto may correlate positively, especially with weakening USD
Intermarket Relationships: Gold, DXY, and TOTAL (Crypto Market Cap)
Gold vs. DXY (US Dollar Index)
Gold historically maintains an inverse correlation with DXY. A rising DXY tends to apply downward pressure on gold prices, while a falling DXY enhances gold's upside momentum.
Scenario Interactions:
If DXY breaks below 98, this could validate the bullish scenario for gold toward $3,435–$4,050.
If DXY rallies back above 100, it could trigger the correction scenarios ($2,950 or $2,650) in gold.
Gold vs. TOTAL (Crypto Market Cap)
Gold and TOTAL may show positive correlation during periods of USD weakening and global liquidity expansion.
Scenario Interactions:
If gold rallies toward $3,500 and TOTAL also breaks key resistance (e.g., $1.8T–$2T), this signals synchronized bullish risk appetite.
If gold corrects while TOTAL continues to rise, it could indicate rotation of liquidity from defensive to risk-on assets.
A simultaneous correction in both may occur if DXY strengthens aggressively or if macro shocks reduce global liquidity.
These intermarket relationships should be monitored continuously to assess the evolving macro context and validate the chosen scenario.
In the case of a gold correction toward $2,950 or $2,650, the impact on altcoins will hinge on the prevailing macroeconomic backdrop. If the correction stems from a healthy, technical rebalancing within a risk-on environment—without a concurrent surge in the U.S. dollar—it could signal a shift in capital from defensive assets like gold into more speculative plays, including altcoins. This type of capital rotation often benefits the crypto market, particularly if TOTAL (crypto market cap) holds or advances structurally. However, if the correction is caused by rising dollar strength, tightening financial conditions, or broader risk-off sentiment, altcoins may instead suffer alongside gold, as liquidity is withdrawn across the board. Therefore, the context and drivers behind gold’s correction are crucial in assessing its downstream effects on altcoin performance.
From a philosophical lens, gold's cyclical ascent and retreat mirrors the rhythm of nature and human experience—expansion, contraction, and renewal. Just as rivers carve valleys before surging toward the ocean, the market too must surrender gains to gather force. A correction in gold is not merely a financial event, but a moment of recalibration—an inhale before the next exhale of momentum. It invites reflection: whether wealth seeks refuge or ventures into risk, whether fear contracts or ambition expands. In this interplay, altcoins may inherit the restless spirit of capital in search of yield, as gold, the ancient anchor of value, briefly pauses in its timeless journey.
Conclusion
We present a multi-phased path for gold where:
An initial bullish breakout toward $3,435–$3,500 forms a short- to mid-term peak
A subsequent correction brings gold to either $2,950 or $2,650, depending on macro triggers
A renewed bull rally drives gold toward $4,050 and potentially $4,319 and beyond
This scenario reflects both the cyclical nature of market structure and the macro-fundamental backing that continues to support long-term gold strength.

XAU/USD 20 October 2025 Intraday AnalysisH4 Analysis:
-> Swing: Bullish.
-> Internal: Bullish.
Price has printed as per previous intraday expectation by printing a bearish CHoCH which indicates, but not confirms, bullish pullback phase initiation.
Price is currently trading within an established internal range, however, I will continue to monitor price with regards to depth of pullback.
Intraday expectation:
Price to continue bearish, react at either discount of 50% internal EQ, or H4 supply zone before targeting weak internal high priced at 4,380. 990.
Note:
The Federal Reserve’s sustained dovish stance, coupled with ongoing geopolitical uncertainties, is likely to prolong heightened volatility in the gold market. Given this elevated risk environment, traders should exercise caution and recalibrate risk management strategies to navigate potential price fluctuations effectively.
Additionally, gold pricing remains sensitive to broader macroeconomic developments, including policy decisions under President Trump. Shifts in geopolitical strategy and economic directives could further amplify uncertainty, contributing to market repricing dynamics.
H4 Chart:
M15 Analysis:
-> Swing: Bullish.
-> Internal: Bearish.
I have been mentioning in my alternative scenario for almost 1-month that all higher timeframes are requiring a pullback, and we are seeing a narrowing of internal structure, price could target strong internal low. This is how price printed.
Price has printed a bearish iBOS after a very long duration and subsequently a bullish CHoCH to indicate, but not confirm bullish pullback phase initiation.
The bearish iBOS has also confirmed the swing-high.
Intraday expectation:
Price to continue bullish, react at either premium of 50%, or M15 demand zone, before targeting weak internal low priced at 4,185.910.
Note:
Gold remains highly volatile amid the Federal Reserve's continued dovish stance, persistent and escalating geopolitical uncertainties. Traders should implement robust risk management strategies and remain vigilant, as price swings may become more pronounced in this elevated volatility environment.
Additionally, President Trump’s tariff announcements, particularly against China, are expected to further amplify market turbulence, potentially triggering sharp price fluctuations and whipsaws.
M15 Chart:

XAU/USD: Bullish Surge to 4400?As the previous analysis worked exactly as predicted, OANDA:XAUUSD is setting up for a bullish surge on the 4-hour chart , where price is bouncing off a solid upward trendline, converging with the EMA 50 as dynamic support and a key support zone, signaling potential continuation of the uptrend amid recent consolidation. This confluence creates a strong buying opportunity if buyers hold the line against short-term pullbacks.
Entry zone between 4090-4165 for a long position. Targets at 4380 (first) and 4400 (second) near the resistance zone, delivering a risk-reward ratio close to 1:3 . Set a stop loss on a close below 4090 to mitigate downside risks. 🌟 Monitor for confirmation via a bullish candle close above the entry with building volume, capitalizing on gold's safe-haven appeal in uncertain markets.
Fundamentally , no major news events are observed in the economic calendar today. However, key Chinese data releases such as the PBoC interest rate decision and Q3 GDP could indirectly influence gold through global risk sentiment and commodity demand. 💡
📝 Trade Plan:
✅ Entry Zone: $4,090 – $4,165 (buy zone near trendline + EMA 50)
❌ Stop Loss: Close below $4,090
🎯 Targets:
TP1: $4,380 (initial resistance)
TP2: $4,400 (major resistance / extended target)
💎 Risk-to-Reward: Approx. 1:3, offering a strong technical edge.
What's your take on this gold setup? Comment below! 👇

Central Bank Digital Currencies (CBDCs)Introduction
In recent years, Central Bank Digital Currencies (CBDCs) have emerged as a transformative force in the global financial landscape. These digital currencies, issued and regulated by central banks, represent a significant evolution from traditional physical currencies. Unlike cryptocurrencies, which operate on decentralized networks, CBDCs are centralized and aim to combine the benefits of digital innovation with the stability of government-backed money. This essay delves into the role of CBDCs in the world market trading system, exploring their types, functionalities, advantages, challenges, and their potential to reshape global trade and finance.
Understanding CBDCs
CBDCs are digital forms of a country's fiat currency, issued and regulated by its central bank. They are designed to coexist with physical cash and are fully backed by the central bank, ensuring their value and stability. There are two primary types of CBDCs:
Retail CBDCs: These are intended for use by the general public, functioning similarly to physical cash but in a digital format. They aim to provide a secure, efficient, and inclusive means of payment for everyday transactions.
Wholesale CBDCs: These are designed for use by financial institutions for interbank settlements and large-value transactions. They facilitate faster, more secure, and cost-effective cross-border payments and capital market operations.
The Role of CBDCs in Global Trade
CBDCs have the potential to revolutionize the global trading system in several key ways:
Enhancing Payment Efficiency: Traditional cross-border payments often involve multiple intermediaries, leading to delays, high costs, and increased risk. CBDCs can streamline these processes by enabling direct transactions between parties, reducing the need for intermediaries and thus lowering transaction costs and time.
Improving Financial Inclusion: By providing a digital form of central bank money, CBDCs can offer unbanked and underbanked populations access to secure and efficient financial services, fostering greater financial inclusion globally.
Strengthening Monetary Policy Implementation: CBDCs provide central banks with a new tool to implement monetary policy more effectively. They can offer real-time data on economic activity and enable more precise control over money supply and interest rates.
Facilitating Cross-Border Trade: Wholesale CBDCs can simplify and expedite cross-border trade by reducing currency conversion costs, mitigating exchange rate risks, and enhancing the transparency and security of international transactions.
Advantages of CBDCs
The adoption of CBDCs offers several advantages:
Security and Trust: As government-backed digital currencies, CBDCs offer a high level of security and trust, reducing the risks associated with private digital currencies.
Cost Reduction: By eliminating intermediaries and streamlining payment processes, CBDCs can significantly reduce transaction costs.
Speed and Efficiency: CBDCs can facilitate near-instantaneous transactions, enhancing the speed and efficiency of financial operations.
Transparency and Traceability: The digital nature of CBDCs allows for enhanced transparency and traceability of transactions, aiding in the fight against money laundering and other illicit activities.
Challenges and Considerations
Despite their potential, the implementation of CBDCs presents several challenges:
Privacy Concerns: The digital nature of CBDCs raises concerns about user privacy and data security. Striking a balance between transparency and privacy is crucial.
Cybersecurity Risks: As digital assets, CBDCs are susceptible to cyberattacks and require robust security measures to protect against potential threats.
Regulatory and Legal Issues: The introduction of CBDCs necessitates comprehensive regulatory frameworks to address issues related to legal tender, cross-border transactions, and financial stability.
Technological Infrastructure: Developing and maintaining the technological infrastructure for CBDCs requires significant investment and expertise.
Market Disruption: The introduction of CBDCs could disrupt existing financial systems and markets, necessitating careful planning and coordination to mitigate potential negative impacts.
Global Initiatives and Developments
Numerous countries are exploring or piloting CBDCs:
China: The People's Bank of China has been at the forefront, launching the digital yuan (e-CNY) and conducting extensive pilot programs across various cities.
European Union: The European Central Bank is exploring the digital euro, focusing on enhancing payment efficiency and financial inclusion within the Eurozone.
United States: The Federal Reserve is researching the potential benefits and risks of a digital dollar, with ongoing studies and consultations.
India: The Reserve Bank of India has initiated pilot projects for the digital rupee, aiming to modernize the payment infrastructure and enhance financial inclusion.
These initiatives reflect a global recognition of the potential benefits of CBDCs and a concerted effort to integrate them into the existing financial ecosystem.
Impact on Global Financial Markets
The integration of CBDCs into global financial markets could have profound effects:
Market Liquidity: CBDCs can enhance market liquidity by providing a new form of central bank money that can be easily traded and settled.
Capital Flows: The ease of cross-border transactions facilitated by CBDCs can lead to more efficient capital flows, potentially altering investment patterns and global financial dynamics.
Currency Competition: The widespread adoption of CBDCs could lead to increased competition among currencies, influencing exchange rates and monetary policies.
Financial Stability: While CBDCs can enhance financial stability by providing a secure and efficient means of payment, they also introduce new risks that need to be carefully managed.
Conclusion
Central Bank Digital Currencies represent a significant advancement in the evolution of money and finance. Their potential to enhance payment efficiency, improve financial inclusion, and strengthen monetary policy implementation positions them as a cornerstone of the future global trading system. However, their successful integration requires careful consideration of privacy, security, regulatory, and technological challenges. As countries continue to explore and implement CBDCs, their impact on global trade and finance will unfold, potentially reshaping the financial landscape in profound ways.

$BTC Vs. $GOLDBitcoin / Gold is near its historical bottom.
Is back in the long-term demand zone, as it was at the 2020 and 2023 lows.
RSI indicator is also almost exactly the same as the previous two lows.
This structure has historically always been a precursor to a strong trend reversal.
Reaction from these areas in 2020 and 2023 led to significant appreciation in Bitcoin against gold.
Today the picture is similar again both price and momentum point to the same bottom scenario.

XAU/USD 17 October 2025 Intraday AnalysisH4 Analysis:
-> Swing: Bullish.
-> Internal: Bullish.
Analysis and bias remains the same as yesterday's analysis, however CHoCH positioning has moved closer to more recent price action.
Price has printed a further bullish iBOS, however, I will apply discretion and not classify it as such due to the insignificant depth of pullback relative to recent price action.
At the time of this analysis price is continuing to print bullish without pause, which, as a result, I am unable to confirm a fractal high.
Current bearish CHoCH positioning is denoted with a blue horizontal dotted line.
Intraday expectation:
Price to print bearish CHoCH to indicate bearish pullback phase initiation.
Note:
The Federal Reserve’s sustained dovish stance, coupled with ongoing geopolitical uncertainties, is likely to prolong heightened volatility in the gold market. Given this elevated risk environment, traders should exercise caution and recalibrate risk management strategies to navigate potential price fluctuations effectively.
Additionally, gold pricing remains sensitive to broader macroeconomic developments, including policy decisions under President Trump. Shifts in geopolitical strategy and economic directives could further amplify uncertainty, contributing to market repricing dynamics.
H4 Chart:
M15 Analysis:
-> Swing: Bullish.
-> Internal: Bullish.
Price has continued bullish printing further ATH's.
Price has printed a further bullish iBOS and has again reacted from discount of 50% EQ.
Intraday expectation:
Price to target weak internal high, priced at 4,380.990.
Alternative scenario: As all higher timeframes are requiring a pullback, and we are seeing a narrowing of internal structure, price could target strong internal low.
Note:
Gold remains highly volatile amid the Federal Reserve's continued dovish stance, persistent and escalating geopolitical uncertainties. Traders should implement robust risk management strategies and remain vigilant, as price swings may become more pronounced in this elevated volatility environment.
Additionally, President Trump’s tariff announcements, particularly against China, are expected to further amplify market turbulence, potentially triggering sharp price fluctuations and whipsaws.
M15 Chart:

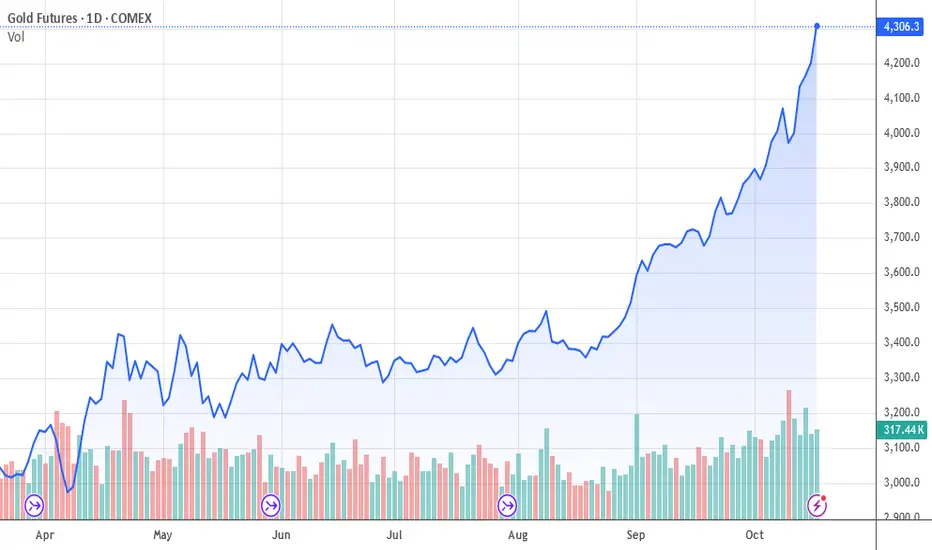
Is There an End to Gold’s Price Surge?The price of gold has already reached $4,300 per ounce. As we have repeatedly mentioned in our analyses, once gold starts moving upward, there’s no stopping it — and this prediction is now being confirmed.
Since mid-August 2025, gold has gained nearly $1,000 per ounce in just two months. Few could have imagined such a move, yet it was entirely foreseeable given today’s global conditions.
The world remains deeply unstable — with the shift toward digital currencies, ongoing wars, and soaring national debts that push governments to borrow endlessly. These factors drive investors and ordinary people alike to seek safety in gold and real estate.
The momentum behind gold is unlikely to end in the coming months. As we’ve projected before, the price trend remains strongly bullish.
At World-Signals, we expect a minor correction just before the $5,000 level, likely a pullback of $400–$500, followed by a continuation of the uptrend throughout 2026.
It’s not impossible that those holding just a few gold bars by 2026 could find themselves millionaires.
XAU/USD 16 October 2025 Intraday AnalysisH4 Analysis:
-> Swing: Bullish.
-> Internal: Bullish.
Analysis and bias remains the same as yesterday's analysis, however CHoCH positioning has moved closer to more recent price action.
Price has printed a further bullish iBOS, however, I will apply discretion and not classify it as such due to the insignificant depth of pullback relative to recent price action.
At the time of this analysis price is continuing to print bullish without pause, which, as a result, I am unable to confirm a fractal high.
Current bearish CHoCH positioning is denoted with a blue horizontal dotted line.
Intraday expectation:
Price to print bearish CHoCH to indicate bearish pullback phase initiation.
Note:
The Federal Reserve’s sustained dovish stance, coupled with ongoing geopolitical uncertainties, is likely to prolong heightened volatility in the gold market. Given this elevated risk environment, traders should exercise caution and recalibrate risk management strategies to navigate potential price fluctuations effectively.
Additionally, gold pricing remains sensitive to broader macroeconomic developments, including policy decisions under President Trump. Shifts in geopolitical strategy and economic directives could further amplify uncertainty, contributing to market repricing dynamics.
H4 Chart:
M15 Analysis:
-> Swing: Bullish.
-> Internal: Bullish.
Price has continued bullish printing further ATH's.
Price has printed a bullish iBOS and has reacted from discount of 50% EQ.
Intraday expectation:
Price to target weak internal high, priced at 4,242.380.
Alternative scenario: As all higher timeframes are requiring a pullback, and we are seeing a narrowing of internal structure, price could target strong internal low.
Note:
Gold remains highly volatile amid the Federal Reserve's continued dovish stance, persistent and escalating geopolitical uncertainties. Traders should implement robust risk management strategies and remain vigilant, as price swings may become more pronounced in this elevated volatility environment.
Additionally, President Trump’s tariff announcements, particularly against China, are expected to further amplify market turbulence, potentially triggering sharp price fluctuations and whipsaws.
M15 Chart:

Gold/USD: Bullish Climb to $4100?OANDA:XAUUSD is showing a bullish setup on the 1-hour chart , with an entry zone between $3,963-$3,985 near a key support level.
First target at $4,075 marks initial resistance, while the second at $4,100 offers a deeper upside potential. Set a stop loss on a close below $3,940 to manage risk effectively. 🌟
A break above $3,985 with strong volume could confirm this move, driven by safe-haven demand and USD dynamics. Watch economic data trends! 💡
📝 Trade Plan:
✅ Entry Zone: $3,963 – $3,985 (support area)
❌ Stop Loss: Daily close below $3,940
🎯 Targets:
TP1: $4,075 (initial resistance)
TP2: $4,100 (extended target)
Ready for this rally? Drop your thoughts below! 👇

Gold Showed the Way... Is Bitcoin Next?Gold began a parabolic run after breaking through the Fibonacci 1.382 – 1.414 zone.
Now Bitcoin is gathering strength at the same threshold...
Historical similarity in setup
Gold broke through and became parabolic.
Next up Bitcoin
History often maps out the future.
Bitcoin, the “digital gold,” is preparing for its own run.
CRYPTOCAP:BTC Vs. TVC:GOLD 🔃

10.9 Gold Short-term Intraday Operation Guide!!!Technical Analysis:
The 4-hour chart shows support at the middle line and near the MA30 moving average, corresponding to 3986 and 3947, respectively. The Bollinger Bands have also begun to narrow, indicating a volatile, compressed, and retest pattern in the 4-hour chart. Focus is currently on the upward pressure of 4032, near the MA5 moving average.
The 3-hour chart saw a rapid drop to 4001 this morning before bottoming out near 4008 and rebounding to 4036. The MACD formed a dead cross with high volume, and the STO indicator is trading at a low level, indicating weak 4-hour volatility. The high point of the morning rebound, the middle line of the hourly chart, has become the current resistance point at 4036. Meanwhile, support between 3999 and 4000 is a key focus today.
On the daily chart, focus on yesterday's highs and lows, 4059, and 3984. For the daily chart to rise, it must not fall below yesterday's lows but must break above yesterday's highs. However, considering the current volatile decline in the 4-hour chart, it is obvious that it will be difficult to go up in the morning session, so 4032 and 4050-59 become today's shorting points; and for the time being, we will focus on the morning low of 4001 and yesterday's low of 3984.
10.8 Gold Daily Short-Term Operation Guide!!!In the 1-hour chart, the Asian session continues to rise with $3985 as support. A quick pullback would be an opportunity to buy in. Unless the Asian session decline continues in the European session and then in the US session, or if the Asian session breaks the bottom in the European session and fails to continue in the US session, don't try to bet on a pullback; instead, follow the trend.
Secondly, give up on speculating on the top. Currently, the strong upward trend remains unchanged on both the daily and 4-hour charts. Even after breaking through $4000 in the short term, there's still no sign of an end. While bullish, be wary of pullbacks. In other words, be prepared for a pullback and avoid chasing orders.
If the pullback approaches the $4000-3980 range, buy long. If the European session's strength doesn't offer opportunities, and there are further pullbacks before the US market opens, keep an eye on $4030-4050.
XAUUSD Gold to 4KTimeline is 6 months - 2 years
The crash has already started. At some point everyone will start to sell thier treasury bonds, yields will go up proportionally to inflation until the dollar loses it's status as the global currency and dramatic measures are used to stop inflation resulting in stagflation and yield recovery. Else hyper inflation and the dollar is replaced entirely.
I see the momentum indicators shifting in various markets. Below is a brief summary of each, relevant indicators/markets. see charts.
US1YRBILLS
WTI CRUDE
SILVERUSD
BONKCOIN
TSLA

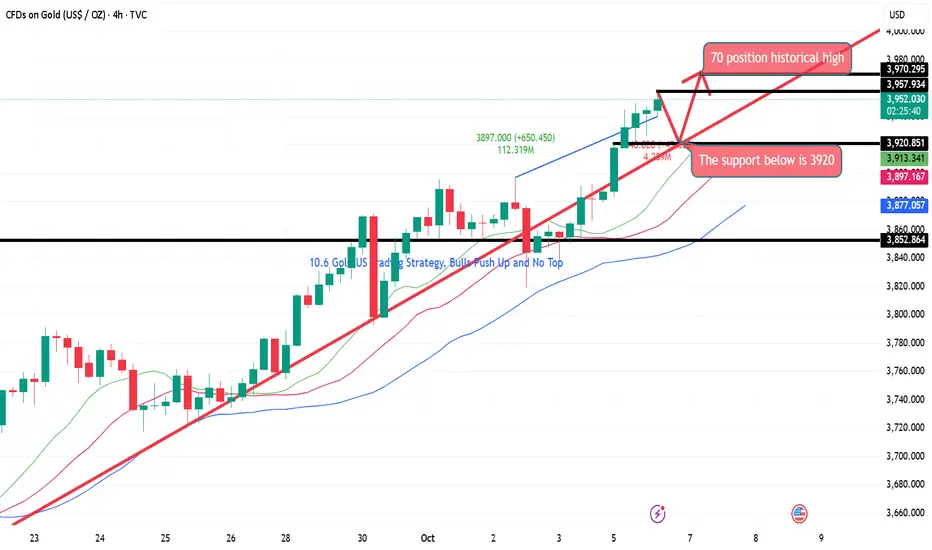
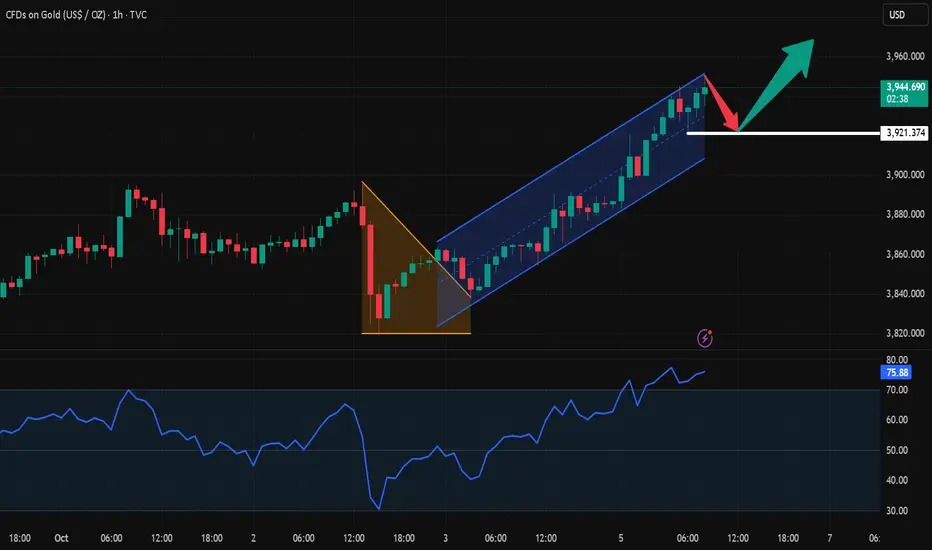
10.6 Gold US Trading Strategy, Bulls Push Up and No TopLooking at the 4-hour market trend, we are watching for short-term support at 3920, with a focus on the 3895-3900 support level. The bulls are rising strongly and there is no end in sight. Trading strategies should focus on buying on pullbacks. For intermediate positions, we should be cautious in chasing orders and patiently wait for key entry points. I will provide detailed trading strategies during the trading session, so please pay attention.
10.6 Gold European Short-term Technical Analysis!!!Gold has been rising for several consecutive weeks, breaking through the upper Bollinger Band on the weekly chart, and the RSI has reached the overbought zone, suggesting further upward movement. Friday saw a small bullish close, and today's Asian session saw further gains. The daily RSI has again reached the overbought zone, and the 4-hour chart is above the upward trend line, breaking through the ascending triangle.
Trade Recommendation: BUY: 3920 Target: 3940 3950
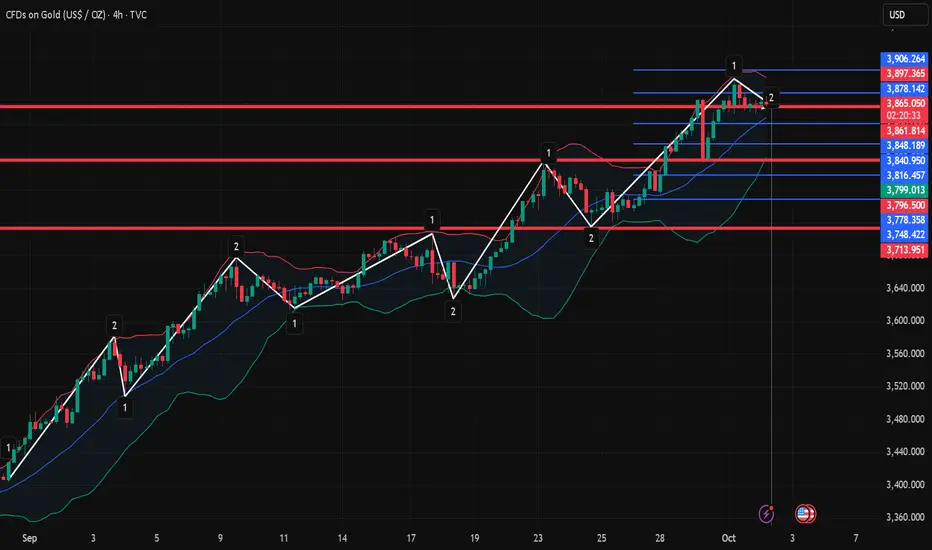
10.2 Gold fluctuates at a high level!!!Market Analysis:
① The daily MACD is forming a golden cross at a high level with high volume and volatility, and the STO indicator is overbought, indicating a high-priced trend. A candlestick chart with a hanging line after consecutive long-term bullish candlesticks indicates high-priced volatility, with the risk of a pullback. This is unless another long-term bullish candlestick pattern breaks yesterday's hanging line.
Therefore, today's upside focus is on yesterday's high of 3895. A break above this level could push the price towards the 4000 mark.
Current daily support lies near the MA5 and MA10 moving averages, corresponding to support levels of 3837 and 3787. However, the MA10 moving average has no chance of success, so the main focus for the day is support at 3837. This means the intraday range remains between 3837 and 3895.
② The 4-hour MACD is forming a high-level death cross, and the STO indicator's fast line is showing an upward curve, indicating a volatile trend in the 4-hour chart. Short-term support in the 4-hour chart lies near the middle line at 3844, but this is expected to gradually move up to around 3850 over time. We observe that the three Bollinger Bands on the 4-hour chart are currently narrowing, indicating range-bound fluctuations. The upper band is currently holding pressure at 3901, but it will likely move down to around 3890-95 over time.
③ On the hourly chart, the three Bollinger Bands are also narrowing, with the lower band and the MA60 moving average currently supporting the 3852-54 level. If the price falls below 3852, a downward trend is likely.
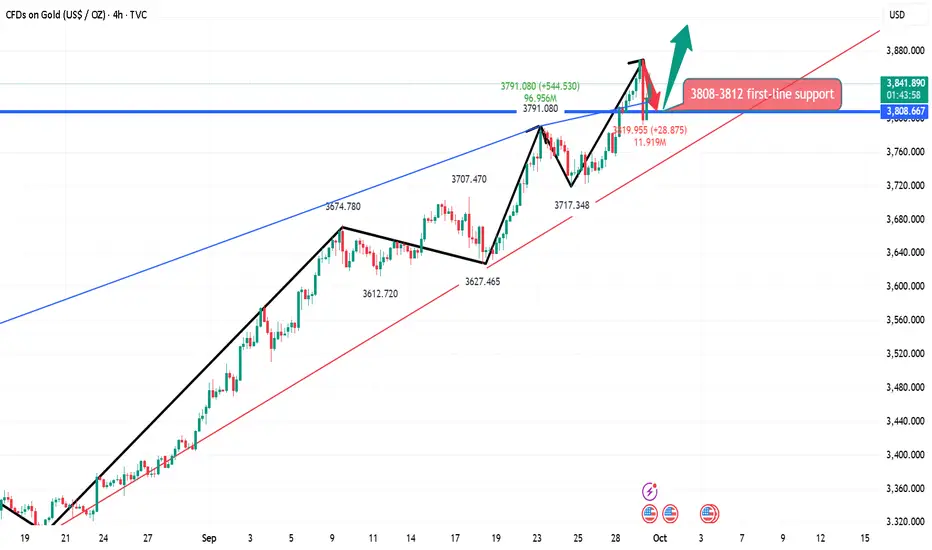
Gold fell as expected, and subsequent pullbacks led to long posiBased on the 4-hour analysis, support is focused on the 3800-95 level. The bulls are rising strongly and there's no end in sight. Trading strategies should primarily focus on buying on pullbacks. In the intermediate range, be cautious and wait for key entry points. I'll provide detailed trading strategies during the trading session, so please stay tuned.
Gold Trading Strategies:
1. Buy gold at the 3800-05 level, and add to your long position on pullbacks to the 3785-90 level. Set a stop loss at 3778 and target the 3845-3850 level.
XAU/USD 30 September 2025 Intraday AnalysisH4 Analysis:
-> Swing: Bullish.
-> Internal: Bullish.
Price printed as per yesterday's intraday analysis whereby I mentioned in alternative scenario that price could print higher.
Price is currently trading within an internal low and fractal high. CHoCH positioning is denoted with a blue horizontal dotted line.
Intraday Expectation:
Price to print bearish CHoCH to indicate bearish pullback phase initiation, price to then trade down to either discount of internal 50% EQ, or H4 supply zone before targeting weak internal high priced at 3,871.890.
Alternative scenario: Price could potentially print higher-highs.
Note:
The Federal Reserve’s sustained dovish stance, coupled with ongoing geopolitical uncertainties, is likely to prolong heightened volatility in the gold market. Given this elevated risk environment, traders should exercise caution and recalibrate risk management strategies to navigate potential price fluctuations effectively.
Additionally, gold pricing remains sensitive to broader macroeconomic developments, including policy decisions under President Trump. Shifts in geopolitical strategy and economic directives could further amplify uncertainty, contributing to market repricing dynamics.
H4 Chart:
M15 Analysis:
-> Swing: Bullish.
-> Internal: Bullish.
As per alternative scenario of yesterday's intraday analysis, price continued to push higher.
Price subsequently printed a bearish CHoCH before continuing with it's bullish momentum, however, I shall not classify this due to the very insignificant pullback. This has been marked in red.
Price is currently trading within an established internal range.
Intraday Expectation:
Price to trade down to either M15 supply zone, or discount of 50% EQ before targeting weak internal high priced at 3,871.890.
Alternative Scenario: Price could potentially target strong internal low as H4 TF enters it's bearish pullback phase.
Note:
Gold remains highly volatile amid the Federal Reserve's continued dovish stance, persistent and escalating geopolitical uncertainties. Traders should implement robust risk management strategies and remain vigilant, as price swings may become more pronounced in this elevated volatility environment.
Additionally, President Trump’s recent tariff announcements are expected to further amplify market turbulence, potentially triggering sharp price fluctuations and whipsaws.
M15 Chart:

XAU/USD 29 September 2025 Intraday AnalysisH4 Analysis:
-> Swing: Bullish.
-> Internal: Bullish.
As per my analysis dated 22 September 2025, whereby I mentioned price could potentially continue to print higher-highs. This is how price printed, showing little to no signs of pullback phase initiation.
Price is currently trading within an internal low and fractal high. CHoCH positioning is denoted with a blue horizontal dotted line. Take note that CHoCH positioning as been brought significantly closer than previous, this allows for a more realistic chance of bearish pullback phase initiation.
Intraday Expectation:
Price to print bearish CHoCH to indicate bearish pullback phase initiation, price to then trade down to either discount of internal 50% EQ, or H4 supply zone before targeting weak internal high priced at 3,819.915.
Alternative scenario: Price could potentially print higher-highs.
Note:
The Federal Reserve’s sustained dovish stance, coupled with ongoing geopolitical uncertainties, is likely to prolong heightened volatility in the gold market. Given this elevated risk environment, traders should exercise caution and recalibrate risk management strategies to navigate potential price fluctuations effectively.
Additionally, gold pricing remains sensitive to broader macroeconomic developments, including policy decisions under President Trump. Shifts in geopolitical strategy and economic directives could further amplify uncertainty, contributing to market repricing dynamics.
H4 Chart:
M15 Analysis:
-> Swing: Bullish.
-> Internal: Bullish.
Price has printed according to previous intraday expectation whereby I mentioned price to trade down to either M15 supply zone, or discount of 50% EQ before targeting weak internal high priced at 3,791.255.
Price has printed a bullish iBOS. CHoCH positioning is denoted with a blue dotted horizontal line.
Price is currently trading within an internal low and fractal high.
Intraday Expectation:
Price to print bearish CHoCH to indicate bearish pullback phase initiation. Price to then trade down to either M15 supply zone, or discount of 50% EQ before targeting weak internal high priced at 3,819.915
Alternative Scenario: Price could potentially continue to print higher.
Note:
Gold remains highly volatile amid the Federal Reserve's continued dovish stance, persistent and escalating geopolitical uncertainties. Traders should implement robust risk management strategies and remain vigilant, as price swings may become more pronounced in this elevated volatility environment.
Additionally, President Trump’s recent tariff announcements are expected to further amplify market turbulence, potentially triggering sharp price fluctuations and whipsaws.
M15 Chart:

XAU/USD 26 September 2025 Intraday AnalysisH4 Analysis:
-> Swing: Bullish.
-> Internal: Bullish.
Analysis and bias remains the same as analysis dated 24 September 2025.
As mentioned in analysis dated 04 September 2025, with respect to alternative scenario, price could potentially continue higher, is how price printed, price continued its bullish trajectory printing all-time-highs. This is continuing.
As per my analysis of yesterday, dated 22 September 2025, whereby I mentioned price could potentially continue to print higher-highs. This is how price printed, showing little to no signs of pullback phase initiation.
Price is currently trading within an internal low and fractal high. CHoCH positioning is denoted with a horizontal blue dotted line.
Intraday Expectation:
Price to print bearish CHoCH to indicate bearish pullback phase initiation, price to then trade down to either discount of internal 50% EQ, or H4 supply zone before targeting weak internal high priced at 3,791,255.
Alternative scenario: Price could potentially print higher-highs.
Note:
The Federal Reserve’s sustained dovish stance, coupled with ongoing geopolitical uncertainties, is likely to prolong heightened volatility in the gold market. Given this elevated risk environment, traders should exercise caution and recalibrate risk management strategies to navigate potential price fluctuations effectively.
Additionally, gold pricing remains sensitive to broader macroeconomic developments, including policy decisions under President Trump. Shifts in geopolitical strategy and economic directives could further amplify uncertainty, contributing to market repricing dynamics.
H4 Chart:
M15 Analysis:
-> Swing: Bullish.
-> Internal: Bullish.
Analysis and bias remains the same as analysis dated 24 September 2025.
As per analysis and intraday expectation of previous analysis, price has printed a bearish CHoCH, which is the first indication, but not confirmation, of bearish pullback phase initiation
Price is currently trading within an internal low and internal high.
Intraday Expectation:
Price to trade down to either M15 supply zone, or discount of 50% EQ before targeting weak internal high priced at 3,791.255.
Alternative Scenario: Price could potentially continue to print higher.
Note:
Gold remains highly volatile amid the Federal Reserve's continued dovish stance, persistent and escalating geopolitical uncertainties. Traders should implement robust risk management strategies and remain vigilant, as price swings may become more pronounced in this elevated volatility environment.
Additionally, President Trump’s recent tariff announcements are expected to further amplify market turbulence, potentially triggering sharp price fluctuations and whipsaws.
M15 Chart:

XAU/USD 25 September 2025 Intraday AnalysisH4 Analysis:
-> Swing: Bullish.
-> Internal: Bullish.
Analysis and bias remains the same as yesterday's analysis dated 24 September 2025.
As mentioned in analysis dated 04 September 2025, with respect to alternative scenario, price could potentially continue higher, is how price printed, price continued its bullish trajectory printing all-time-highs. This is continuing.
As per my analysis of yesterday, dated 22 September 2025, whereby I mentioned price could potentially continue to print higher-highs. This is how price printed, showing little to no signs of pullback phase initiation.
Price is currently trading within an internal low and fractal high. CHoCH positioning is denoted with a horizontal blue dotted line.
Intraday Expectation:
Price to print bearish CHoCH to indicate bearish pullback phase initiation, price to then trade down to either discount of internal 50% EQ, or H4 supply zone before targeting weak internal high priced at 3,791,255.
Alternative scenario: Price could potentially print higher-highs.
Note:
The Federal Reserve’s sustained dovish stance, coupled with ongoing geopolitical uncertainties, is likely to prolong heightened volatility in the gold market. Given this elevated risk environment, traders should exercise caution and recalibrate risk management strategies to navigate potential price fluctuations effectively.
Additionally, gold pricing remains sensitive to broader macroeconomic developments, including policy decisions under President Trump. Shifts in geopolitical strategy and economic directives could further amplify uncertainty, contributing to market repricing dynamics.
H4 Chart:
M15 Analysis:
-> Swing: Bullish.
-> Internal: Bullish.
Analysis and bias remains the same as yesterday's analysis dated 24 September 2025.
As per analysis and intraday expectation of previous analysis, price has printed a bearish CHoCH, which is the first indication, but not confirmation, of bearish pullback phase initiation
Price is currently trading within an internal low and internal high.
Intraday Expectation:
Price to trade down to either M15 supply zone, or discount of 50% EQ before targeting weak internal high priced at 3,791.255.
Alternative Scenario: Price could potentially continue to print higher.
Note:
Gold remains highly volatile amid the Federal Reserve's continued dovish stance, persistent and escalating geopolitical uncertainties. Traders should implement robust risk management strategies and remain vigilant, as price swings may become more pronounced in this elevated volatility environment.
Additionally, President Trump’s recent tariff announcements are expected to further amplify market turbulence, potentially triggering sharp price fluctuations and whipsaws.
M15 Chart :

XAUUSD — Rebound or Short-Term Downtrend Continuation?Gold just flushed hard into the support zone, reinforcing 3790 as a temporary top. What should we do now?
📉 Analysis
Price is reacting at resistance; wait for price action here.
Scenario 1: A clean break above opens a recovery toward the next resistance zone around .
Scenario 2: A retest/rejection at leads to another leg down toward , after which the broader uptrend can resume. A liquidity sweep/stop-run into is possible before price turns higher.
Key resistance: ,
Key support:
📊 Trading Plan
Wait for an Easy Trend reversal signal with high volume on 5m when price taps the marked support/resistance zones.
Price is rolling under the trendline; wait for an Easy Trend signal on 5m with high volume to confirm entry.
Example (ENTRY): On 5m timeframe, price broke below the trendline and printed an Easy Trend sell signal with heavy volume, followed by a sharp drop.
Risk management: Stop above the most recent M5 swing high ; move to break-even at 1R (R:R = 1:1).
