Gold is compressed; next week’s US data will pick a side.Gold is being compressed, the upcoming US data week will decide which side gets squeezed.
Good evening everyone, Brian here with a view on XAUUSD on the H2 and H4 frames for the upcoming week.
Fundamental Analysis – a "tailor-made" week for the USD
Next week is packed with US data, meaning gold will react more to numbers than narratives:
Core PPI, PPI, and Retail Sales
Initial Unemployment Claims
Prelim GDP q/q
Core PCE Price Index m/m – the Fed's preferred inflation gauge
If inflation and growth come out weak, the market will lean more towards the slow growth / easing policy narrative. This usually pressures the USD and supports gold, especially as real yields gradually decline.
Conversely, stronger-than-expected data will strengthen the USD, raise yields, and create short-term downward pressure on gold. In such a context, price and liquidity areas around news releases will be more important than usual – typically, fading emotional spikes back to structural areas is safer than chasing the initial move.
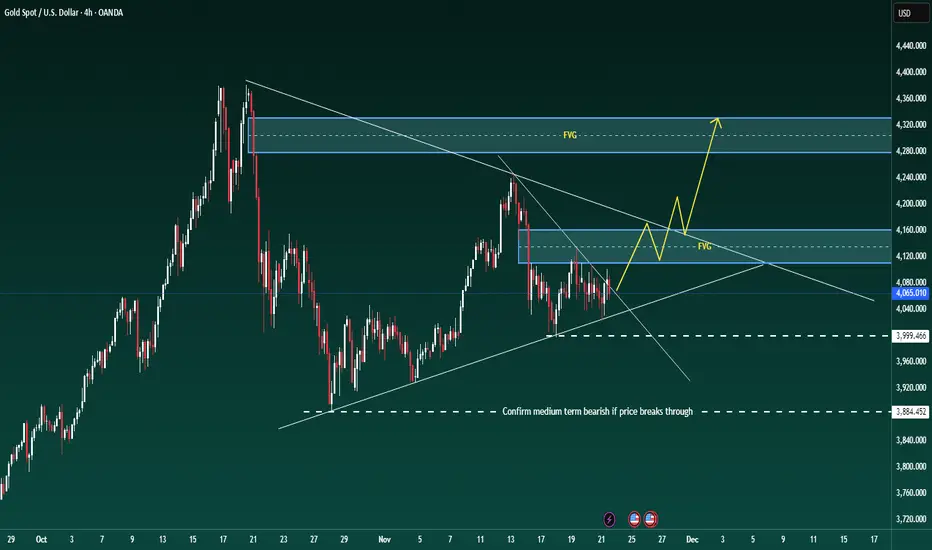
Technical Analysis – triangle, FVG, and key support areas
On the H4 frame, gold is still trading within a broad triangle structure. The previous decline has stalled, with prices continuously reacting at the upward support line and around 4,000, but there has yet to be a clear breakout from the pattern.
When zooming into H1–H2:
The price has broken a short-term downtrend line and closed strongly above – this is an early signal that selling pressure in this move is weakening.
The nearest support is around 4050–4040, deeper is the support band 4000–3998 (marked on the chart as important support). As long as it holds above 4,000, the structure remains positive.
Above, we have a very important confluence area around 4135–4160 including:
Fibo 0.382 of the most recent main decline
An old fair value gap (FVG) and resistance block
Chart note: "Gold will go strong if it passes this price range" – aligns with my view: if the price accepts above this area, the potential for a stronger upward move will open up.
Around 4100 is an area prone to a "large liquidity response" – expect strong profit-taking and position restructuring if the price returns to this area.
Currently, I see the market as accumulating above 4,000 in a corrective pattern, with a slight upward bias as long as 4,000 is maintained.
Key Price Areas
Resistance:
4100 – first liquidity area
4135–4160 – Fibo 0.382 + FVG + strong resistance
Support:
4050–4040 – nearest intraday support
4000–3998 – large frame support; if broken, it will change the picture
3940 area – stronger support if 4k is breached
Trading Scenarios for Next Week
(All are for reference only, not investment advice.)
Scenario 1 – Buy when the price adjusts above 4,000 (foundation for the next upward wave)
Idea: follow the forming upward bias as the price still respects the triangle support and the 4,000 mark.
Entry area: 4050–4040 or any clean retest of the broken downtrend line on smaller frames
Area for cautious position addition: 4025–4005 if there is a deep sweep to 4,000 with a strong rebound reaction
Stop Loss: below 3990–3988 depending on risk appetite
Targets:
First: 4100 (liquidity area)
Second: 4135–4140 (lower edge of FVG/resistance)
Extended: 4155–4160 if a strong continuation move appears
Signals to wait for: wick rejection from support, bullish engulfing candle, or clear intraday structural phase shift to a series of higher highs and lows.
Scenario 2 – Break & Retest Long above 4135–4140
If the price does not give a deep adjustment but runs straight up:
Condition: H2/H4 candle closes clearly above 4135–4140 and holds when retesting
Entry: when the price pulls back in a controlled manner to the 4135–4140 area, turning this area from resistance to support
SL: below 4120
TP: 4180 → 4200+ depending on momentum strength
This is the "gold goes strong" scenario as noted on the chart – viewing the FVG/0.382 area as a launchpad for a larger impulse wave.
Scenario 3 – Bearish scenario if 4,000 is broken
If fundamentals and cash flow turn against gold, decisively pushing the price below 4,000, the bullish view needs to be set aside.
Condition: daily candle closes clearly below 4000–3998
Plan: wait for the price to retrace up to retest 4000–4020 from below
Entry: short when rejection signals appear at that retest area
TP: 3960 → 3940, then reassess the structure
When below 4,000, the triangle will break down, and the market is likely to hunt deeper liquidity areas before potentially forming a new medium-term upward wave.
In summary: as long as 4,000 holds, I prioritize the buy scenario on adjustments, respecting the upward potential to 4135–4160 and beyond. If there is a decisive break below 4,000, the picture will reverse – then retracements up will be opportunities to look for shorts.
Trade according to what the structure shows, not what I hope for. Manage risk tightly around next week's data points and let the major price areas "do the heavy lifting."
If this perspective helps you plan better, don't forget to follow Brian for weekly gold analysis and share your scenarios in the comments to compare.
Goldweekly
Gold (XAUUSD) Weekly TF 2025Overview
This analysis outlines the structural Fibonacci confluences, scenario planning, and macro-aligned projections for Gold (XAUUSD) on the weekly timeframe. It integrates multi-layered Fibonacci extensions and retracements, mapping out key support and resistance levels, and proposes a nuanced primary scenario that includes both intermediate rallies and corrective movements.
Primary Scenario – Multi-Stage Movement Hypothesis
We anticipate that gold may initially extend higher from the current level (~$3,325) to test the 127.2% Fibonacci extension at $3,435, with the possibility of a further intermediate peak near $3,500. This level marks a psychological and technical resistance zone and could act as a temporary top.
Following this local peak, a corrective phase may unfold. This pullback could evolve into one of the two outlined correction scenarios:
1 TP Correction Scenario
Support Target: ~$2,950
Basis: 100% Fib extension confluence and prior resistance turned support
Expected Outcome: Price stabilizes at this level and resumes upward momentum
2 TP Correction Scenario
Support Target: ~$2,650
Basis: Strong historical structure + 100% Fib confluence from a broader cycle
Expected Outcome: This zone acts as a long-term demand accumulation area
Upon completion of the corrective structure, we expect gold to reinitiate its primary bullish trend.
Bullish Continuation Targets
TP1: ~$4,050 (161.8% Fibonacci extension)
TP2: ~$4,319 (261.8% Fibonacci extension)
These targets align with macroeconomic conditions, central bank accumulation trends, and long-term structural cycles.
Supporting Technicals
RSI: Holding above 50, indicating preserved bullish momentum
MACD: Positive crossover with widening histogram on weekly timeframe
Price Action: Strong support zone between $3,280–$3,300 aligning with 161.8% Fib retracement of the recent minor wave
Macro Fundamentals & Correlations
Central Bank Gold Demand: Sustained net buying by BRICS nations, particularly China and Russia, supports the structural bid on gold
Fed Policy: Market anticipates a prolonged pause or gradual rate cuts, favoring non-yielding assets like gold
DXY & US10Y Yields: Any further decline in DXY or softening yields would add tailwinds to gold
Crypto Correlation: During inflationary hedging or systemic risk periods, gold and crypto may correlate positively, especially with weakening USD
Intermarket Relationships: Gold, DXY, and TOTAL (Crypto Market Cap)
Gold vs. DXY (US Dollar Index)
Gold historically maintains an inverse correlation with DXY. A rising DXY tends to apply downward pressure on gold prices, while a falling DXY enhances gold's upside momentum.
Scenario Interactions:
If DXY breaks below 98, this could validate the bullish scenario for gold toward $3,435–$4,050.
If DXY rallies back above 100, it could trigger the correction scenarios ($2,950 or $2,650) in gold.
Gold vs. TOTAL (Crypto Market Cap)
Gold and TOTAL may show positive correlation during periods of USD weakening and global liquidity expansion.
Scenario Interactions:
If gold rallies toward $3,500 and TOTAL also breaks key resistance (e.g., $1.8T–$2T), this signals synchronized bullish risk appetite.
If gold corrects while TOTAL continues to rise, it could indicate rotation of liquidity from defensive to risk-on assets.
A simultaneous correction in both may occur if DXY strengthens aggressively or if macro shocks reduce global liquidity.
These intermarket relationships should be monitored continuously to assess the evolving macro context and validate the chosen scenario.
In the case of a gold correction toward $2,950 or $2,650, the impact on altcoins will hinge on the prevailing macroeconomic backdrop. If the correction stems from a healthy, technical rebalancing within a risk-on environment—without a concurrent surge in the U.S. dollar—it could signal a shift in capital from defensive assets like gold into more speculative plays, including altcoins. This type of capital rotation often benefits the crypto market, particularly if TOTAL (crypto market cap) holds or advances structurally. However, if the correction is caused by rising dollar strength, tightening financial conditions, or broader risk-off sentiment, altcoins may instead suffer alongside gold, as liquidity is withdrawn across the board. Therefore, the context and drivers behind gold’s correction are crucial in assessing its downstream effects on altcoin performance.
From a philosophical lens, gold's cyclical ascent and retreat mirrors the rhythm of nature and human experience—expansion, contraction, and renewal. Just as rivers carve valleys before surging toward the ocean, the market too must surrender gains to gather force. A correction in gold is not merely a financial event, but a moment of recalibration—an inhale before the next exhale of momentum. It invites reflection: whether wealth seeks refuge or ventures into risk, whether fear contracts or ambition expands. In this interplay, altcoins may inherit the restless spirit of capital in search of yield, as gold, the ancient anchor of value, briefly pauses in its timeless journey.
Conclusion
We present a multi-phased path for gold where:
An initial bullish breakout toward $3,435–$3,500 forms a short- to mid-term peak
A subsequent correction brings gold to either $2,950 or $2,650, depending on macro triggers
A renewed bull rally drives gold toward $4,050 and potentially $4,319 and beyond
This scenario reflects both the cyclical nature of market structure and the macro-fundamental backing that continues to support long-term gold strength.

XAUUSD Video Analysis Brief – Weekly Forecast Summary (2025)This video summarizes the key scenarios and technical outlook for Gold (XAUUSD) on the weekly timeframe, integrating both Fibonacci-based projections and macro fundamentals.
Core Setup
Gold is currently positioned near the 161.8% Fibonacci extension (~$3,276).
A breakout toward $3,500 is possible before a potential corrective move.
Scenario 1: Bullish Continuation
Gold breaks above $3,435 → rallies to $4300 → continues toward major Fibonacci targets:
TP: $4,320, which is the Fibonacci level 261.8%
Scenario 2: Correction First
Gold fails to hold above $3,435 → triggers a healthy correction to:
TP1: $2,920
TP2: $2,650
If support 161.8% level holds in the correction zone, a renewed bullish phase is expected.
Macro Alignment
Central bank gold buying (notably BRICS) supports the long-term bid.
Fed policy leaning dovish → tailwinds for gold.
Inverse correlation with DXY:
DXY below 98.95 → bullish for gold
DXY above 100 → signals correction
Effect on Altcoins
If correction is risk-on driven, capital may rotate into altcoins.
If triggered by macro stress or USD strength, alts may fall alongside gold.
This analysis offers a multi-scenario framework to navigate the next major moves in gold, with key levels to watch for traders, investors, and macro analysts alike.

GOLD WEEKPLAN: UP FIRST DOWN AFTEROANDA:XAUUSD Footprint Analysis
The Footprint chart provides a more detailed view of the order flow. Here are some key points:
Price Pullback: The recent candles show a decrease in buying pressure (green) and an increase in selling pressure (red).
Volume Footprint: The trading volume (Total) and Delta (the difference between buying and selling pressure) on each candle show the order distribution.
The candle on the 19th has a negative Delta (~ -5.96 K), indicating that selling pressure is dominant, which aligns with the corrective pullback.
However, there's no major volume divergence, suggesting that this may only be a typical correction.
Detailed Footprint Analysis: The numbers within each candle show the number of buy orders (on the left) and sell orders (on the right) at each price level. When the price pulls back to the Imbalance or Strong OB zone, it's crucial to monitor the Footprint for signs of buying pressure returning (Delta turning positive or significant buying volume at key price levels), which would serve as a confirmation signal for a long entry.
OANDA:XAUUSD General Analysis
The XAUUSD market is in a strong uptrend, confirmed by the market structure:
Higher Highs (HH): Each new peak is higher than the previous one.
Higher Lows (HL): Each new trough is higher than the previous one.
Recently, the price created a Break of Structure (BOS), breaking the previous high, which indicates a continuation of the uptrend. After the BOS, the price established a new high (HH) and is now making a corrective pullback to find a strong support zone before continuing its upward momentum.
Imbalance (Fair Value Gap - FVG): This is a liquidity void created when the price moves too quickly. According to SMC theory, the market tends to return to fill this gap.
Location: The price range is from ~$3660 to ~$3670 USD.
Significance: This zone could act as a temporary support level. If the price returns to this area, it might fill the Imbalance and then continue to rise.
Strong OB (Order Block): This is a large block of orders left behind by "Smart Money" and often serves as a strong support or resistance zone.
Location: The price range is from ~$3645 to ~$3655 USD.
Significance: This is the strongest support zone to consider for a long entry. The price is likely to pull back to this area, tap into the order block, and then bounce back up to continue the trend.
Additionally, there are two important liquidity zones to note:
Buy Side Liquidity ($$$): Located above the most recent high (~$3700 USD). The price has the potential to move up to sweep this liquidity.
Sell Side Liquidity ($$$): Located below the most recent low (~$3620 USD). This zone could be swept if there is a sharp market drop, but it's highly likely that the price will respect the bullish structure and not break this low.

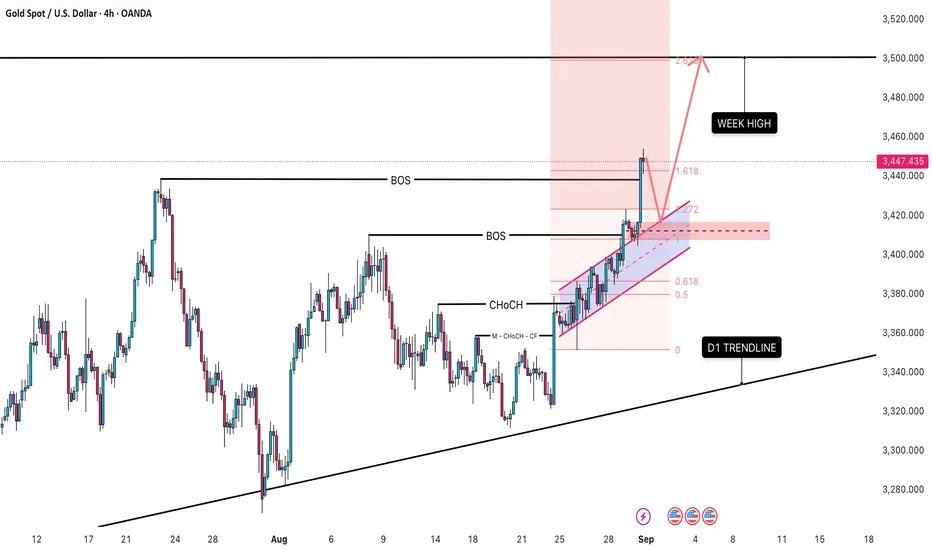
OPEN WEEK WILL DUMP TO 3410 OR PUMP TO 3500 ?The chart shows that gold is currently in a strong bullish trend. Price has broken above a significant supply zone, which now acts as a demand zone. The recent "BOS" (Break of Structure) confirms this bullish momentum.
Trading Strategy
1. Bullish Scenario (Primary):
Entry: Look for a pullback to the key demand zone around the 3,410–3,425 level. This is a high-probability area for a bounce.
Target: The main target for this bullish move is the new week high at 3,500 and potentially extending to 3,520.
Stop Loss: Place your stop loss below the low of the demand zone to protect your capital.
2. Bearish Scenario (Secondary):
Confirmation: A break below the demand zone at 3,410 would invalidate the primary bullish plan.
Target: If this happens, price could retrace back to the D1 Trendline around the 3,350 level.
3. Key Levels to Watch:
Support:
3,410 - 3,425: Major demand zone.
3,380: A minor support level.
3,350: The D1 Trendline.
Resistance:
3,447: Current high.
3,500: Key psychological and structural resistance level.
3,520: Final target.
Important Notes
Risk Management: Always use a proper stop loss and never risk more than 1-2% of your capital on a single trade.
Confirmation: Wait for bullish price action signals like an engulfing candle, pin bar, or double bottom on a lower timeframe before entering a long position.
Market News: Be aware of any high-impact news events that could affect the price of gold.
XAU/USD 16-20 June 2025 Weekly AnalysisWeekly Analysis:
Swing Structure -> Bullish.
Internal Structure -> Bullish.
Analysis and bias remains the same as analysis dated 16 March 2025.
In my analysis dated 27 October 2024 I mentioned (below) that price could potentially print higher-highs in order to reposition CHoCH. This is exactly how price printed. CHoCH positioning has been brought significantly closer to current price action. CHoCH positioning is denoted with a shortened blue dotted horizontal line.
The remainder of my analysis and bias remains the same as analysis dated 09 February 2025.
Price has printed a further bullish iBOS.
Price is currently trading within an internal low and fractal high. CHoCH positioning is denoted with a blue dashed line.
Price Action Analysis:
In my analysis dated 27 October 2024, it was noted that the first sign of a pullback would be a bearish Change of Character (CHoCH), indicated by a blue dotted line. Price's consistent upward momentum had repositioned previous CHoCH much closer to recent price levels as expected for weeks. Current CHoCH positioning is quite a distance away from price, therefore, it would be viable if price continued bullish to reposition ChOCH.
Note:
It is highly unlikely price will "crash" as many analysts are predicting. My view is this is merely a corrective wave of the primary trend.
Given the Federal Reserve's dovish policy stance alongside heightened geopolitical risks, market volatility is likely to remain elevated, influencing intraday price swings.
Price could also be driven by President Trump's policies, geopolitical moves and economic decisions which are sparking uncertainty and potential repricing of Gold.
Weekly Chart:
Daily Analysis:
Swing -> Bullish.
Internal -> Bullish.
Analysis and Bias remains the same as Analysis dated 11 May 2025.
Since my last weekly analysis price has finally printed a bearish CHoCH.
This is the first indication, but not confirmation of bearish pullback phase initiation.
Price is now trading within an established internal range.
Price should now technically trade down to either discount of 50% internal EQ, or Daily demand zone before targeting weak internal high, priced at 3,500.200.
Note:
The Federal Reserve’s continued dovish stance, coupled with escalating geopolitical uncertainties, is expected to sustain elevated market volatility, influencing both intraday and broader trend developments.
Additionally, price action may be further shaped by U.S. policy decisions, including measures enacted under President Trump. Shifts in geopolitical strategy and economic policymaking could introduce further uncertainty, contributing to the ongoing repricing dynamics within the gold market.
Daily Chart:
H4 Analysis:
-> Swing: Bullish.
-> Internal: Bullish.
Analysis and bias remains the same as analysis dated 23 April 2025
Price has now printed a bearish CHoCH according to my analysis yesterday.
Price is now trading within an established internal range.
Intraday Expectation:
Price to trade down to either discount of internal 50% EQ, or H4 demand zone before targeting weak internal high priced at 3,500.200.
Note:
The Federal Reserve’s sustained dovish stance, coupled with ongoing geopolitical uncertainties, is likely to prolong heightened volatility in the gold market. Given this elevated risk environment, traders should exercise caution and recalibrate risk management strategies to navigate potential price fluctuations effectively.
Additionally, gold pricing remains sensitive to broader macroeconomic developments, including policy decisions under President Trump. Shifts in geopolitical strategy and economic directives could further amplify uncertainty, contributing to market repricing dynamics.
H4 Chart:

XAU/USD 09-13 June 2025 Weekly AnalysisWeekly Analysis:
Swing Structure -> Bullish.
Internal Structure -> Bullish.
Analysis and bias remains the same as analysis dated 16 March 2025.
In my analysis dated 27 October 2024 I mentioned (below) that price could potentially print higher-highs in order to reposition CHoCH. This is exactly how price printed. CHoCH positioning has been brought significantly closer to current price action. CHoCH positioning is denoted with a shortened blue dotted horizontal line.
The remainder of my analysis and bias remains the same as analysis dated 09 February 2025.
Price has printed a further bullish iBOS.
Price is currently trading within an internal low and fractal high. CHoCH positioning is denoted with a blue dashed line.
Price Action Analysis:
In my analysis dated 27 October 2024, it was noted that the first sign of a pullback would be a bearish Change of Character (CHoCH), indicated by a blue dotted line. Price's consistent upward momentum had repositioned previous CHoCH much closer to recent price levels as expected for weeks. Current CHoCH positioning is quite a distance away from price, therefore, it would be viable if price continued bullish to reposition ChOCH.
Note:
It is highly unlikely price will "crash" as many analysts are predicting. My view is this is merely a corrective wave of the primary trend.
Given the Federal Reserve's dovish policy stance alongside heightened geopolitical risks, market volatility is likely to remain elevated, influencing intraday price swings.
Price could also be driven by President Trump's policies, geopolitical moves and economic decisions which are sparking uncertainty and potential repricing of Gold.
Weekly Chart:
Daily Analysis:
Swing -> Bullish.
Internal -> Bullish.
Analysis and Bias remains the same as Analysis dated 11 May 2025.
Since my last weekly analysis price has finally printed a bearish CHoCH.
This is the first indication, but not confirmation of bearish pullback phase initiation.
Price is now trading within an established internal range.
Price should now technically trade down to either discount of 50% internal EQ, or Daily demand zone before targeting weak internal high, priced at 3,500.200.
Note:
The Federal Reserve’s continued dovish stance, coupled with escalating geopolitical uncertainties, is expected to sustain elevated market volatility, influencing both intraday and broader trend developments.
Additionally, price action may be further shaped by U.S. policy decisions, including measures enacted under President Trump. Shifts in geopolitical strategy and economic policymaking could introduce further uncertainty, contributing to the ongoing repricing dynamics within the gold market.
Daily Chart:
H4 Analysis:
-> Swing: Bullish.
-> Internal: Bullish.
Analysis and bias remains the same as analysis dated 23 April 2025
Price has now printed a bearish CHoCH according to my analysis yesterday.
Price is now trading within an established internal range.
Intraday Expectation:
Price to trade down to either discount of internal 50% EQ, or H4 demand zone before targeting weak internal high priced at 3,500.200.
Note:
The Federal Reserve’s sustained dovish stance, coupled with ongoing geopolitical uncertainties, is likely to prolong heightened volatility in the gold market. Given this elevated risk environment, traders should exercise caution and recalibrate risk management strategies to navigate potential price fluctuations effectively.
Additionally, gold pricing remains sensitive to broader macroeconomic developments, including policy decisions under President Trump. Shifts in geopolitical strategy and economic directives could further amplify uncertainty, contributing to market repricing dynamics.
H4 Chart:

XAU/USD 26-30 May 2025 Weekly AnalysisWeekly Analysis:
Swing Structure -> Bullish.
Internal Structure -> Bullish.
Analysis and bias remains the same as analysis dated 16 March 2025.
In my analysis dated 27 October 2024 I mentioned (below) that price could potentially print higher-highs in order to reposition CHoCH. This is exactly how price printed. CHoCH positioning has been brought significantly closer to current price action. CHoCH positioning is denoted with a shortened blue dotted horizontal line.
The remainder of my analysis and bias remains the same as analysis dated 09 February 2025.
Price has printed a further bullish iBOS.
Price is currently trading within an internal low and fractal high. CHoCH positioning is denoted with a blue dashed line.
Price Action Analysis:
In my analysis dated 27 October 2024, it was noted that the first sign of a pullback would be a bearish Change of Character (CHoCH), indicated by a blue dotted line. Price's consistent upward momentum had repositioned previous CHoCH much closer to recent price levels as expected for weeks. Current CHoCH positioning is quite a distance away from price, therefore, it would be viable if price continued bullish to reposition ChOCH.
Note:
It is highly unlikely price will "crash" as many analysts are predicting. My view is this is merely a corrective wave of the primary trend.
Given the Federal Reserve's dovish policy stance alongside heightened geopolitical risks, market volatility is likely to remain elevated, influencing intraday price swings.
Price could also be driven by President Trump's policies, geopolitical moves and economic decisions which are sparking uncertainty and potential repricing of Gold.
Weekly Chart:
Daily Analysis:
Swing -> Bullish.
Internal -> Bullish.
Analysis and Bias remains the same as Analysis dated 11 May 2025.
Since my last weekly analysis price has finally printed a bearish CHoCH.
This is the first indication, but not confirmation of bearish pullback phase initiation.
Price is now trading within an established internal range.
Price should now technically trade down to either discount of 50% internal EQ, or Daily demand zone before targeting weak internal high, priced at 3,500.200.
Note:
The Federal Reserve’s continued dovish stance, coupled with escalating geopolitical uncertainties, is expected to sustain elevated market volatility, influencing both intraday and broader trend developments.
Additionally, price action may be further shaped by U.S. policy decisions, including measures enacted under President Trump. Shifts in geopolitical strategy and economic policymaking could introduce further uncertainty, contributing to the ongoing repricing dynamics within the gold market.
Daily Chart:
H4 Analysis:
-> Swing: Bullish.
-> Internal: Bullish.
Analysis and bias remains the same as analysis dated 23 April 2025
Price has now printed a bearish CHoCH according to my analysis yesterday.
Price is now trading within an established internal range.
Intraday Expectation:
Price to trade down to either discount of internal 50% EQ, or H4 demand zone before targeting weak internal high priced at 3,500.200.
Note:
The Federal Reserve’s sustained dovish stance, coupled with ongoing geopolitical uncertainties, is likely to prolong heightened volatility in the gold market. Given this elevated risk environment, traders should exercise caution and recalibrate risk management strategies to navigate potential price fluctuations effectively.
Additionally, gold pricing remains sensitive to broader macroeconomic developments, including policy decisions under President Trump. Shifts in geopolitical strategy and economic directives could further amplify uncertainty, contributing to market repricing dynamics.
H4 Chart:

XAU/USD 12-16 May 2025 Weekly AnalysisWeekly Analysis:
Swing Structure -> Bullish.
Internal Structure -> Bullish.
Analysis and bias remains the same as analysis dated 16 March 2025.
In my analysis dated 27 October 2024 I mentioned (below) that price could potentially print higher-highs in order to reposition CHoCH. This is exactly how price printed. CHoCH positioning has been brought significantly closer to current price action. CHoCH positioning is denoted with a shortened blue dotted horizontal line.
The remainder of my analysis and bias remains the same as analysis dated 09 February 2025.
Price has printed a further bullish iBOS.
Price is currently trading within an internal low and fractal high. CHoCH positioning is denoted with a blue dashed line.
Price Action Analysis:
In my analysis dated 27 October 2024, it was noted that the first sign of a pullback would be a bearish Change of Character (CHoCH), indicated by a blue dotted line. Price's consistent upward momentum had repositioned previous CHoCH much closer to recent price levels as expected for weeks. Current CHoCH positioning is quite a distance away from price, therefore, it would be viable if price continued bullish to reposition ChOCH.
Note:
It is highly unlikely price will "crash" as many analysts are predicting. My view is this is merely a corrective wave of the primary trend.
Given the Federal Reserve's dovish policy stance alongside heightened geopolitical risks, market volatility is likely to remain elevated, influencing intraday price swings.
Price could also be driven by President Trump's policies, geopolitical moves and economic decisions which are sparking uncertainty and potential repricing of Gold.
Weekly Chart:
Daily Analysis:
Swing -> Bullish.
Internal -> Bullish.
Since my last weekly analysis price has finally printed a bearish CHoCH.
This is the first indication, but not confirmation of bearish pullback phase initiation.
Price is now trading within an established internal range.
Price should now technically trade down to either discount of 50% internal EQ, or Daily demand zone before targeting weak internal high, priced at 3,500.200.
Note:
The Federal Reserve’s continued dovish stance, coupled with escalating geopolitical uncertainties, is expected to sustain elevated market volatility, influencing both intraday and broader trend developments.
Additionally, price action may be further shaped by U.S. policy decisions, including measures enacted under President Trump. Shifts in geopolitical strategy and economic policymaking could introduce further uncertainty, contributing to the ongoing repricing dynamics within the gold market.
Daily Chart:
H4 Analysis:
-> Swing: Bullish.
-> Internal: Bullish.
Analysis and bias remains the same as analysis dated 23 April 2025
Price has now printed a bearish CHoCH according to my analysis yesterday.
Price is now trading within an established internal range.
Intraday Expectation:
Price to trade down to either discount of internal 50% EQ, or H4 demand zone before targeting weak internal high priced at 3,500.200.
Note:
The Federal Reserve’s sustained dovish stance, coupled with ongoing geopolitical uncertainties, is likely to prolong heightened volatility in the gold market. Given this elevated risk environment, traders should exercise caution and recalibrate risk management strategies to navigate potential price fluctuations effectively.
Additionally, gold pricing remains sensitive to broader macroeconomic developments, including policy decisions under President Trump. Shifts in geopolitical strategy and economic directives could further amplify uncertainty, contributing to market repricing dynamics.
H4 Chart:

GOLD H4 Chart Update For 7 - 11 April 2025As you can see GOLD H4 Chart Published, this chart contains some crucial levels for the upcoming week
Weekly Strong Support Zone is 2930-50
Weekly Strong Resistance zone @ 3130-3145
Further all levels are mentioned, watch carefully

XAU-USD 07-11 April 2025 Weekly AnalysisWeekly Analysis:
Swing Structure -> Bullish.
Internal Structure -> Bullish.
Analysis and bias remains the same as analysis dated 16 March 2025.
In my analysis dated 27 October 2024 I mentioned (below) that price could potentially print higher in order to reposition CHoCH. This is exactly how price printed. CHoCH positioning has been brought significantly closer to current price action.
The remainder of my analysis and bias remains the same as analysis dated 09 February 2025.
Price has printed a further bullish iBOS.
Price is currently trading within an internal low and fractal high. CHoCH positioning is denoted with a blue dashed line.
Price Action Analysis:
In my analysis dated 27 October 2024, it was noted that the first sign of a pullback would be a bearish Change of Character (CHoCH), indicated by a blue dotted line. Price's consistent upward momentum had repositioned previous CHoCH much closer to recent price levels as expected for weeks. Current CHoCH positioning is quite a distance away from price, therefore, it would be viable if price continued bullish to reposition ChOCH.
Note:
It is highly unlikely price will "crash" as many analysts are predicting. My view is this is merely a corrective wave of the primary trend.
Given the Federal Reserve's dovish policy stance alongside heightened geopolitical risks, market volatility is likely to remain elevated, influencing intraday price swings.
Price could also be driven by President Trump's policies, geopolitical moves and economic decisions which are sparking uncertainty.
Weekly Chart:
Daily Analysis:
Swing -> Bullish.
Internal -> Bullish.
Price continued bullish repositioning bearish CHoCH positioning closer to current price action.
Price is now trading within an internal low and fractal high.
Price has very nearly printed a bearish which is the first indication, but not confirmation, of bearish pullback phase initiation.
Expectation is for price to print bearish CHoCH to indicate, bearish pullback phase initiation. CHoCH positioning is denoted with a blue dotted line.
Note:
With the Fed maintaining a dovish policy stance and the continued rise in geopolitical tensions, we should anticipate elevated market volatility, which may impact both intraday and longer-term price action.
Price could also be driven by President Trump's policies, geopolitical moves and economic decisions which are sparking uncertainty and the repricing of Gold.
Daily Chart:
H4 Analysis:
-> Swing: Bullish.
-> Internal: Bullish.
Analysis and bias remains the same as analysis dated 04 April 2025.
Since last analysis price has printed a bearish CHoCH which is the first indication, but not confirmation of bearish pullback phase initiation.
Price is now trading within an established internal range.
Intraday Expectation:
Price to trade down to either discount of internal 50% EQ, or H4 demand zone before targeting weak internal high priced at 3,187,835
Note:
With the Federal Reserve's dovish stance and persisting geopolitical uncertainties, heightened volatility in Gold is expected to continue. Traders should proceed with caution and adjust risk management strategies in this high-volatility environment.
Price could also be driven by President Trump's policies, geopolitical moves and economic decisions which are sparking uncertainty.
H4 Chart:

Gold weekly chart with both buy and sell levels See latest update on Gold for the coming week.
For a buy am looking at entering at 2914 expecting 2920 as first resistance.
For a sell ill look at entering at 2904 and expecting a move to 2889 as firat resistance.
Short idea this week as have other commitments but ill update when i get a chance in the coming week.

XAU/USD 20-24 January 2025 Weekly AnalysisWeekly Analysis:
Swing Structure -> Bullish.
Internal Structure -> Bullish.
Analysis/Bias remains the same as analysis dated 01 December 2024.
Price Action Analysis:
In my analysis dated 27 October 2024, it was noted that the first sign of a pullback would be a bearish Change of Character (CHoCH), indicated by a blue dotted line. Price's consistent upward momentum had positioned this CHoCH much closer to recent price levels as expected for weeks.
Now, for the first time since 23 November 2020, price has printed a bearish CHoCH. We are currently trading within a defined internal range.
Price is anticipated to trade down towards either the discount of the internal 50% Equilibrium (EQ), highlighted in blue, or the Weekly demand zone before targeting the weak internal high.
Note:
It is highly unlikely price will "crash" as many analysts are predicting. My view is this is merely a corrective wave of the primary trend.
Given the Federal Reserve's dovish policy stance alongside heightened geopolitical risks, market volatility is likely to remain elevated, influencing intraday price swings.
Weekly Chart:
Daily Analysis:
-> Swing -> Bullish.
-> Internal -> Bullish.
Analysis/Bias remains the same as analysis dated 01 December 2024
Price Action Analysis:
Price has shown a reaction from discount of internal 50% EQ. Currently price has been unable to target the weak internal high
Given the current internal range dynamics, price is expected to target weak internal high, priced at 2,790.170 However, considering the signs of a pullback phase on the Weekly timeframe, there remains a possibility of price printing a bearish Internal Break of Structure (iBOS). Price has yet to tap into Daily demand.
Note:
With the Fed maintaining a dovish policy stance and the continued rise in geopolitical tensions, we should anticipate elevated market volatility, which may impact both intraday and longer-term price action.
Daily Chart:
H4 Analysis:
-> Swing: Bearish.
-> Internal: Bullish.
Bias and analysis remains the same as analysis of 17 January 2025.
Price has finally printed a bullish iBOS in accordance with scenario one of my analysis dated 16 December 2024.
Price Action Analysis:
After bullish iBOS, we expect bearish pullback. First indication, but not confirmation of bearish pullback phase initiation is for price to print a bearish CHoCH. Current CHoCH positioning is denoted with a blue dotted line.
Price is now trading within an internal low and fractal high.
Intraday Expectation:
Price to indicate bearish pullback phase initiation by printing bearish CHoCH. This would also establish internal structure.
Note:
With the Federal Reserve's dovish stance and persisting geopolitical uncertainties, heightened volatility in Gold is expected to continue. Traders should proceed with caution and adjust risk management strategies in this high-volatility environment.
H4 Chart:

XAU/USD 16-20 December 2024 Weekly AnalysisWeekly Analysis:
Swing Structure -> Bullish.
Internal Structure -> Bullish.
Analysis/Bias remains the same as analysis dated 01 December 2024.
Price Action Analysis:
In my analysis dated 27 October 2024, it was noted that the first sign of a pullback would be a bearish Change of Character (CHoCH), indicated by a blue dotted line. Price's consistent upward momentum had positioned this CHoCH much closer to recent price levels as expected for weeks.
Now, for the first time since 23 November 2020, price has printed a bearish CHoCH. We are currently trading within a defined internal range.
Price is anticipated to trade down towards either the discount of the internal 50% Equilibrium (EQ), highlighted in blue, or the Weekly demand zone before targeting the weak internal high.
Note:
It is highly unlikely price will "crash" as many analysts are predicting. My view is this is merely a corrective wave of the primary trend.
Given the Federal Reserve's dovish policy stance alongside heightened geopolitical risks, market volatility is likely to remain elevated, influencing intraday price swings.
Weekly Chart:
Daily Analysis:
-> Swing -> Bullish.
-> Internal -> Bullish.
Analysis/Bias remains the same as analysis dated 01 December 2024
Price Action Analysis:
Price has shown a reaction from discount of internal 50% EQ. Currently price has been unable to target the weak internal high
Given the current internal range dynamics, price is expected to target weak internal high, priced at 2,790.170 However, considering the signs of a pullback phase on the Weekly timeframe, there remains a possibility of price printing a bearish Internal Break of Structure (iBOS). Price has yet to tap into Daily demand.
Note:
With the Fed maintaining a dovish policy stance and the continued rise in geopolitical tensions, we should anticipate elevated market volatility, which may impact both intraday and longer-term price action.
Daily Chart:
H4 Analysis:
-> Swing: Bearish.
-> Internal: Bullish.
Price is clearly unable to target weak internal. This is due to the fact that Daily and Weekly Timeframe remain in bearish pullback phase.
Price Action Analysis:
Technically price is to target weak internal priced at 2,721.420. Price has sweeped liquidity,
for two possible reasons.
1. To assist price to complete bearish pullback phase, react at either discount of internal 50% or H4 demand zone before targeting weak internal high.
2. To assist Daily and H4 TF's to complete bearish pullback phase with price to print a bearish iBOS and target strong internal low priced at 2,536.855.
Intraday Expectation:
Intraday expectation and alternative scenario as per points 1 and 2.
Note:
With the Federal Reserve's dovish stance and persisting geopolitical uncertainties, heightened volatility in Gold is expected to continue. Traders should proceed with caution and adjust risk management strategies in this high-volatility environment.
H4 Chart:

XAU/USD 09-13 December 2024 Weekly AnalysisWeekly Analysis:
Swing Structure -> Bullish.
Internal Structure -> Bullish.
Analysis/Bias remains the same as analysis dated 01 December 2024.
Price Action Analysis:
In my analysis dated 27 October 2024, it was noted that the first sign of a pullback would be a bearish Change of Character (CHoCH), indicated by a blue dotted line. Price's consistent upward momentum had positioned this CHoCH much closer to recent price levels as expected for weeks.
Now, for the first time since 23 November 2020, price has printed a bearish CHoCH. We are currently trading within a defined internal range.
Price is anticipated to trade down towards either the discount of the internal 50% Equilibrium (EQ), highlighted in blue, or the Weekly demand zone before targeting the weak internal high.
Note:
It is highly unlikely price will "crash" as many analysts are predicting. My view is this is merely a corrective wave of the primary trend.
Given the Federal Reserve's dovish policy stance alongside heightened geopolitical risks, market volatility is likely to remain elevated, influencing intraday price swings.
Weekly Chart:
Daily Analysis:
-> Swing -> Bullish.
-> Internal -> Bullish.
Analysis/Bias remains the same as analysis dated 01 December 2024
Price Action Analysis:
Price has shown a reaction from discount of internal 50% EQ. Currently price has been unable to target the weak internal high
Given the current internal range dynamics, price is expected to target weak internal high, priced at 2,790.170 However, considering the signs of a pullback phase on the Weekly timeframe, there remains a possibility of price printing a bearish Internal Break of Structure (iBOS). Price has yet to tap into Daily demand.
Note:
With the Fed maintaining a dovish policy stance and the continued rise in geopolitical tensions, we should anticipate elevated market volatility, which may impact both intraday and longer-term price action.
Daily Chart:
H4 Analysis:
-> Swing: Bearish.
-> Internal: Bullish.
Bias/analysis remains the same as analysis dated 25 November 2024.
Price Action Analysis:
As mentioned in yesterday's analysis dated 24 November 2024, whereby price was expected to print a bearish CHoCH. This is how price printed.
Currently, price is trading within an established internal range.
Intraday Expectation:
Price is anticipated to trade down to either discount of internal 50% EQ, which is marked in blue, or H4 demand zone before targeting weak internal high priced at 2,721.420.
Note:
With the Federal Reserve's dovish stance and persisting geopolitical uncertainties, heightened volatility in Gold is expected to continue. Traders should proceed with caution and adjust risk management strategies in this high-volatility environment.
H4 Chart:

XAU/USD 28 October - 01 November 2024 Weekly AnalysisWeekly Analysis:
Swing Structure: Bullish.
Internal Structure: Bullish.
Price has continued its surge, reaching new all-time highs with no signs yet of bearish pullback phase initiation.
The initial indication of a pullback would be a bearish Change of Character (CHoCH), marked by a blue dotted line. Price's ongoing ascent has now positioned CHoCH significantly closer to most recent price action.
Weekly Chart:
Daily Analysis:
-> Swing: Bullish.
-> Internal: Bullish.
Price has sustained its upward surge since printing a bullish Internal Break of Structure (iBOS), driven by softer U.S. macroeconomic data and heightened geopolitical tensions.
Following bullish iBOS, a bearish pullback is anticipated, though there are currently no signs of it materialising. The first indication, though not a confirmation, of a potential pullback would be price printing a bearish Change of Character (CHoCH), which is marked by a blue dotted line.
Price could potentially achieve new highs, bringing the bearish CHoCH positioning significantly closer to current price action. This proximity would provide a realistic opportunity for price to signal the initiation of a bearish pullback phase.
Daily Chart:
H4 Analysis:
-> Swing: Bullish.
-> Internal: Bullish.
Gold’s rally persists amid the Fed’s dovish tone and heightened geopolitical tensions, solidifying its safe-haven appeal.
Price has printed a bearish Change of Character (CHoCH), signaling—but not yet confirming—the start of a bearish pullback phase.
Intraday Expectation: Despite the bearish CHoCH, price has yet to pull back into the internal 50% EQ discount. We could see a reaction at the H4 supply level before any confirmation of bearish pullback initiation.
Technical Note: The strong high at 2,758.525 is anticipated to remain protected. However, with CHoCH positioning on the daily timeframe somewhat distant, price may print a bullish iBOS in the near term to align with the daily timeframe’s movement.
H4 Chart:

XAU/USD 07-11 October 2024 Weekly AnalysisWeekly Analysis:
Swing Structure: Bullish.
Internal Structure: Bullish.
Price has continued to print all-time highs and surge, with no indication of bearish pullback phase initiation.
The first sign of a pullback would be price printing a bearish Change of Character (CHoCH), which is marked with a blue dotted line.
Price has continued higher, and CHoCH positioning remains unchanged from the analysis dated 22 September 2024.
Weekly Chart:
Daily Analysis:
-> Swing: Bullish.
-> Internal: Bullish.
Price has printed a bullish Internal Break of Structure (iBOS) and continued its upward surge, driven by soft U.S. macroeconomic data and increasing geopolitical tensions.
Following bullish iBOS, a bearish pullback is anticipated, though there are currently no signs of it materialising.
The first indication, though not a confirmation of a pullback would be price printing a bearish Change of Character (CHoCH). Since last week's analysis, CHoCH positioning has remained unchanged.
The bearish CHoCH level is marked with a blue dotted line.
Daily Chart:
H4 Analysis:
-> Swing: Bullish.
-> Internal: Bearish.
Bearish swing pullback phase has been confirmed by the first bearish Internal Break of Structure (iBOS), which has established the current swing range. Currently, price is trading between the swing high and internal low.
Following second bearish iBOS price printed a bullish Change of Character (CHoCH), suggesting but not confirming the initiation of a bullish pullback phase.
Price reacted from the premium zone above the 50% internal equilibrium (EQ). Although the weak internal low was targeted, price was unable to close below it after reacting from an H4 demand zone.
Intraday Expectation: Price is expected to target weak internal low.
H4 Chart:

XAU/USD 30 September - 04 October 2024Weekly Analysis:
Swing Structure: Bullish.
Internal Structure: Bullish.
Price has continued to print all time highs and surge with no indication of bearish pullback phase initiation.
The first indication of pullback will be for price to print a bearish CHoCH which is denoted with a blue dotted line.
Price has continued higher with CHoCH positioning remaining the same as last week's analysis dated 22 September 2024.
Weekly Chart:
Daily Analysis:
-> Swing: Bullish.
-> Internal: Bullish.
Price has printed a bullish iBOS and continued it's surge in price lead by soft US macroeconomics and increasing geopolitical tensions.
After bullish iBOS we expect bearish pullback, which, at the moment, is not showing any signs of printing.
First indication, but not confirmation of pullback is for price to print a bearish CHoCH. Since last week's analysis, CHoCH positioning has remained unchanged.
Bearish CHoCH positioning is denoted with a blue doted line.
Daily Chart:
H4 Analysis:
-> Swing: Bullish.
-> Internal: Bullish.
Price has continued to surge in price printing all time highs with price pulling back very minimally.
Price has printed a further bullish iBOS. Bearish CHoCH has been printed indicating bearish pullback phase initiation. We also have established an internal range.
You will note the internal range has extensively narrowed, allowing price to confirm swing pullback phase by printing bearish iBOS. However, we remain bullish.
Although price has tapped in to strong internal low, price has been unable to close below
Intraday expectation: Price to target weak internal high, however, due to the narrowing of the internal range and all HTF's requiring pullback, it would not be unrealistic if price prints a bearish iBOS.
H4 Chart:

GOLD WEEKLYGold gathered bullish momentum in the second half of the day on Friday and reached its highest level since early January above $2,070. The benchmark 10-year US Treasury bond yield is down 1% at 4.2%, fueling XAU/USD's rally ahead of the weekend.

GOLD WEEKLY POSSIBLE MOVESAfter rising above $2,040, Gold reversed its direction and turned negative on the day near $2,030. Hawkish comments from NY Fed President Williams triggered a rebound in the US Treasury bond yields and made it difficult for XAU/USD to preserve its bullish momentum.

GOLD WEEKLY CONFIRM PREDICTION Gold prices benefitted early in the week as US CPI came in much better than expected which saw market expectations for rate cuts in 2024 improve. Markets are now pricing in a rate cut for May 2024 at 47.9% up from 29.6% a week ago. The selloff in US Yields also helped while the ongoing uncertainty form the Middle East continues. This saw Gold breach the $1950 handle and print a daily high of $1970.91. This was followed by uncertainty on Wednesday before another miss by US data on Thursday gave Gold a further push toward the $2000/oz mark.

XAUUSD\GOLD - AnalysisXAUUSD\GOLD
W1 - is in the phase of a flat / sideways direction in the price section 2037 - 1678, as it is clear that the price twice after the implementation of two waves approached the price of 1814, and then after the correction - movement to the price of 1678
What can be expected now?
Presumably, the correction after the 3rd wave begins to end, which may lead to the implementation of the 5th wave and the price drop to 1814 and below.
Short
Long term - goals 1814–1678
Medium term - goals 1918-1899-1871

Gold in H4 timeframeGold is Ranging in this month
major Support is 1925-1933
Major Resistence 1980-1985
according to price action if price break the support level in H4 which is 1925-1933 then market will go 1910 which is Tp1 and 1985 which is Tp2
on other hand if market break the major Resistence level which is 1980-1985 in H4
then next target will be 2000-2003
in recent scenario ther is no trade for swing trader be paitence and wait for market to break any of these level
