GNT $0.13 looming once again.GNT holding a strong trend line towards $0.19 but buying power has weakened and is looking towards $0.13 once again and even lower.
Golem

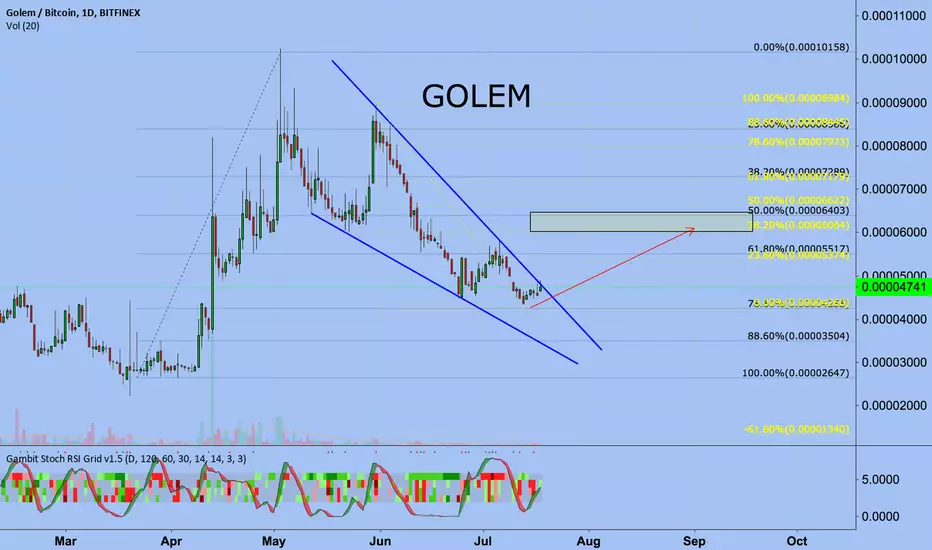
GOLEM gains BTCGNTBTC pattern with the falling wedges, after brokethought same re-testing the ex-resistances, then flat and to the moon.

My $1k to $100k Challenge: Day 44 - Trade #47 GNTHello all and thanks for stopping by and following my personal challenge. I am attempting to turn $1000 into $100,000 by day trading altcoins.
I started my challenge on July 14th with a bankroll of 0.16 Bitcoin that was valued at $1000 at the time. You can follow and see all my trades in my profile.
After 44 days and 44 completed trades:
Wins: 20
Loss: 25
Balance: 0.1541 B
USD: $ 1034
*Some trades may be pending and not yet included in my stats
There are too many trades to list. All my trades and stats for this challenge can be found in the link on my profile if you want to follow.
CAUTION: This challenge represents a small portion of my overall portfolio. To maximize the potential of reaching my 100k challenge goal quickly with just 1k, I am using most of my challenge bankroll per trade trying to build up my bankroll for the challenge.
If you are following me, I do not recommend this strategy, but instead you should limit your trades to max 3-5% of your portfolio per trade. Please trade smart.
Alright, here we go with Day 44 trade #46
I invested 0.072 B into GNT. I bought 3171 @ 2270 satoshi
My Sell targets are:
T1: 2384 5%
T2: 2498 10%
T3: 2611 15%
I will sell 33% at each target. After a target is hit, that will become my new SL.
SL: 2100
In case you are wondering why my buy price sometimes doesn't match the current price on the chart when I make a new post, this is because I post my coin selection to my Discord group first and then make a new trade idea here which takes about 30 minutes to complete this all.
I am 100% transparent. I show screenshots of my buy price and amount on my Discord group. This has been a fun experiment and I enjoy sharing my journey.
Your comments, agrees and disagrees are always welcome and appreciated.
Thanks for stopping by and have a great day!


GNTBTCFalling wedge reversal pattern of technical analysis, which manifests itself in a descending wave-like motion, the amplitude of which decreases.
A falling wedge is formed at the points of tangency to two straight lines that form an angle looking right downwards. The imaginary angle is the descending wedge. It is important to answer that to each straight the price should touch at least twice.
Exit from the falling wedge will help to test the resistance level on fibbonachi 78.6
All moving averages for long periods on sale
MACD ready to start rising


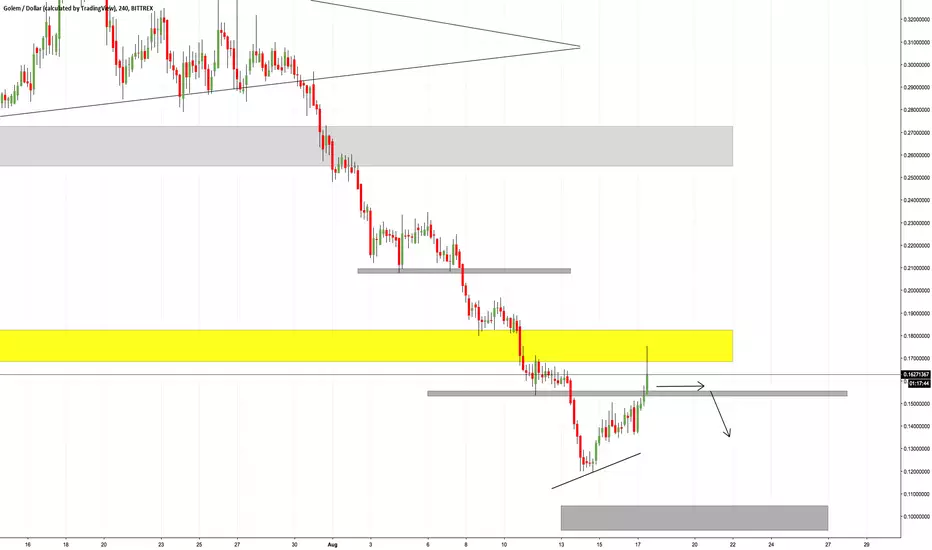
GNT 2HR ChartSmall resistance on $0.148 but after that we will be going down towards $0.12 then we should see $0.10 for sure..

GNT Huge resistance....GNT had a huge support at $0.19, as you can see this area has been tested a lot over the last 15 months and it has broken and now that has become the resistance and its a huge one, it will take huge buying power to take it over this..

GNT Possible Outcome.GNT finding resistance at $0.17 and will struggle to overcome that in the short term, after a %22 gain today we will see a sideways movement in the region of $0.14/$0.15 then we should be seeing $0.10..
golem abc alliot must be complete and wedge can be broke and bring us a good profit. cycle on chart is show us the downtrend will be terminate very soon,
good luck and if this analyze deserve alike press that.

GNTFalling Wedge
Targets on green
Thanks to 'theheirophant truckloadtrader' for his Bottom finder indicator... pretty cool.
Educational Only (im learning)
If you like my ideas, please hit Like, leave a comment, share them and follow me for more!!
GoodTrade
-CJ-

GNT Long-Term #GNT #GNTUSD #GNTBTC #GolemLong-term outlook on Golem is looking bullish. A lot of these altcoins are ready to move in my opinion so it is a good time to enter!

A trading opportunity to buy in GNTUSDTechnical analysis:
. GOLEM/DOLLAR is in a range bound and the beginning of uptrend is expected.
. The price is below the 21-Day WEMA which acts as a dynamic resistance.
. The RSI is at 42.
. While the RSI and the price downtrend in the Daily chart are not broken, bearish wave in price would continue .
Trading suggestion:
. There is a possibility of temporary retracement to suggested support zone (0.27 to 0.18). if so, traders can set orders based on Price Action and expect to reach short-term targets.
Beginning of entry zone (0.27)
Ending of entry zone (0.18)
Entry signal:
Signal to enter the market occurs when the price comes to "Buy zone" then forms one of the reversal patterns, whether "Bullish Engulfing" , "Hammer" or "Valley" in other words,
NO entry signal when the price comes to the zone BUT after any of the reversal patterns is formed in the zone.
To learn more about "Entry signal" and the special version of our "Price Action" strategy FOLLOW our lessons:
Take Profits:
TP1= @ 0.36
TP2= @ 0.40
TP3= @ 0.50
TP4= @ 0.58
TP5= @ 0.65
TP6= @ 0.76
TP7= @ 0.90
TP8= @ 1.38
TP9= Free

(GNT/BTC) Huge Ascending Triangle with Bullish Divergence.Entry 3900
Stoploss 3699 (-5.15%)
Target 1 8960 (+129.74%)
Risk Reward 25.17
Target 2 16161 (+314.38%)
Risk Reward 61.00
Disclaimer, my post are my own ideas, not financial advice.

GOLEM-BTC - FALLING WEDGE REVERSAL!!GNT is trying to breakout of the falling wedge. Notice that it is moving slightly under EMA(12). If it is able to break above it then we can expect some upwards movement.
Alternatively, if it is unable to breakout of the wedge then it will fall down towards the bottom of the wedge to the next support region from where it will try again to move upwards.
Please see the chart, everything is marked on it. The profit taking targets can be next Fibonacci levels.
(The EMAs still need more time to develop though since it is a lagging indicator).
Developing MACD:
Volume:
(I can post the chart with in depth analysis using indicators if people need it, but as for now, this should suffice.)
P.S: This is not an investment advice. This is for learning purposes only. This is my personal journal. Invest your capital at your own risk.
Keep an eye out. Trade safely. Always remember, money not lost is also a profit.
Good luck trading.!
Peace.

GOLEM: Profit PotentialGolem has finished the ABC correction and is ready to form wave 3 which has huge profit potential

#GOLEM #BITCOIN #BITCOINPRICE #TRADINGGolem is going through a channel. RSI seems to be into an ascending wedge so it suggest that price could rise up.
Profit target:
- 6110 Sats
- 7000 Sats
- 8600 Sats

GNT Cup and HandleIf this plays out, which appears to be likely we are going to see GNT consolidate before shooting up to the .618 extension levels around .41.
I'm looking at a re-trace due to the oversold RSI levels and a bounce off of the .5 fib re-tracement levels.
*Fingers Crossed Kappa*


$GNT, Running Smooth…
Weekly
Looking at our trend timeframe we see price forming higher highs and higher lows. GNT has recently bounced off our 5000 support zone, stochastic rsi showing momentum heading down, however price showing otherwise.
Daily
Shifting over to our pattern timeframe we see price currently being rejected by our resistance at 5500. Stochastic RSI showing momentum has peaked out and we should be price falling temporarily. A daily close above 5500 activates our trade.

$GNT (Golem) LevelsImportant levels for $gnt .
also, pay attention to this low RSI .
let me know what do you think about it.
Thanks.
