GOOGL Stock Analysis | Pullback Within an Established Uptrend🎯 GOOGL: The Great Heist Setup | Moving Average Pullback Play 💰
📊 Market Intelligence Brief
Asset: GOOGL (Alphabet Inc.) - NASDAQ
Strategy Type: Day/Swing Trade - Bullish Momentum
Risk Profile: Medium | Reward Potential: High 🚀
🔍 THE MASTER PLAN
We're eyeing a classic moving average pullback scenario on GOOGL. The stock's showing signs of institutional accumulation after touching key support zones. Time to execute the layered entry strategy!
🎯 ENTRY STRATEGY: "The Layered Vault Approach"
Entry Philosophy: Multiple limit orders (layering technique) to build position gradually
Suggested Entry Zones:
💵 Layer 1: $310.00
💵 Layer 2: $315.00
💵 Layer 3: $320.00
💵 Layer 4: $325.00
Note: You can add more layers or adjust levels based on your capital allocation and risk appetite
Pro Tip: Don't dump all your capital at one level. Scale in as price tests support - this is risk management 101! 🎓
🎯 PROFIT TARGETS & EXIT STRATEGY
Primary Target: 🎪 $356.00
This level acts as a strong resistance confluence zone with:
Historical rejection points 📉
Potential overbought conditions on RSI
Profit-taking zone for swing traders
Exit Strategy Notes:
Ladies & Gentlemen, while $356 is the mapped target, your profit is YOUR profit. If you see green and want to secure gains earlier, that's your prerogative. Markets don't owe us anything - take what you can get! 💼
Consider scaling out:
30% at $340 (first resistance)
40% at $350 (psychological level)
30% at $356 (final target)
🛡️ RISK MANAGEMENT: "The Safety Vault"
Stop Loss: 🚨 $308.00
This invalidation level sits below key support. If GOOGL breaks this, the bullish thesis is compromised.
Important Disclaimer:
This SL is a suggested risk parameter, not a mandate. Your risk tolerance, position size, and portfolio strategy should determine YOUR actual stop placement. Trading is personal - manage it accordingly! ⚖️
📈 FUNDAMENTAL & ECONOMIC CATALYSTS TO WATCH
🌐 Latest Market Factors (February 2026)
Let me pull the current market conditions and upcoming catalysts affecting GOOGL...
One moment while I fetch real-time fundamental data and economic factors! 🔄
🔗 CORRELATED ASSETS TO MONITOR
Tech Sector Watch List:
MSFT (Microsoft) - Cloud competitor correlation
META (Meta Platforms) - Digital ad spend correlation
AMZN (Amazon) - Big Tech sentiment gauge
NVDA (NVIDIA) - AI infrastructure correlation
QQQ (Nasdaq-100 ETF) - Overall tech sector health
Key Correlations:
When QQQ rallies, GOOGL typically follows (80%+ correlation)
Digital ad spending trends impact both GOOGL & META
AI narrative strengthens → watch NVDA momentum as leading indicator
USD strength matters: Tech giants earn globally, strong $ can pressure earnings
⚠️ HOUSE RULES COMPLIANCE CHECK
✅ Educational content - strategy explanation
✅ Risk disclosure - multiple warnings included
✅ No guaranteed returns claimed
✅ Personal responsibility emphasized
✅ Proper market terminology used
📝 FINAL THOUGHTS
This setup combines technical structure (MA pullback) with systematic risk management (layered entries). The "thief" terminology is purely thematic - we're playing by the rules, just with style! 😎
Remember:
Position size appropriately
Never risk more than 1-2% per trade
Markets are probabilistic, not predictive
Your edge is in risk management, not prediction
✨ If you find value in my analysis, a 👍 and 🚀 boost is much appreciated — it helps me share more setups with the community!
Googlelong

Google Parent Alphabet Shares Are Down PremarketAlphabet’s shares (NASDAQ: NASDAQ:GOOG ) were down in premarket trading on Thursday after the company beat Wall Street’s expectations on earnings and revenue, with AI spending projected to increase hugely this year.
The Google parent shed 2.9% in premarket, after closing nearly 2.16% lower on Wednesday. After the bell, Alphabet reported $113.83 billion in revenue in the fourth quarter, above the estimated $111.43 billion from analysts polled by LSEG.
Its Google Cloud division earned $17.66 billion in revenue versus a forecast of $16.18 billion, according to Street Account. YouTube Advertising earned $11.38 billion in revenue versus the estimated $11.84 billion.
The tech giant said it would significantly increase its 2026 capital expenditure to between $175 billion and $185 billion — more than double its 2025 spend. A significant portion of capex spending would go towards investing in AI compute capacity for Google DeepMind.
What analysts are saying
Barclays analysts said in a note on Thursday that Infrastructure, DeepMind, and Waymo costs “weighed on overall Alphabet profitability,” and will continue to do so in 2026.
“Cloud’s growth is astonishing, measured by any metric: revenue, backlog, API tokens inferenced, enterprise adoption of Gemini. These metrics combined with DeepMind’s progress on the model side, starts to justify the 100% increase in capex in ’26,” they said.
Analyst Summary
According to 43 analysts, the average rating for GOOGL stock is "Strong Buy." The 12-month stock price target is $333.33, which is an increase of 0.09% from the latest price.

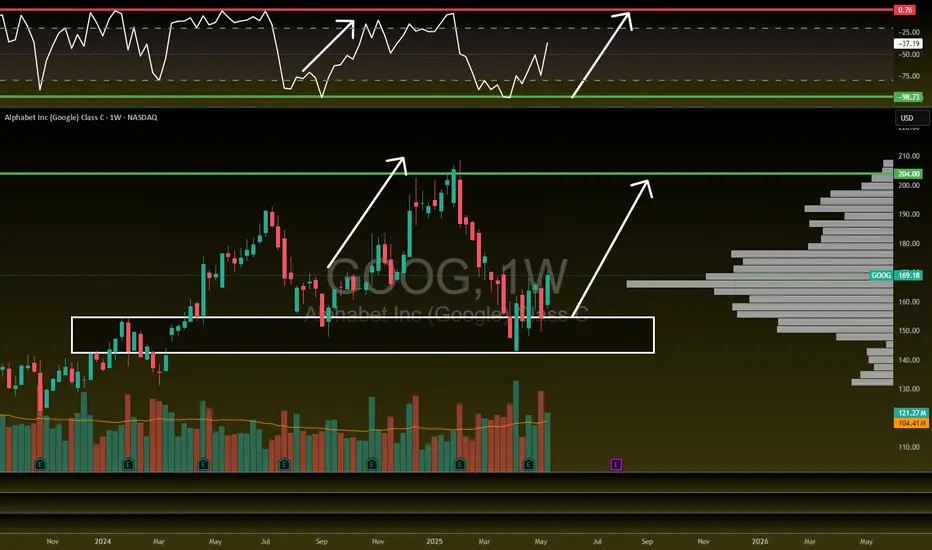
GOOG / GOOGLE / ALPHABETGOOG - following a cycle of 47 months. It bottoms out or tops out in the zone highlighted. Since the breakout in September 2025; seems headed for 381/416. Would make sense to book out any investments if it reaches there and wait for levels of 250 or lower.

Just In: Alphabet Inc. (NASDAQ: GOOG) Surging in Early PremarketShares of Alphabet Inc. (NASDAQ: NASDAQ:GOOG ) is experiencing a notable uptick of 0.63% in early market trading on Monday albeit market condition. The asset last close trading session was up 1.67% on Friday.
In recent news, A Spanish consumer rights association on Friday said it had launched preliminary legal action against Google for allegedly collecting sensitive personal data and violating their right to privacy.
The Association of Communication Users (AUC) says the US tech giant collected data about users' personal opinions, religion, sexuality and health through applications and the Android operating system, supporting their claim with a study by a Dublin-based university professor.
"Technology and the desire to provide a service have taken precedence over putting in place safeguards to protect people's privacy," AUC secretary general Bernardo Hernandez told AFP.
"The issue of privacy is extremely scandalous because not even the bare minimum is protected," he added, saying Google could have provided the same services without unnecessarily collecting "an excessive amount of data."
Analyst Summary
According to 44 analysts, the average rating for GOOG stock is "Strong Buy." The 12-month stock price target is $307.02, which is a decrease of -0.52% from the latest price.
Important Dates
The next estimated earnings date is Tuesday, February 3, 2026, after market close. The stock price has increased by +62.30% in the last 52 weeks.

Alphabet (NASDAQ: $GOOGL) Stock: 2025 Continues BullishAlphabet’s stock continues its remarkable performance in 2025, surging nearly 70% year-to-date as strong fundamentals and aggressive AI expansion fuel investor confidence. Much of the momentum comes from Alphabet’s rapidly growing cloud division and the continued rollout of Gemini, its advanced AI model powering enterprise workloads, search upgrades, and next-generation productivity tools. This expansion has pushed Alphabet’s market valuation close to $4 trillion, establishing it as one of the fastest-growing mega-caps this year.
Another major catalyst is Google’s deepening presence in India’s digital infrastructure. The Adani Group recently announced a $5 billion co-investment with Google to build a large-scale data center aimed at supporting India’s rising cloud, AI, and storage needs. This move comes shortly after Google committed $15 billion to an AI-focused data center cluster in Andhra Pradesh. Together, these investments reinforce Alphabet’s expanding footprint across one of the world’s fastest-growing markets and strengthen long-term revenue prospects.
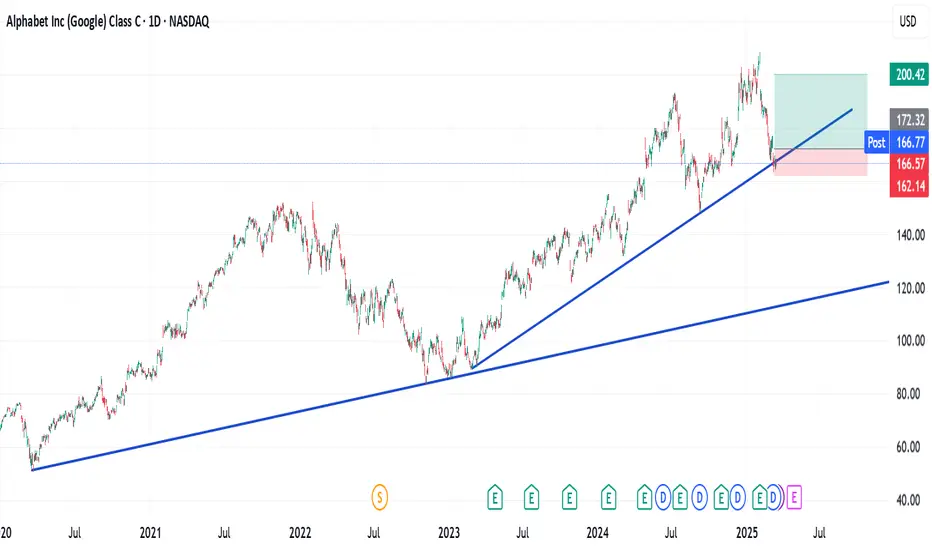
From a technical standpoint, GOOGL remains strongly bullish after breaking above a long-held ascending trendline that acted as multi-year resistance. The breakout triggered a sharp rally, pushing the stock to the current price around $320. Momentum indicators show extreme strength, with the MACD at record highs and RSI firmly overbought—signals that suggest the uptrend remains intact but may face volatility.
The next psychological resistance sits at $350, a level traders will watch closely. On the downside, immediate support lies at $291, followed by a stronger structural zone at $255. As long as price stays above the former trendline and these supports, the broader bullish structure remains dominant.

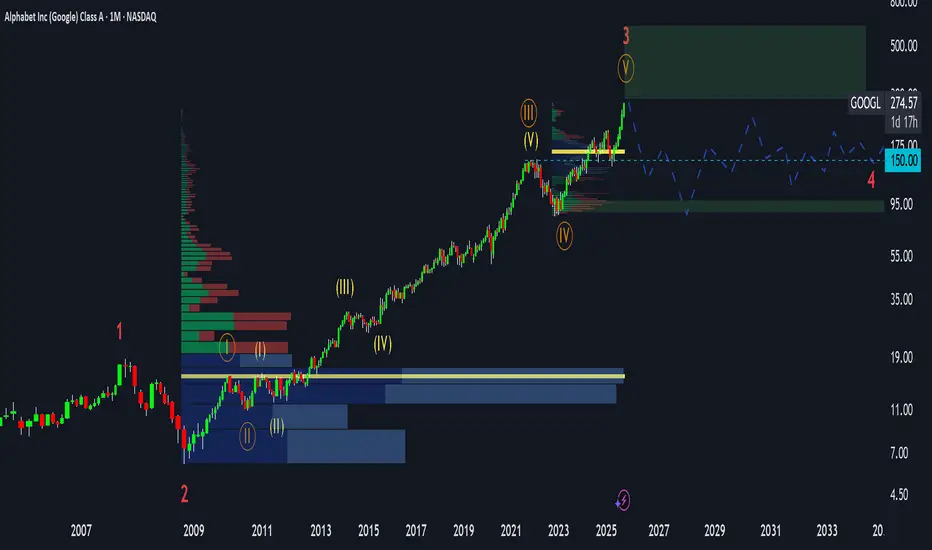
Is Google Entering Distribution? (GOOG, GOOGL Analysis)⚡ Overview
Recently, the charts of all major tech giants — Apple, Amazon, Google, Meta, and Microsoft — have started to look almost identical.
Each of them seems to be either topping out or entering what looks like a distribution phase.
In this post, I’ll share my technical and fundamental outlook on Google (GOOG, GOOGL), along with the key risks and price zones I’m watching as a trader.
💡 Fundamental View
From a fundamental perspective, Google still looks strong:
The P/E ratio has been growing steadily.
Revenue continues to rise.
The company has been aggressively buying back shares for years.
So fundamentally, this is not a bubble.
By Peter Lynch’s fair value formula, Google remains fairly valued, maybe even with a modest upside left.
However, strong fundamentals don’t always mean big growth ahead — especially when the market has already priced in perfection.
And that’s typically when the distribution phase begins.
📈 Technical View
According to Elliott Wave Theory, Google seems to be completing the fifth sub-wave within a larger third wave —
a structure that often marks the final stage before a distribution or correction phase.
On the long-term chart, price is now approaching the upper boundary of the rising channel,
with limited upside potential — possibly up to $430–$450, which represents the top zone.
Beyond that, the probability of continued growth drops sharply, while correction risk increases significantly.
⚙️ Market Structure
When analyzing the volume profile, the largest accumulation zone sits around $15 – $16 —
that’s where long-term investors entered 15 years ago.
Those early buyers are now sitting on massive unrealized profits,
and many are gradually distributing (selling) positions into current strength.
Meanwhile, retail traders often see the ongoing move as “more upside ahead.”
But in reality, this could be the final buying climax before a deeper correction.
🧩 Cycle Context
Interestingly, the same pattern is visible across Apple, Meta, Amazon, and Microsoft.
It’s not just about one stock — the entire Big Tech segment appears to be entering a similar maturity stage of the cycle.
That’s why I believe Google could soon transition from markup to distribution,
followed by a potential multi-quarter sideways or corrective phase.
💬 What’s your take? Do you think Google will reach $400 before correcting — or has the top already formed?
👇 Share your view in the comments.
Google Stock (NASDAQ: $GOOGL) Rises on Nano Banana Pro UpdateGoogle parent Alphabet (NASDAQ: NASDAQ:GOOGL ) introduced Nano Banana Pro, an upgraded version of its AI image-editing and generation platform powered by Gemini 3 Pro. The update improves text legibility inside AI-created images—one of the most persistent challenges for image models—and integrates deeper reasoning features from Gemini 3, enabling more consistent output and broader creative control.
The tool will also be available across Google Search’s AI Mode, the Gemini API, Google Ads, and Flow, the company’s filmmaking platform. Free-tier Gemini users will receive limited access quotas, a move designed to increase usage while showcasing the improved capabilities.
The launch comes just days after Google unveiled Gemini 3, a major release aimed at closing competitive gaps with OpenAI. According to The Wall Street Journal, the earlier launch of Nano Banana in August significantly accelerated user growth and retention, making this enhanced version a strategic release. While ChatGPT still leads in usage, Google’s rapid iteration suggests a strong push toward regaining market share across creative and enterprise AI applications.
Technical Analysis:
Alphabet shares have been bullish overall, recently breaking above a long-respected trendline to the upside. This breakout confirms ongoing upward momentum supported by improving AI fundamentals, rising cloud demand, and investor optimism around new product rollouts.
The stock did pull back on Friday following the Nano Banana Pro announcement, but the technical structure remains intact. The trendline breakout continues to act as a strong foundational level, and buyers may re-enter if price revisits that zone. A sustained hold above recent highs opens room toward the next major target region, while failure to reclaim momentum could trigger a short-term retest before continuation.
Overall, Google’s AI expansion supports the broader bullish bias, with fundamentals and technicals aligning for potential upside continuation.

Google ( $GOOG) Faces €573M Fine but Trend Remains BullishGoogle (GOOG) has been hit with a major legal setback after a Berlin court ordered the company to pay €573 million ($666 million) in damages to two German price-comparison platforms. The case stems from long-running antitrust disputes tied to Google’s alleged practice of favoring its own shopping service over competitors—an issue the European Commission initially penalized in 2017 with a €2.4 billion fine.
The court awarded Idealo €374 million plus €91 million in interest, while Producto GmbH will receive €89.7 million plus €17.7 million in interest. Both companies argued that Google’s search dominance limited their visibility, costing them years of lost revenue. Although pleased that much of the €3.3 billion originally sought by Idealo was dismissed, Google maintains that it disagrees with the ruling and will appeal. The company insists the 2017 remedy addressed the concerns and that the EU’s monitoring supported that view.
However, the Berlin judges concluded that Google’s changes were not sufficient to eliminate the competitive harm—even after 2017. This marks the first time a national European court has explicitly stated that Google’s remedy failed to end the abuse, potentially opening the door for billions more in follow-on claims across Europe. Plaintiffs may push for larger settlements, making this an evolving legal headwind for Alphabet.
Technical Outlook
Despite the legal news, GOOG’s chart remains structurally bullish. The stock has been in a steady uptrend, supported by consistent higher lows and strong demand across tech. Recently, price broke above a key trendline, signaling renewed upside momentum.
GOOG did experience a pullback on Friday as headlines hit, but the broader direction remains intact. As long as the stock holds above its breakout zone and the trendline, bullish continuation remains the dominant bias with buyers stepping in on dips.

Breaking: Alphabet Inc. (NASDAQ: $GOOG) Spike 12% TodayThe share price of Alphabet Inc. (NASDAQ: NASDAQ:GOOG ) Spike 8% on Thursday early market trading breaking out of a bullish flag pattern.
The asset is currently overbought as seen by the RSI at 83, making it poised for a reversal in the short term. Adding to the bullish thesis, NASDAQ:GOOG is trading above key MA respectively.
In another news, Google parent Alphabet
is planning a “significant increase” in spend next year as it continues to invest in AI infrastructure to meet the demand of its customer backlog, executives said Wednesday.
The company reported its first $100 billion revenue quarter on Wednesday, beating Wall Street’s expectations for Alphabet’s third quarter. Executives then said that the company plans to grow its capital spend for this year.
“With the growth across our business and demand from Cloud customers, we now expect 2025 capital expenditures to be in a range of $91 billion to $93 billion,” the company said in its earnings report.

Is This the Perfect Entry Zone for the Next GOOGL Upside Run?🎯 GOOGL: The "Thief's Heist" Trading Strategy | Layered Entry Playbook 📊
💼 Asset: ALPHABET INC. (GOOGL)
Market: NASDAQ | Style: Swing/Day Trade Hybrid
🎭 The Setup: Bulls Running the Show
Bias: 🟢 BULLISH
Listen up, trading family! 👋 GOOGL is setting up what I call the "Thief's Entry Strategy" - a layered approach that lets you accumulate positions like a professional poker player stacking chips. No FOMO, no chasing - just calculated, methodical entries that would make Ocean's Eleven jealous. 🎰
🚪 Entry Strategy: The "Thief Layering" Method
Instead of going all-in at one price (rookie move 🙅♂️), we're using multiple limit orders to build our position:
📍 Layered Buy Limits:
Layer 1: $240.00
Layer 2: $245.00
Layer 3: $250.00
💡 Pro Tip: You can add more layers or adjust levels based on your risk appetite and account size. This method reduces average cost and minimizes timing risk - basically, you're stealing better prices while everyone else panic-buys at the top! 😎
Alternative: If you prefer simplicity, current market price entry works too - but where's the fun in that? 🤷♂️
🛡️ Risk Management: The "Escape Route"
Stop Loss: $235.00
⚠️ Reality Check: Dear Thief OG's (Original Gangsters of Trading), this is MY stop loss level based on technical structure. YOU need to assess your own risk tolerance, position size, and account management rules. Your money = your rules. Trade at your own risk, always! 🎲
🎯 Target Zone: The "Electric Fence"
Take Profit: $275.00
This level represents a confluence of:
⚡ Strong resistance zone (high voltage wall!)
📈 Potential overbought conditions
Bull trap territory where late buyers get caught
Strategy: Scale out as we approach target. Don't be greedy - banks get robbed, but smart thieves get away clean! 💰
⚠️ Reality Check #2: This is MY target. You might want to take profits earlier, hold for more, or scale out in portions. Your trading plan, your decision. Secure the bag at your own discretion! 💼
🔗 Related Pairs to Watch (Correlation Play)
Keep your eyes on these tech titans - they often move in sympathy:
NASDAQ:MSFT - Microsoft Corp | Big tech correlation, AI play
NASDAQ:AAPL - Apple Inc. | FAANG/tech sector leader
NASDAQ:META - Meta Platforms | Ad revenue correlation with GOOGL
NASDAQ:NVDA - NVIDIA | AI infrastructure play
NASDAQ:QQQ - Nasdaq 100 ETF | Overall tech sector health indicator
Why it matters: If these pairs show weakness, GOOGL might follow. If they're pumping, wind's at our back! 🌊
📊 Key Technical Points
✅ Support holding at current structure
✅ Bullish momentum building on lower timeframes
✅ Risk-reward ratio favorable with layered entries
✅ Volume profile suggesting accumulation phase
🎬 The "Thief Style" Philosophy
This isn't financial advice - it's a trading game plan based on technical analysis and strategic positioning. The "Thief" approach means:
Stealth entries (layering in)
🧠 Smart exits (not overstaying the party)
🎯 Calculated risk (always know your out)
🎪 Having fun while staying professional
📉 Trading involves substantial risk of loss and is not suitable for everyone. Past performance is not indicative of future results.
✨ If you find value in my analysis, a 👍 and 🚀 boost is much appreciated — it helps me share more setups with the community!
🏷️ Tags:
#GOOGL #Alphabet #StockMarket #SwingTrading #DayTrading #TradingStrategy #TechnicalAnalysis #StockAnalysis #NASDAQ #TechStocks #LayeredEntry #RiskManagement #TradingIdeas #PriceAction #SupportAndResistance #ThiefStrategy #FAANG
Trade smart, stay safe, and remember: the market doesn't care about your feelings - only your strategy matters! 🎯💪
GOOG Bulls Loading Calls ($243.5) – Ride or Fade?
## 🔥🚀 GOOG Weekly Options Alert 🚀🔥
📊 **Cheap Weekly Call Setup – Big Risk / Big Reward!** 💎💰
### ✅ Key Takeaways
* 📈 **Flow & Volume:** Institutional call flow 🔥 (C/P ratio **295:1**) with 1.3x volume → Bullish bias.
* ⚡ **Volatility:** VIX \~17 → Favorable for short-term calls.
* 🛑 **Caution:** Daily RSI 70.6, Weekly RSI 77 → Momentum divergence 📉.
* ⏰ **Risk:** Only 2 days to expiry → Theta & Gamma risk sky high ⚡.
### 🎯 Trade Setup (High-Risk, Small Size)
* 🏦 **Instrument:** GOOG
* 🚀 **Strike:** \$243.00
* 💵 **Entry Price:** \$0.11
* 🛑 **Stop Loss:** \$0.06 (50%)
* 🎯 **Target:** \$0.22 (100% gain)
* 📅 **Exit Plan:** By **Thursday EOD** (don’t hold into Friday gamma risk)
* 📊 **Confidence:** 65%
### ⚠️ Key Risks
* 🕒 Time decay (theta) → Premium melts fast.
* 📉 Momentum exhaustion → RSI overbought, possible pullback.
* 📊 Liquidity → Tight spreads, use limit orders.
---
## 📌 Viral Tags (TradingView + SEO)
\#GOOG #OptionsTrading #WeeklyOptions #CallOptions #SwingTrade #Breakout #StockMarket #GOOGAnalysis #TechStocks #RiskReward #TradingSetup #GammaRisk #ThetaDecay #MomentumTrading

GOOG 2026 LEAPs: $205 Calls for the Next Big Tech Wave!## 🚀 GOOG LEAP Setup (2025-08-08) 🚀
**Bias:** 📈 **Moderate Bullish** (short-term momentum + low volatility)
**Strategy:** Buy Call LEAP – Target upside with managed risk.
**🎯 Trade Plan**
* **Instrument:** \ NASDAQ:GOOG
* **Type:** CALL (LONG)
* **Strike:** \$205 (0.6-0.7 delta sweet spot)
* **Entry:** \$27.40
* **Profit Target:** \$54.80 (+100%)
* **Stop Loss:** \$18.22 (-30%)
* **Expiry:** 2026-09-18
* **Size:** 1 contract
* **Confidence:** 72%
**📊 Key Notes:**
* RSI (Weekly): 70.1 → strong momentum
* VIX: 15.4 → favorable for LEAP entries
* High valuation (90% of 52-week range) = pullback risk ⚠️
* OI = 0 → possible liquidity challenges

Big Money is Buying GOOGL Calls — Are You In?
## 🚨 GOOGL WEEKLY TRADE IDEA (Aug 4–8)
**Institutional CALL Buying Surges — \$197.50 CALL Setup Triggered**
---
### 📊 Model Consensus Breakdown:
* **🔁 Call/Put Ratio**: **3.33** — strong bullish options bias
* **📉 RSI**: Weak Daily & Weekly = ⚠️ caution zone
* **💰 Volume**: Institutional call flow ✅ but light overall volume ❌
* **🧠 AI Model Split**:
* ✅ **Grok, Gemini**: Bullish lean
* ⚠️ **Claude, DeepSeek**: No trade – weak conviction
* ⚖️ **Meta**: Wait-and-see bias
🧭 **Net Sentiment: MODERATE BULLISH** (With structural caution)
---
### 🎯 Trade Setup:
| 🔧 Strike | 💵 Entry | 🎯 Target | 🛑 Stop | 📅 Expiry | 🔒 Confidence |
| ------------- | -------- | --------- | ------- | --------- | ------------- |
| \$197.50 CALL | \$0.69 | \$1.05+ | \$0.34 | Aug 8 | 65% ✅ |
🕰 **Entry Timing:** Market open
🔍 **Volume Note:** Trade ONLY if opening volume aligns with premarket flow
📉 **Momentum Flag:** Falling RSI = quick exits if invalidated
---
### 🔥 WHY IT MATTERS:
* **Whales Are Loading Calls** despite momentum weakness
* **VIX Low = Options Cheap** = better R\:R on call spreads or singles
* **Target Return**: \~52% upside on premium w/ tight risk guardrails
---
### 🚨 RISKS:
* RSI trend down → invalidates quickly
* Weak market breadth = easy rejection on fakeouts
* Earnings hangover & macro drag = overhang risk
---
### 🏷️ Hashtags / Tags:
`#GOOGL #Alphabet #OptionsTrade #CallOption #AITrading #BullishFlow #TradingView #WeeklySetup #StockSignal #RiskReward`

GOOGL TRADE IDEA (07/24)
🚨 GOOGL TRADE IDEA (07/24) 🚨
💥 Big institutional flow. 1 DTE. High gamma = high reward (⚠️ high risk too)
🧠 Quick Breakdown:
• Call/Put Ratio: 2.44 → ultra bullish
• Weekly RSI climbing (67.3) 📈
• Daily RSI falling from 77.5 → 🔻 short-term pullback risk
• Reports split: trade or wait? We’re in.
💥 TRADE SETUP
🟢 Buy GOOGL $200 Call exp 7/25
💰 Entry: $2.09
🎯 Target: $3.14–$4.18 (50–100%)
🛑 Stop: $1.25
📈 Confidence: 70%
⚠️ Expiry in 1 day = tight execution needed. Gamma can cut both ways. Watch it like a hawk. 👀
#GOOGL #OptionsFlow #CallOption #GammaSqueeze #TechStocks #UnusualOptionsActivity #TradingView #StockAlerts #BigMoneyMoves #DayTrading #OptionsTrading
GOOG Earnings Setup (2025-07-23)
📈 GOOG Earnings Setup (2025-07-23) 🚀
🔥 STRONG BULLISH BIAS – 85% Confidence
Alphabet (GOOG) is set to report after market close. Here’s why this setup is 🔥:
⸻
📊 Fundamental Highlights:
• 💸 TTM Revenue Growth: +12.0%
• 🧾 Profit Margin: 30.9%
• 💯 Earnings Beat Rate: 8/8 last quarters
• 📈 EPS Est: $8.95
• 🎯 Forward P/E: Attractive in the AI-dominant market
👉 Score: 9/10
⸻
🔍 Options Market Flow:
• 🚀 Heavy Call buying at $195 strike
• 💰 Implied Move: ±5.12%
• 🛡️ Light Put hedging at $190 shows cautious optimism
• 📉 IV Rank: 0.75 (Elevated but tradable)
👉 Score: 8/10
⸻
🧭 Technicals:
• 🔺 RSI: 73.32 (strong momentum)
• 🔼 Above 50/200 MA
• 🔵 Support: $190.00
• 🔴 Resistance: $200.00
👉 Score: 8/10
⸻
🌍 Macro/Sector Tailwinds:
• 🌐 AI & Ads tailwind still fueling growth
• 📡 Sector leadership + resilient biz model
👉 Score: 9/10
⸻
🛠️ Trade Idea (High Conviction)
🔹 Ticker: NASDAQ:GOOG
🔹 Direction: CALL
🔹 Strike: $195.00
🔹 Expiry: 07/25/2025
💵 Entry Premium: $3.95
🎯 Target Premium: $11.85 (200%)
🛑 Stop: $1.98 (50%)
📅 Entry: Before 07/23 Close (Pre-Earnings)
⸻
📌 Risk-Reward
• Max Loss: $395 per contract
• Target Gain: $1,190 per contract
• Break-even: $198.95
• ⏳ Time-sensitive: Close post-earnings if flat (avoid IV crush)
⸻
🚨 Summary
💥 GOOG looks primed for an upside breakout. Strong fundamentals + bullish technicals + aggressive options flow make this a top-tier earnings play.
🔔 Watch $195–$200 zone post-earnings.
💬 Drop your thoughts 👇 — are you playing GOOG this earnings?

Alphabet - The textbook break and retest!📧Alphabet ( NASDAQ:GOOGL ) will head much higher:
🔎Analysis summary:
If we look at the chart of Alphabet we can basically only see green lines. And despite the recent correction of about -30%, Alphabet remains in a very bullish market. Looking at the recent all time high break and retest, there is a chance that we will see new all time highs soon.
📝Levels to watch:
$200
🙏🏻#LONGTERMVISION
Philip - Swing Trader

$141 Stop, $207 Target — Bullish Setup on GOOGL with 1.4RMarket Context
Alphabet Inc. (GOOGL) is showing renewed bullish momentum on the 2-week chart. After a healthy correction earlier in the year, price action is now turning decisively upward, reclaiming its long-term trendline and bouncing off a major support level. This setup suggests a shift in market sentiment from consolidation to breakout mode, with significant upside potential.
Key Technical Levels
• Key Support – $151.90
This zone has acted as a major demand level and was tested multiple times. The recent bounce from here reaffirms its strength and underscores the market’s willingness to buy dips at this level.
• Stop Loss – $141.49
Positioned just below the Key Support, this stop loss accounts for volatility while protecting against a full breakdown. A close below this level would invalidate the bullish thesis.
• Resistance Level 1 (TP1) – $191.91
This price level marks a prior swing high and represents the first bullish target.
• Resistance Level 2 (TP2) – $207.32
A clear breakout beyond TP1 sets up the path toward this higher resistance, which also aligns with historical supply from mid-2021.
• Trendline Reclaim
The multi-year ascending trendline, breached temporarily, has now been reclaimed with conviction — a strong bullish signal on higher timeframes.
Trade Setup
• Entry Zone: $168.00 – $169.00
• Take Profit 1 (TP1): $191.91 (approx. 14% upside)
• Take Profit 2 (TP2): $207.32 (approx. 23% upside)
• Stop Loss: $141.49 (just below Key Support)
• Risk–Reward Ratio: Approximately 1.43
Price Action & Trend Confirmation
After establishing a series of higher lows, GOOGL has rebounded from the $151.90 zone with strength, forming a bullish engulfing candle on the 2W chart. This move brought the price back above the long-term trendline — a textbook bullish signal when viewed on a macro timescale. The structure now favors trend continuation, especially if the price holds above the $168–$170 zone in the short term.
Risk Management and Strategy
The stop loss below $151.90 is deliberately placed at $141.49 to avoid premature exit from minor volatility. This level is safely beneath the most recent swing low and gives the trade breathing room to develop. A partial exit at TP1 locks in gains while preserving capital for the extended move to TP2, where major resistance could trigger broader market attention.
Conclusion
GOOGL is setting up for a high-probability breakout from a clean technical base. With the price respecting long-term support, reclaiming the trendline, and establishing bullish momentum, the path of least resistance is upward. The trade offers a solid reward-to-risk profile and aligns with institutional-style setups often seen prior to extended rallies.
In short: GOOGL looks ready to move, and this is a setup bulls won’t want to ignore.

Google primed for a 20% move!NASDAQ:GOOG NASDAQ:GOOGL looks COILED! 🚀
Currently retesting Inverse H&S breakout and H5_S Indicator here.
Bounce will lead us too...🎯$176.52📏$200.16
- Volume shelf launch
- Bullish WR%
- Bullish weekly uptrend
- Severely undervalued
Google to $200!NASDAQ:GOOG NASDAQ:GOOGL
We are uptrending back to ATHs on Google here after they have lagged this whole rally and are the CHEAPEST MAG 7 STOCK!
- Volume shelf launch
- Rising Wr%
- Bouncing off key S/R zone
- H5 Indicator is about to flip to green and make a bullish cross
- Volume is climbing
- Bullish engulfing candle
- Daily looks great as well
Target is $200
$GOOG Trade Alert! 20% Upside🚨 H5 Trade Alert: NASDAQ:GOOGL NASDAQ:GOOG
PT: $176.52 🎯
MM: $200 📏 by July 29th ⏲️
- Green H5 Indicator
- Inverse H&S Breakout
- Volume Shelf Launch
- Increasing Volume
- Lagging Rally
- Cheapest MAG7
- Weekly Trend Rising
Not financial advice

$GOOGL primed for a BIG MOVE!NASDAQ:GOOGL primed for a BIG MOVE! 🚀
Heading into earnings, this stock’s valuation has been overlooked—but strong results could flip the narrative fast! 💨
✅ Bounced off 2021 highs
✅ RSI at its lowest since COVID
✅ Major indicators curling upward
✅ Volume shelf launch incoming
✅ Wr% pendulum swinging
Momentum is building—are you ready? 👀
Not financial advice

Google -GOOG at a critical junctureGoogle -GOOG at a critical juncture
If this asset breaks above the trendline sustainably, I will expect this asset to push further to the north.
The TL will become support level and my SL will be below the TL as shown on my chart.
Trade with care
Is GOOGL Setting Up for a Rebound?The corrective move continues, offering potential opportunities for strategic entries. If the dip extends, these key levels could present buying opportunities:
📉 Entry Points:
🔹 165
🔹 158
🔹 150
🔹 135-130 ⚠️ Possible deeper entry point???
📈 Profit Targets:
🔹 175
🔹 181
🔹 190
Will GOOGL find support at these levels and bounce back, or is there more downside ahead? Stay prepared and manage your risk wisely.
Disclaimer: The information provided is for educational purposes only and does not constitute investment advice. Trading involves significant risks, and past performance is not indicative of future results. Always conduct your own analysis and consult a financial advisor before making any investment decisions.
