Alphabet - The only surviving stock!🏅Alphabet ( NASDAQ:GOOG ) is clearly not bearish yet:
🔎Analysis summary:
The entire tech sector is currently collapsing. But Alphabet remains totally strong and is sitting close to new all time highs. But considering that current retest of the major resistance trendline, a short term pullback in the near future is more and more likely.
📝Levels to watch:
$350
SwingTraderPhil
SwingTrading.Simplified. | Investing.Simplified. | #LONGTERMVISION
Googleshort

Google Parent Alphabet Shares Are Down PremarketAlphabet’s shares (NASDAQ: NASDAQ:GOOG ) were down in premarket trading on Thursday after the company beat Wall Street’s expectations on earnings and revenue, with AI spending projected to increase hugely this year.
The Google parent shed 2.9% in premarket, after closing nearly 2.16% lower on Wednesday. After the bell, Alphabet reported $113.83 billion in revenue in the fourth quarter, above the estimated $111.43 billion from analysts polled by LSEG.
Its Google Cloud division earned $17.66 billion in revenue versus a forecast of $16.18 billion, according to Street Account. YouTube Advertising earned $11.38 billion in revenue versus the estimated $11.84 billion.
The tech giant said it would significantly increase its 2026 capital expenditure to between $175 billion and $185 billion — more than double its 2025 spend. A significant portion of capex spending would go towards investing in AI compute capacity for Google DeepMind.
What analysts are saying
Barclays analysts said in a note on Thursday that Infrastructure, DeepMind, and Waymo costs “weighed on overall Alphabet profitability,” and will continue to do so in 2026.
“Cloud’s growth is astonishing, measured by any metric: revenue, backlog, API tokens inferenced, enterprise adoption of Gemini. These metrics combined with DeepMind’s progress on the model side, starts to justify the 100% increase in capex in ’26,” they said.
Analyst Summary
According to 43 analysts, the average rating for GOOGL stock is "Strong Buy." The 12-month stock price target is $333.33, which is an increase of 0.09% from the latest price.

Is Google headed for a downturn?After a strong uptrend since April 25, a pullback may be due. Watch the 325 support closely—if it breaks, downside targets open at 275 and potentially 245.

GOOGL: at the top of important resistance zone NASDAQ:GOOGL earnings tomorrow. Price is balancing at the upper boundary of an important resistance zone, which could attract substantial selling pressure.
That makes a reasonable case for hedging at these levels in case of a downside trend shift, potentially leading to 280–240 macro support.
Chart:
Previous trend analysis since Jul'25:

GOOGL on Daily, Bearish RSI Divergence Suggests Momentum ShiftNASDAQ:GOOGL showing bearish RSI divergence on the daily even the price making highs but RSI failing to confirm, signaling weakening momentum. Why?
1. Sector Rotation / Tech Pullback Drift
Market participants have been rotating out of major tech names into cyclicals or defensive sectors. Even fundamentally strong stocks like Google can see weakness when momentum indicators suggest stalling and bearish RSI divergence feeds into that rotation narrative. Weakness in broader markets tends to hit growth and tech stocks hardest.
2. Increasing Focus on Regulation & Competitive Pressure
Although not a direct recent headline, regulatory scrutiny and competition in AI and cloud services especially from rivals like Microsoft and Amazon create noise that feeds into short-term trader caution. This can reduce upside conviction and exaggerate pullbacks after overextended moves.
In addition to this, if you noticed from the recent NASDAQ:MSFT earnings, profit taking is happening after a strong 2025. Earnings coming soon for this stock and the probability of getting the same price action is now high.
I'd stay bearish for now.

Alphabet - This stock is reversing now!🔪Alphabet ( NASDAQ:GOOG ) is reversing very soon:
🔎Analysis summary:
Alphabet created a textbook all time high break and retest back in mid 2025. The recent rally has therefore been totally expected. But now, Alphabet is totally overextended, retesting a major resistance trendline and about to also create bearish confirmation.
📝Levels to watch:
$300
SwingTraderPhil
SwingTrading.Simplified. | Investing.Simplified. | #LONGTERMVISION

Alphabet - The exceptional short setup!🔒Alphabet ( NASDAQ:GOOG ) is reversing right now:
🔎Analysis summary:
Alphabet is clearly indicating a major bearish move. With the current retest of major resistance, Alphabet is slowly reversing. Since Alphabet is also massively overextended, really everything is pointing towards a move lower. Just give it a couple of days to reverse.
📝Levels to watch:
$300
SwingTraderPhil
SwingTrading.Simplified. | Investing.Simplified. | #LONGTERMVISION

Just In: Alphabet Inc. (NASDAQ: GOOG) Surging in Early PremarketShares of Alphabet Inc. (NASDAQ: NASDAQ:GOOG ) is experiencing a notable uptick of 0.63% in early market trading on Monday albeit market condition. The asset last close trading session was up 1.67% on Friday.
In recent news, A Spanish consumer rights association on Friday said it had launched preliminary legal action against Google for allegedly collecting sensitive personal data and violating their right to privacy.
The Association of Communication Users (AUC) says the US tech giant collected data about users' personal opinions, religion, sexuality and health through applications and the Android operating system, supporting their claim with a study by a Dublin-based university professor.
"Technology and the desire to provide a service have taken precedence over putting in place safeguards to protect people's privacy," AUC secretary general Bernardo Hernandez told AFP.
"The issue of privacy is extremely scandalous because not even the bare minimum is protected," he added, saying Google could have provided the same services without unnecessarily collecting "an excessive amount of data."
Analyst Summary
According to 44 analysts, the average rating for GOOG stock is "Strong Buy." The 12-month stock price target is $307.02, which is a decrease of -0.52% from the latest price.
Important Dates
The next estimated earnings date is Tuesday, February 3, 2026, after market close. The stock price has increased by +62.30% in the last 52 weeks.

Google is trading in a high-risk zone.Google (Alphabet) Stock Analysis
As shown on Chart A, Google is trading within a 5-year ascending channel on the weekly timeframe and has now reached the upper boundary of the channel.
On Chart B (daily timeframe), price has broken below its rising channel and has already moved toward the mid-level of the extended channel.
Given the strong bullish momentum in the most recent move, the probability of a sharp sell-off appears limited. However, considering the bearish divergence in the last price leg, along with the presence of a large unfilled gap that price has never revisited, a corrective move can be expected.
Based on these factors, a pullback at least toward the $217 level remains a plausible scenario.
This analysis will be updated accordingly.
Follow me on TradingView for more analyses and live stock trades.
NASDAQ:GOOG

Google - A major correction starts now!🚽Google ( NASDAQ:GOOGL ) is now creating a top:
🔎Analysis summary:
Over the course of the past couple of months, we witnessed a major rally on Google of about +100%. This rally was totally expected, following the underlying bullish rising channel. But with the current retest of the trendline, Google is heading for a major correction.
📝Levels to watch:
$300 and $200
SwingTraderPhil
SwingTrading.Simplified. | Investing.Simplified. | #LONGTERMVISION

Is Google Entering Distribution? (GOOG, GOOGL Analysis)⚡ Overview
Recently, the charts of all major tech giants — Apple, Amazon, Google, Meta, and Microsoft — have started to look almost identical.
Each of them seems to be either topping out or entering what looks like a distribution phase.
In this post, I’ll share my technical and fundamental outlook on Google (GOOG, GOOGL), along with the key risks and price zones I’m watching as a trader.
💡 Fundamental View
From a fundamental perspective, Google still looks strong:
The P/E ratio has been growing steadily.
Revenue continues to rise.
The company has been aggressively buying back shares for years.
So fundamentally, this is not a bubble.
By Peter Lynch’s fair value formula, Google remains fairly valued, maybe even with a modest upside left.
However, strong fundamentals don’t always mean big growth ahead — especially when the market has already priced in perfection.
And that’s typically when the distribution phase begins.
📈 Technical View
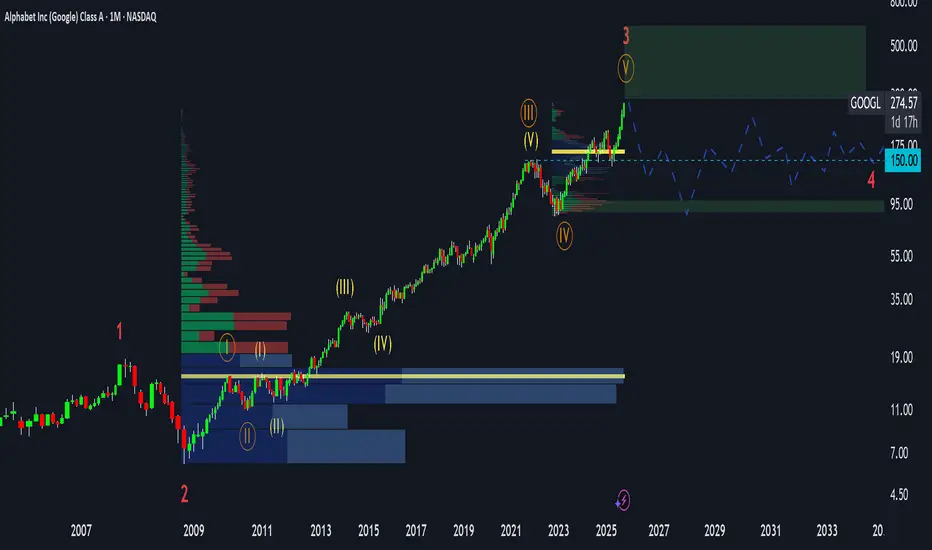
According to Elliott Wave Theory, Google seems to be completing the fifth sub-wave within a larger third wave —
a structure that often marks the final stage before a distribution or correction phase.
On the long-term chart, price is now approaching the upper boundary of the rising channel,
with limited upside potential — possibly up to $430–$450, which represents the top zone.
Beyond that, the probability of continued growth drops sharply, while correction risk increases significantly.
⚙️ Market Structure
When analyzing the volume profile, the largest accumulation zone sits around $15 – $16 —
that’s where long-term investors entered 15 years ago.
Those early buyers are now sitting on massive unrealized profits,
and many are gradually distributing (selling) positions into current strength.
Meanwhile, retail traders often see the ongoing move as “more upside ahead.”
But in reality, this could be the final buying climax before a deeper correction.
🧩 Cycle Context
Interestingly, the same pattern is visible across Apple, Meta, Amazon, and Microsoft.
It’s not just about one stock — the entire Big Tech segment appears to be entering a similar maturity stage of the cycle.
That’s why I believe Google could soon transition from markup to distribution,
followed by a potential multi-quarter sideways or corrective phase.
💬 What’s your take? Do you think Google will reach $400 before correcting — or has the top already formed?
👇 Share your view in the comments.
Breaking: Alphabet Inc. (NASDAQ: $GOOG) Spike 12% TodayThe share price of Alphabet Inc. (NASDAQ: NASDAQ:GOOG ) Spike 8% on Thursday early market trading breaking out of a bullish flag pattern.
The asset is currently overbought as seen by the RSI at 83, making it poised for a reversal in the short term. Adding to the bullish thesis, NASDAQ:GOOG is trading above key MA respectively.
In another news, Google parent Alphabet
is planning a “significant increase” in spend next year as it continues to invest in AI infrastructure to meet the demand of its customer backlog, executives said Wednesday.
The company reported its first $100 billion revenue quarter on Wednesday, beating Wall Street’s expectations for Alphabet’s third quarter. Executives then said that the company plans to grow its capital spend for this year.
“With the growth across our business and demand from Cloud customers, we now expect 2025 capital expenditures to be in a range of $91 billion to $93 billion,” the company said in its earnings report.

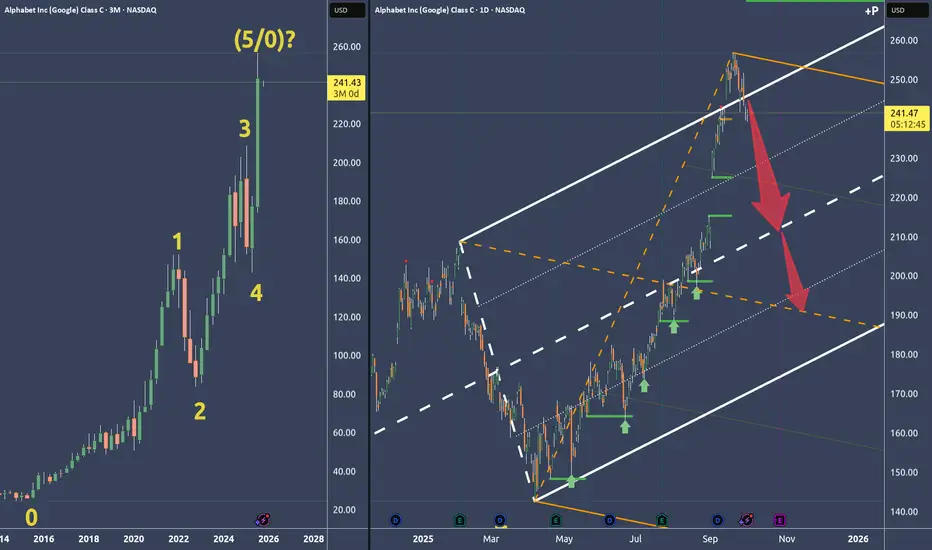
Google Alphabet: Why I think it's time to short🔱 Simple decision because of the Fork framework 🔱
Left Chart:
Zero-to-five count with a potential P5 and a turn.
Why P5?...
Right Chart:
...because price broke out of the U-MLH, then fell back into the fork. As a filter I like it when price is opening and closing inside the fork again. All in all it's a new and weak behaviour.
Or in short: That’s a pretty darn strong short signal to me.
Following the rules, taking acceptable risks, and hunting a fat profit.
👉 PTG1: The white centerline
👉 PTG2: The orange centerline
🛷 Happy Sleigh Ride 🎄
GOOGL Weekly Options Trade Plan 2025-04-17GOOGL Weekly Analysis Summary (2025-04-17)
Below is our integrated analysis for GOOGL weekly options trading based on the current options data and the multiple model reports:
──────────────────────────────
Comprehensive Summary of Each Model’s Key Points
• Grok/xAI Report – Observes that although the 5‐minute chart shows a hint of short‐term bullishness, the daily chart is clearly bearish (price below the 10 EMA and RSI around 41) and news catalysts (antitrust concerns) add further downside bias. – Highlights a significant concentration of put open interest around the $150 strike and recommends buying the $150 put at a premium of about $0.24 with an entry at open. – Suggested profit target at roughly a 50% premium increase and a stop loss if the premium falls by about 25% (or if the price fails to break key resistance).
• Claude/Anthropic Report – Confirms a moderately bearish bias with price trading below all key daily EMAs and negative regulatory news intensifying the downside. – Points to the heavy open interest in the 150 puts and emphasizes that although max pain is at $155 (a theoretical pull toward higher prices), the aggressive negative catalyst trumps this signal. – Recommends a put trade with guidelines for profit-taking (roughly a 100% premium gain) and a 50% premium stop-loss; entry to be made at market open.
• Gemini/Google Report – Notes the strong bearish daily setup (price clearly below the 10/50/200 averages and near key supports around $150) combined with negative antitrust headlines. – While acknowledging some short-term consolidation on the 5-minute chart, the report favors a bearish play and selects the $150 put (even though its premium of $0.24 is a bit below the “ideal” $0.30–$0.60 range). – Recommends entering at open with specific targets (aiming for around a 100% return on premium or an exit if the underlying fails to break levels) and strict stop-loss discipline.
• Llama/Meta Report – Summarizes that the technicals (including MACD and RSI on both timeframes) and high volatility (VIX ~32.64) combine for a moderately bearish setup. – The heavy put open interest at $150 further reinforces this view. – Recommends buying the $150 put at market open with a modest profit target (around a 50% gain on premium) and a stop-loss if the underlying rallies above key resistance levels.
• DeepSeek Report – Emphasizes that despite the max pain at $155, the technical breakdown below key moving averages and significant negative news support a bearish trade. – Recommends buying weekly (0DTE) $150 puts at the current premium of $0.24, with exit parameters tied to breaching immediate support or achieving a 50% gain in premium. – Notes that risk management is crucial given the 0DTE nature and high volatility.
────────────────────────────── 2. Areas of Agreement and Disagreement Between Models
• Agreement: – All models share a moderately bearish outlook driven by a combination of: ○ Price performance below key moving averages and declining daily RSI. ○ Negative news catalysts (antitrust issues and breakup concerns). ○ Heavy put open interest at the $150 strike, aligning with technical support. – Each model favors a single-leg, naked put strategy on GOOGL weekly expirations, with an entry at market open.
• Disagreement: – There is some variation in the selection of profit target and stop loss levels: ○ Grok/xAI and DeepSeek lean toward a profit target near a 50% premium gain and a tighter stop loss, while Claude/Anthropic and Gemini reference a slightly larger profit target (up to 100% gain) paired with a 50% stop loss. – There is a mild conflict with the max pain theory (which is bullish at $155) versus the consensus technical and news story indicating further downside. However, all models agree that the negative catalysts outweigh the theoretical pull toward max pain.
────────────────────────────── 3. Conclusion and Trade Recommendation
• Overall Market Direction Consensus: – The integrated view is moderately bearish. Although intraday charts hint at short-term consolidation, the dominant daily technicals, high volatility, and strongly negative news set the stage for further downside pressure.
• Recommended Trade: – We recommend buying a single-leg, naked put option. – Selected Instrument: GOOGL weekly option with a $150 strike (0DTE expiring on 2025-04-17). – Premium: The current ask is $0.24 per contract. Although this is slightly below the ideal range, the risk/reward profile is favorable given the strong technical and sentiment bias. – Entry Timing: Enter at market open. – Profit Target: Aim for a premium increase to approximately $0.36 (a ~50% gain). – Stop-Loss: Set a stop-loss around $0.12 (roughly a 50% reduction in premium), or exit if the underlying rallies decisively above the intraday resistance levels (around $152). – Confidence Level in the Recommendation: Approximately 70%.
• Key Risks and Considerations: – The max pain level at $155 could introduce some intraday upward pressure. – High implied volatility (VIX at 32.64) means rapid moves could quickly hit stop-loss triggers. – The 0DTE nature of the option calls for strict monitoring; if GOOGL fails to break below key support levels early on, exit the position promptly. – Overall market reversals or unexpected news can rapidly change the trade dynamics.
────────────────────────────── 4. TRADE_DETAILS (JSON Format)
{ "instrument": "GOOGL", "direction": "put", "strike": 150.00, "expiry": "2025-04-17", "confidence": 0.70, "profit_target": 0.36, "stop_loss": 0.12, "size": 1, "entry_price": 0.24, "entry_timing": "open" }
Disclaimer: This newsletter is not trading or investment advice but for general informational purposes only. This newsletter represents my personal opinions based on proprietary research which I am sharing publicly as my personal blog. Futures, stocks, and options trading of any kind involves a lot of risk. No guarantee of any profit whatsoever is made. In fact, you may lose everything you have. So be very careful. I guarantee no profit whatsoever, You assume the entire cost and risk of any trading or investing activities you choose to undertake. You are solely responsible for making your own investment decisions. Owners/authors of this newsletter, its representatives, its principals, its moderators, and its members, are NOT registered as securities broker-dealers or investment advisors either with the U.S. Securities and Exchange Commission, CFTC, or with any other securities/regulatory authority. Consult with a registered investment advisor, broker-dealer, and/or financial advisor. By reading and using this newsletter or any of my publications, you are agreeing to these terms. Any screenshots used here are courtesy of TradingView. I am just an end user with no affiliations with them. Information and quotes shared in this blog can be 100% wrong. Markets are risky and can go to 0 at any time. Furthermore, you will not share or copy any content in this blog as it is the authors' IP. By reading this blog, you accept these terms of conditions and acknowledge I am sharing this blog as my personal trading journal, nothing more.

GOOGLE: Where are they going after earnings? Let's talk about itWHERE WILL GOOGLE GO AFTER THEY REPORT EARNINGS ON TUESDAY?!
NASDAQ:GOOG NASDAQ:GOOGL
In this video, we will review 3 key items that give us the best probability of predicting where they will go.
1⃣ See if it meets my "High Five Setup" trade strategy
2⃣ Why it's BUY according to my Valuation Metric Tool (6/6 score) I WANT A DIP!
3⃣ Look aHEAD to find out 👇
Video analysis 4/5. Stay tuned!🔔
Like ❤️ Follow 🤳 Share 🔂
Is this MAG7 name finally going to play catchup to its siblings? Drop a comment below.
Not financial advice.

GOOGLE SHORT TRADE OUTLOOK ON EARNINGS REPORT DAY OCT.29, 2024NASDAQ:GOOGL
WEEKLY FUNDAMENTAL ANALYSIS:
>P/E Ratio (Quarterly Lookback): Google's P/E is currently at around 25, signaling overvaluation (typically anything equal or above 25 is considered overvalued).
>Correlation: Both Google's P/E ratio and value compared to Treasury bonds are flashing overvalued signals.
DAILY OUTLOOK:
>Short-term and long-term value correlations vs T-bonds and P/E ratios suggest the stock may remain overbought until the upcoming earnings report, which could act as a catalyst.
>Election Year Seasonality is strongly bearish as well.
TECHNICAL INSIGHT:
>GOOG may pull back to fill a previous price gaps before slowing down.
Stay sharp, traders! 🎯 #GOOG #ShortTrade #MarketAnalysis #Investing
Disclaimer: This post is for informational and educational purposes only and should not be considered financial advice. It reflects general market fundamentals and personal speculation. Always do your own research and consult with a professional before making any financial decisions. Trade at your own risk.

Antitrust Threat Looms Over Google, Shares Could Plummet by 10%!Google's dominance might be ending. A U.S. judge has decided that the company's control over search is unfair competition. This could lead to Alphabet, Google's parent company, being split up and a major change in online advertising. A new era of search could be coming, as the internet's main player may soon lose its power.
Technical Analysis
The share price has surged by over 190% since hitting its lowest point during the Covid-19 crash.
Following a previous peak of $152, the stock experienced a significant drop and subsequently entered a prolonged phase of consolidation.
After approximately 2.5 years of this price stabilization, the stock finally broke through its prior resistance in April 2024.
This significant breakthrough resulted in an impressive surge, propelled the price to a new all-time high of $193.
However, the stock price faced considerable resistance at that level, resulted in a decline and eventually breaking down of its upward-trending parallel channel.
The stock is likely to experience a sharp decline of about 10%, finding support somewhere between $132 and $131.

GOOGLE SHORT TIMING? reached important resistance level?
we could see that it is rebounding from an overall downtrend market.
And it's closed to the resistance area of previous lows, which shares the same level with the downtrend line, double confirmed the importance of this resistance area.
So if it be rejected by this area, and start to showing sell signals like bearish engulfing pattern etc, the price may continue to drop.

$GOOGL triangle breakdown from ATHPretty simple here, the negative news catalyst has given the bears something to eat. Looking to play this short into the gap area below!!

GOOGLE $GOOG - Feb. 26th, 2024GOOGLE NASDAQ:GOOG - Feb. 26th, 2024
BUY/LONG ZONE (GREEN): $144.50 - $154.80
DO NOT TRADE/DNT ZONE (WHITE): $139.60 - $144.50
SELL/SHORT ZONE (RED): $131.15 - $139.60
Weekly: Bullish
Daily: DNT
4H: Bearish
The zone around $140 has been supported to the bullish side three times since Jan. 17th, 2024. Currently price is back at the zone after creating bearish structure on the 4h timeframe with strong downside momentum. Price has respected the level at $146.10 to the bearish side and broke below the $144.50 on the daily timeframe which is the start of the DNT zone and the potential start of entry into the bearish zone.
Bulls can look for rejections up from the $140 area or breaks above the $144 level/structure (daily timeframe). Bears can look for continuation below the $140 area or a pullback and rejection of the $144 level (daily timeframe).
This is what I would personally look at before entering trades, everything is subject to change on a daily basis and as I analyze different timeframes and ideas.
ENTERTAINMENT PURPOSES ONLY, NOT FINANCIAL ADVICE!

"Google Stock Approaches 2022 Highs"Google Stock Analysis: Testing Recent Highs and Channel Patterns for Trading Opportunities
In the dynamic world of stock trading, few companies command the attention and admiration quite like Google. With its innovative products, expansive ecosystem, and formidable market presence, Google has long been a favorite among investors seeking long-term growth opportunities. As we venture further into 2022, Google's stock is once again in the spotlight as it tests recent highs from January 1st, 2022, signaling potential opportunities for astute traders.
In recent trading sessions, Google's stock has been steadily climbing, inching closer to the levels it last reached at the beginning of the 2022. This upward momentum is notable, as it suggests renewed investor confidence and optimism in the company's prospects. Furthermore, technical analysis reveals that Google is currently stepping upward in a channel pattern, with the stock testing channel support along the way.
For traders eyeing potential opportunities in Google's stock, the current channel pattern provides valuable insights. If Google manages to maintain support within the channel, it could signal a continuation of the upward trend, presenting opportunities for long positions or holding existing positions. However, a break below channel support would warrant caution, potentially indicating a short-term reversal in momentum.
At the time of writing, one key level to watch is $143.85, which serves as a crucial point of interest within the channel. If Google's stock holds above this level, it could present an attractive entry point for traders looking to capitalize on a breakout towards the upside of the channel. A successful break through this resistance level could pave the way for further gains, with potential targets in the range of $165 to $170.
It's important to note that trading opportunities in Google's stock should be approached with caution and careful risk management. While the technical setup appears promising, market conditions can be unpredictable, and unforeseen developments could impact the stock's trajectory. Therefore, traders should consider setting stop-loss orders and closely monitoring price action to mitigate potential risks.
In conclusion, Google's stock is currently testing recent highs from the beginning of the year, with promising signs of upward momentum and a channel pattern indicating potential trading opportunities. By keeping a close eye on key support and resistance levels, traders can position themselves to capitalize on potential breakouts while managing risk effectively. As always, prudent decision-making and disciplined execution are essential for success in the dynamic world of stock trading.

GOOG Rising Wedge Here is a simple rising wedge pattern on google with bear gap resistance above you dont want to get caught guessing the top because there is no way to tell exactly when price will reverse. Just react and catch the move when it presents itself. Expect to enter after either A) Gap Down, B) intraday Head and Shoulders or C) intraday bear flags.

GOOG - Why a 25% drop Is lurking in Google StockSometimes live can be simple.
This trade is simple to me.
Let's examine it:
1. Over all Indexes are not favoring the long side.
2. Price reached the Center line and get pushed back.
3. The Divergence in the RSI is significant.
...and the rest is Risk & Money management.
My stop goes a couple points above the last high.
But I probably play it with Options and give me at least 100 days to expiry (DTE).
Simple enough? §8-)
Happy trading folks.
