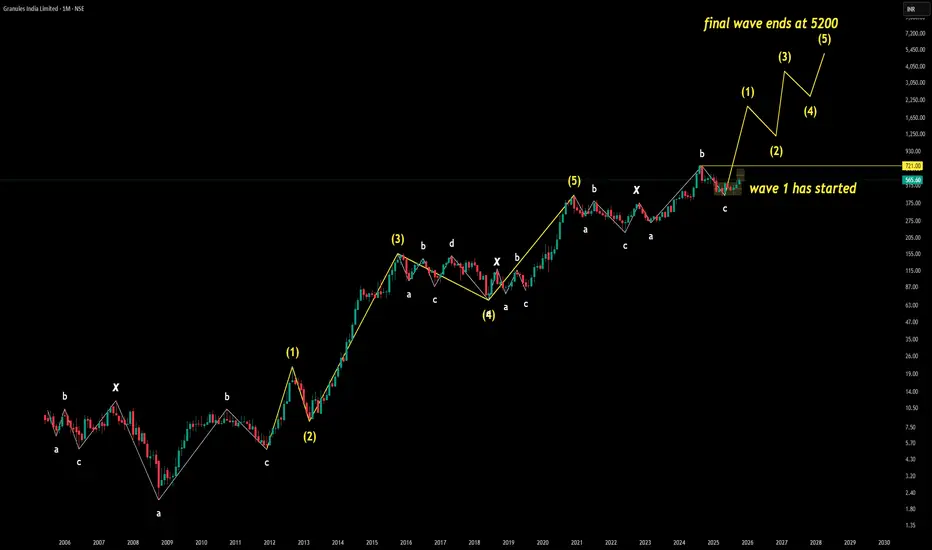
Multiple Elliott Wave phases from the early 1990s to the presentThis long-term chart captures
Completed Waves
Impulse Waves: (1) → (5)
Corrective Waves: A → B → C
Complex correction: W → X → Y → X → Z
Structure confirms multi-decade wave symmetry and consolidation behavior
Current Setup
Wave 1 of the next major cycle has started
Final wave projection ends at 5200
Analyst Learning Takeaways
Complex corrections (W–X–Y–X–Z) often precede strong impulsive moves
Wave 1 initiation after prolonged correction signals trend reversal
Final wave targets are often derived from prior impulse symmetry and Fibonacci extensions
Analyst View The asset has completed a multi-decade corrective structure, including a rare W–X–Y–X–Z pattern, which typically marks the end of a prolonged consolidation phase. The initiation of Wave 1 suggests a fresh impulsive cycle is underway. Based on historical symmetry and proportional wave logic, the final wave is projected to end near 5200. This projection assumes Wave 2 will form a healthy base without breaching the origin of Wave 1. Traders should monitor early Wave 2 behavior for confirmation of cycle strength. If Wave 1 sustains momentum and Wave 2 holds structurally, the path to 5200 becomes technically viable.
Granulesview
GRANULES--@Channel Breakdown??this stock is trading in a channel..
now price is at resistance zone...
look for short side if price breaks and retest for the support areas.
we have support lies at 365 zone.

GRANULES - Stock AnalysisSymbol: GRANULES
Close: 387.2
Today's Volume: 7834685
Sector: Pharmaceuticals
Go Long above: 390
Stop Loss: 338
Resistance & Support:
📉 R: 394 || 402 || 413
📈 S: 376 || 364 || 357
