Grasim Industries Ltd for 28th Oct #GRASIM Grasim Industries Ltd for 28th Oct #GRASIM
Resistance 2940-2950 Watching above 2952 for upside momentum.
Support area 2900 Below 2920 gnoring upside momentum for intraday
Watching below 2897 for downside movement...
Above 2930 ignoring downside move for intraday
Charts for Educational purposes only.
Please follow strict stop loss and risk reward if you follow the level.
Thanks,
V Trade Point
GRASIM

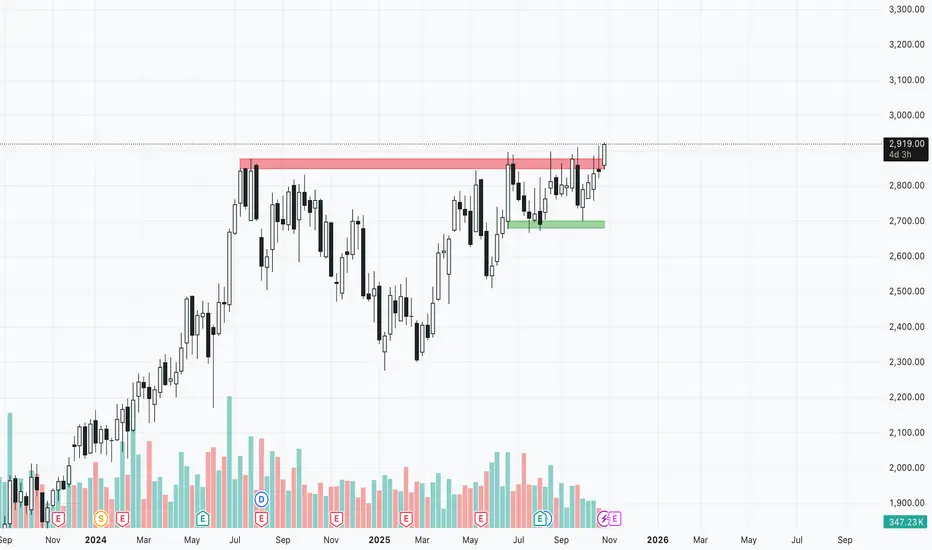
GRASIM - Weekly Breakout?Chart Analysis :
Price sustaining and breaking out above its major resistance of 2895-2910 zone. Price made a long consolidation of 67 weeks/ 15months and now breaking out.
Daily close above 2910-2920 will confirm breakout and can be considered for long.
Key Levels:
Entry level : Above 2920
Targets : 3000 psychologically imp level can move more if breaks out above 3000 (Trailing with day low SL post breakout is the suggested strategy)
StopLoss : Day close below 2820
Disclaimer:
I am not SEBI registered. This analysis is for educational purposes only and not investment advice. Please do your own research before trading or investing.
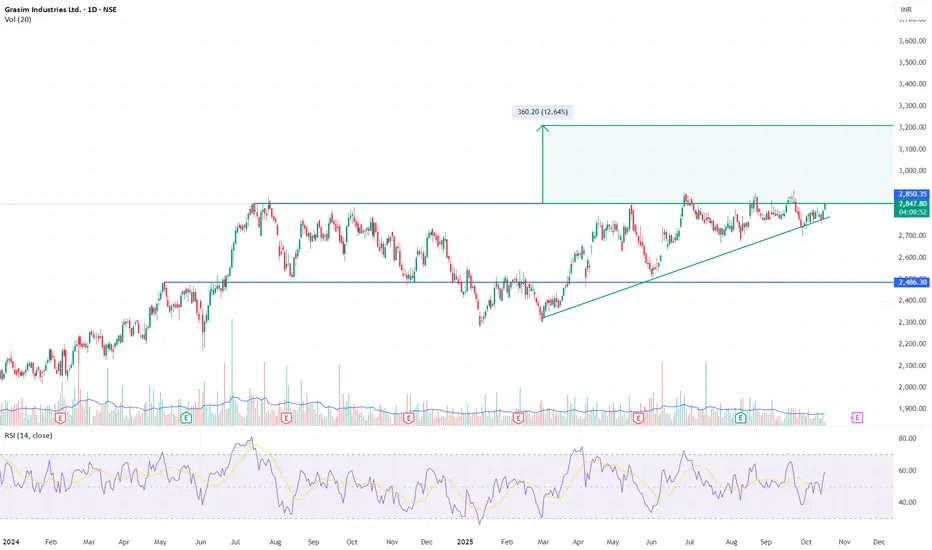
GRASIM – Base Pressure Building for Breakout Above ₹2,850Price has spent almost a year trapped between ₹2,480 and ₹2,850. Each dip since mid-2025 has formed higher lows, compressing against the same horizontal ceiling. Today’s candle closes right at ₹2,850 with RSI rising toward 60 — the structure is tightening for resolution.
A decisive close above ₹2,900 with strong volume will confirm breakout and open the path toward ₹3,200–₹3,250 (~12–13% measured move).
Setup: Ascending Triangle re-attempt
Entry Trigger: ₹2,900+ close with volume confirmation
Target Zone: ₹3,200–₹3,250
Support: ₹2,700
Invalidation: ₹2,680
Price has respected this structure for nearly a year; compression is mature, volatility contraction visible, and the next move should define direction.
Disclaimer: Not a recommendation. For educational purposes only.
GRASIMNSE:GRASIM
Note :
1. One should go long with a Stop Loss, below the Trendline or the Previous Swing Low.
2. Risk :Reward ratio should be minimum 1:2.
3. Plan your trade as per the Money Management and Risk Appetite.
Disclaimer :
>You are responsible for your profits and loss.
>The idea shared here is purely for Educational purpose.
>Follow back, for more ideas and their notifications on your email.
>Support and Like incase the idea works for you.

H&S breakdown in GRASIMNSE:GRASIM hourly chart shows head and shoulder breakdown in hourly chart. Most H&S breakdowns are followed by retest so chances are there would be an attempt to reclaim the neckline resistance.

GRASIM - Educational purposeGRASIM - Trade analysis,
Price moving upside by making Higher Highs and Higher lows, over all trend is positive and in the near recent days in daily time frame made triangle pattern. over all expected price will move upside.

GRASIM: Awaiting Bullish Breakout with Key Resistance Levels
Bullish breakout expected above ₹2,781.25
Upside target: ₹2,866.55

Grasim Weekly TF Breakout First Resistance -- 2709.6
Second Resistance --- 2734.3
Third Resistance --- 2776.5
First Support --- 2642.7
Second Support --- 2600.5
Third Support --- 2575.8
Positional long
Daily Avg. Delivery Volume %
21 Aug, 2024
68.0%
Week
56.5%
Month
59.0%

profit booking time in Grasim?
Grasim seems to have reached its current swing high. i think we should book profit and wait for retracements for reentry.

Grasim Industries: Bullish Flag BreakoutGrasim Industries has formed a bullish flag pattern on the daily chart, signaling a strong continuation of the uptrend. The recent breakout is supported by high trading volume, which adds to the reliability of this pattern. Traders should watch for further upward movement as the bullish momentum continues. Proper risk management is advised, with attention to potential support levels below the breakout point. Stay tuned for updates as we monitor this promising setup.

Grasim Industries Hits New Heights: A Breakout to WatchGrasim Industries showcases a robust ascent, adhering closely to its ascending trendline and breaking past a crucial resistance point. The stock now trades in a potential consolidation zone, suggesting a decision point for investors. With a strong bullish trend and increased volume indicating sustained interest, investors should monitor for signs of a continuation towards the ₹2,650 resistance. This phase could be pivotal in determining the next strategic moves in Grasim's stock trajectory.

Grasim - Potential UpsideLTP on NSE on 23/Feb/2024 was INR 2,190/- (with a high of INR 2,236.70 and a low of INR 2,182.60)
Although it is a good buy at current levels, conservatively I would still accumulate it around INR 2,060/- - 2,080/- zone.
Resultantly after all this discussion, I believe that the target price should be:
first INR 2,370/- and
second INR 2,900/-.
Stop Loss should be INR 2,040/-
Risk to Reward will be 1:5
The time horizon should be 12-15 months

Grasim trade setupBroadning decending wedge is a bullish pattern
2 probabilities, one is beariah as we can see a divergence in RSI. Second one is bullish as this pattern is a bullish pattern.
Once the wedge is broken upside we get to see those targets .. or if it continues in the range we get to see the bottom support line as target but remember if it continues downside and did not break the lower low get ready for a breakout.

GRASIMNSE:GRASIM
One Can Enter Now ! Or Wait for Retest of the Trendline (BO) Or wait For better R:R ratio
Note :
1.One Can Go long with a Strict SL below the Trendline or Swing Low of Daily Candle.
2. Close, should be good and Clean.
3. R:R ratio should be 1 :2 minimum
4. Plan as per your RISK appetite
Disclaimer : You are responsible for your Profits and loss, Shared for Educational purpose

Swing Trade - GRASIM📊 Script: GRASIM
📊 Sector: Textiles
📊 Industry: Textiles - Manmade
Key highlights: 💡⚡
📈 Script is trading at upper band of BB and giving breakout of it.
📈 MACD is giving crossover .
📈 Double Moving Averages are giving Crossover.
📈 Right now RSI is around 62.
📈 One can go for Swing Trade.
⏱️ C.M.P 📑💰- 2287
🟢 Target 🎯🏆 - 2410
⚠️ Stoploss ☠️🚫 - 2241
⚠️ Important: Always maintain your Risk & Reward Ratio.
✅Like and follow to never miss a new idea!✅
Disclaimer: I am not SEBI Registered Advisor. My posts are purely for training and educational purposes.
Eat🍜 Sleep😴 TradingView📈 Repeat 🔁
Happy learning with trading. Cheers!🥂

GRASIM SETUP The stock is coming out of consolidation and is expected to make a top around 2150-2300 levels as per the expectation and may correct too after completing the technical pattern. It is making an entry into paint business which can give some boost as things are speeding up. However a strict sl is recommended as per the market conditions

GRASIM--Demand ZoneA strong demand zone is created in this stock from 2060 levels,
immeditely sellers push the price downwards,now from demand zone price is moving upside,
if this demand breaks then price test the demand zone at 1960 levels.
so keep look for shortside in this stock.find short oppurtunities in this stock.
Drop base drop chances are more.


Grasim -- Cup & handle and flag Grasim after good consolidation today grasim gived 3.4% up move maybe more upside moment still pending...
Technical ::-------
1) Cup and handle pattern
2) bullish flag
3) volume also good
up side target 1842 / 1933

Grasim - Elliott Wave CountGrasim- Elliott Wave Count
It appears that the market correction for Grasim has come to an end, and we can anticipate another upward impulse wave, provided that this week's low remains stable. However, if the market falls below 1828, this view will no longer be applicable.
Please note that this information is for educational purposes only, and it is crucial to trade with caution.
BSE:GRASIM NSE:GRASIM1! NSE:GRASIM

Grasim - Elliott Wave CountGrasim - Elliott Wave Count
It appears that the market correction for Grasim has come to an end, and we can anticipate another upward impulse wave, provided that today's low remains stable. However, if the market falls below the current low, this view will no longer be applicable.
Please note that this information is for educational purposes only, and it is crucial to trade with caution.
NSE:GRASIM NSE:GRASIM1! BSE:GRASIM

GRASIM Trade set up1. Market Trend - Bullish
2. Stock Trend - Bullish
3. Market & Stock both at ATH
4. Breakout - Strong

Grasim Monthly chart near breakoutWait for a breakout on monthly chart.
Looks like supply is being absorbed.
