GRT Looks Bullish (4H)The price has made deep drops, and it appears that market makers have collected sufficient liquidity to change the trend.
After the drops, the price ranged at the bottom for a period, which seems to have been sufficient as an accumulation phase for an upward move on the hourly timeframe. Market makers also appear to have filled their orders.
The mid-term bearish trendline has been broken. The bearish C wave appears to be a diametric and has already ended. A proper pullback to the broken trendline has not yet occurred. A pullback is expected soon, after which the price is expected to enter the C wave.
We have marked two entry points on the chart where positions should be entered using a DCA approach. Targets have been specified on the chart.
A daily candle close below the invalidation level will invalidate this analysis.
Trading is not hard or complicated if you have a professional coach.
If you have a coin or altcoin you want analyzed, first hit the like button and then comment its name so I can review it for you.
This is not a trade setup, as it has no precise stop-loss, stop, or target. I do not publish my trade setups here.
Grtanalysis

GRT/USDT — On the Edge of Collapse or Start of a Major Reversal?GRT is currently sitting at a critical decision zone, a historical support area that has served as a strong price floor since 2022. After a long and exhausting downtrend, the weekly candle has once again reached the key demand zone at $0.0661 – $0.051, with a deep wick extending down to $0.03 — a classic sign of a liquidity sweep that could mark the beginning of a major accumulation phase.
---
🔹 Market Structure and Pattern
On the macro scale, GRT remains in a bearish trend, forming a consistent pattern of lower highs and lower lows since its 2021 peak. However, this phase is now showing early signs of potential bottom formation in the same demand zone that triggered a strong rally back in mid-2023.
The long wick to the downside indicates market capitulation — a point where many traders panic sell, while larger players quietly start accumulating positions. If the weekly candle closes above this yellow zone, the probability of a macro reversal begins to rise.
---
🟢 Bullish Scenario – Rebound from the Depths
Initial confirmation: Weekly close above $0.055 – $0.06.
First upside target: $0.125 (local resistance and weekly pivot).
A break above $0.125 opens the door to the next targets:
$0.18695 → $0.32369 → $0.43378 → $0.52727 → $1.0568
Expected structure: Higher Low + Break of Structure (BoS) on the weekly timeframe.
Strong momentum in this zone could signal the beginning of a re-accumulation phase before the next bullish cycle.
---
🔴 Bearish Scenario – If the Support Gives Way
If the weekly close falls below $0.051, GRT could enter another phase of distribution.
A failed retest at $0.0661 would strengthen the bearish signal, targeting $0.03 or lower.
The structure remains bearish until a valid higher high forms on the weekly timeframe.
This could also represent the final capitulation leg before a true long-term reversal begins.
---
⚖️ Conclusion
GRT is currently positioned at a decisive crossroads — will this become “the final dip before reversal,” or the continuation of pain?
The reaction within this zone will determine the macro structure for 2025.
As long as the $0.0661–$0.051 area holds, a rebound remains highly possible.
However, a weekly close below this zone will confirm a deeper bearish continuation and delay recovery for a longer period.
---
#GRTUSDT #GRT #TheGraph #CryptoTA #PriceAction #SupportResistance #ReversalZone #CryptoTrading #MarketStructure #SwingTrade #CryptoChart

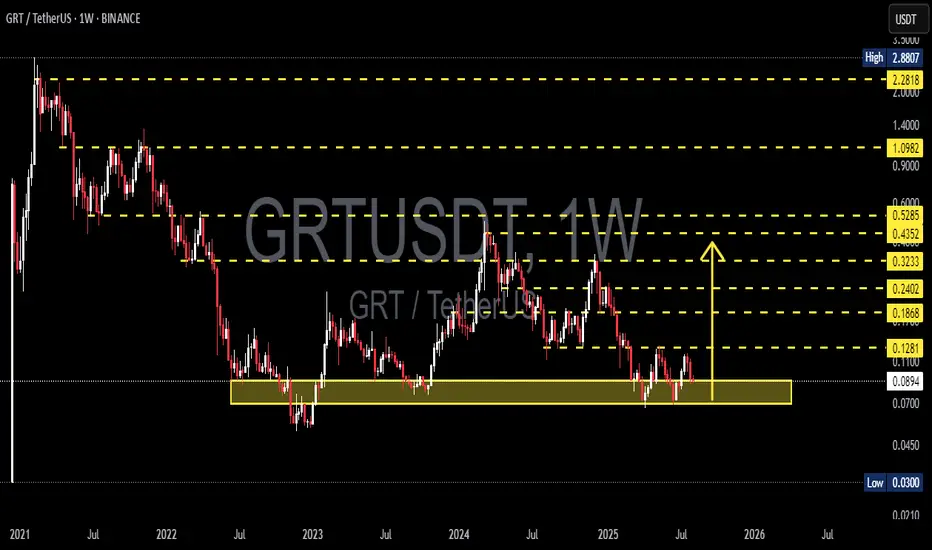
GRT/USDT — Accumulation Zone or Bearish Continuation?GRT/USDT is once again retesting the historical support zone (0.047–0.095), an area that has acted as a major demand level since 2022. This zone can be considered the “final wall” before a potential continuation of the long-term downtrend — or the foundation for a multi-year accumulation base.
The long-term structure still shows a series of lower highs since the 2021 peak, reflecting strong selling pressure. However, the fact that this yellow zone has held for nearly 3 years signals possible institutional demand or smart retail accumulation.
If this zone holds, the probability of a major reversal increases, especially if supported by strong weekly volume.
---
📈 Bullish Scenario
1. Rebound from accumulation zone: If price holds above 0.082 and forms a strong reversal candle (hammer / bullish engulfing), the first target is 0.1281.
2. Confirmed breakout: A weekly close above 0.1281 would shift structure bullish, opening upside targets at 0.1868 → 0.2402 → 0.3233.
3. Extended rally: If the broader crypto market supports, the price could extend toward 0.4352 – 0.5285, with long-term potential toward 1.0982.
---
📉 Bearish Scenario
1. Support breakdown: A weekly close below 0.047 would invalidate the accumulation zone, confirming further downside.
2. Bearish continuation: Next liquidity levels may lie around 0.03 – 0.02 or potentially new lows.
3. High selling volume: If breakdown occurs with strong bearish volume, chances of a quick recovery diminish significantly.
---
📊 Technical Pattern
Accumulation zone (yellow box): Major demand area since 2022.
Range-bound movement: Trading between 0.047 (bottom) and 0.128 (top).
Lower highs: Sellers remain in control, yet buyers repeatedly step in around 0.05–0.08.
Potential large double/triple bottom: If support holds, this could form a strong long-term reversal structure.
---
🎯 Trading Plan & Risk Management
Aggressive setup (risk-takers): Buy within 0.055–0.082 with a stop below 0.047. First target 0.1281 (R:R ≈ 1:1.7), extended targets up to 0.2402 (R:R > 5).
Conservative setup (trend-followers): Wait for a weekly breakout above 0.1281 with strong volume confirmation, then aim for 0.1868 – 0.2402.
Risk note: Since the support box is wide, use small position sizing to avoid large drawdowns.
---
📌 Conclusion
GRT is at a multi-year critical level. The 0.047–0.095 zone is decisive for long-term direction:
If it holds → strong chance of a major reversal and accumulation base.
If it breaks down → high probability of deeper continuation of the bearish trend.
Swing traders may look for bounces within the range, while long-term investors should closely monitor weekly closes and volume before committing.
---
#GRT #GRTUSDT #TheGraph #CryptoAnalysis #CryptoTrading #SupportResistance #AltcoinAnalysis #CryptoSwing #TechnicalAnalysis

GRT/USDT Weekly Analysis — “Life or Death Zone” for The Graph!🟡 🔥 Critical Zone: Demand Area in Play!
The Graph (GRT) is retesting one of its most critical historical demand zones — the $0.0700 to $0.0897 area — a level that has acted as strong support multiple times since mid-2022.
> This zone is not just a support — it’s a make-or-break level that has defined the survival of the GRT trend on the higher timeframes.
The current price action shows hesitation, low volatility, and potential accumulation — all classic signs that a major move is brewing.
---
📊 Technical Structure & Price Behavior
GRT has been trading in a wide sideways channel after a long-term downtrend, with multiple bounce attempts off this demand zone.
No higher highs have been confirmed since the last rally towards $0.24.
Volume appears to be declining, indicating compression before expansion.
Price has failed to break and sustain above key resistance levels, hinting that buyers are cautious — or waiting for macro confirmation.
---
🐂 Bullish Scenario: Accumulation & Breakout Potential
If buyers continue to defend the $0.0700–$0.0897 zone, and GRT can break above short-term resistance at $0.1281, this could confirm a reversal structure or at least a mid-term relief rally.
🎯 Potential Bullish Targets:
1. $0.1281 – minor local resistance
2. $0.1868 – structural breakout level
3. $0.2402 – previous rejection zone
4. $0.3233 – historical supply
5. $0.4352 & $0.5285 – macro targets if momentum builds
> A breakout above $0.1868 with volume could kickstart a trend reversal towards the $0.30–$0.50 region.
---
🐻 Bearish Scenario: Breakdown Below Demand
However, if GRT loses the $0.0700 key support, this would invalidate the accumulation thesis and potentially trigger panic selling.
⚠️ Bearish Breakdown Targets:
$0.0450 – intermediate support
$0.0300 – all-time low and last line of defense
> A breakdown would likely signal a return to macro bearish sentiment and a reset of the entire structure.
---
🔄 Market Psychology: The Calm Before the Storm?
We are in a classic zone of indecision, where both bulls and bears are waiting for a confirmation. This setup is often followed by high-volatility breakout or breakdown moves.
Traders and investors alike should be watching this area very closely.
---
📌 Strategic Summary:
Strategy Type Action
Long-term Investors Accumulation with strict stop below $0.0700
Swing Traders Wait for breakout of $0.1281 with confirmation
Risk-Averse Traders Avoid until direction is clear above $0.1868 or below $0.0700
#GRT #GRTUSDT #CryptoAnalysis #AltcoinUpdate #TechnicalAnalysis #SupportAndResistance #CryptoBreakout #DemandZone #AltcoinWatchlist #CryptoReversal #TheGraph
GRT/USDT at a Critical Point! Reversal Structure or Breakdown?📊 Full Technical Analysis – GRT/USDT (1W Timeframe)
🔎 Overview:
GRT is currently positioned at one of the most critical technical levels in its long-term structure. After a prolonged downtrend from the $2.88 all-time high, price is once again testing the historical demand zone between $0.07 – $0.09, which has repeatedly acted as a strong support level since mid-2022. This area represents a major accumulation zone, where smart money may be silently positioning.
🧠 Structure & Pattern Formation:
✅ Historical Demand Zone (Major Support Area):
The $0.07 – $0.09 range has been tested over 5 times in the last 2 years, showing strong demand.
This zone also acts as the potential base of a double bottom pattern, indicating a possible macro reversal.
🟡 Double Bottom Potential (Reversal Pattern):
Two nearly equal lows forming around this demand area hint at a classic double bottom formation.
Confirmation comes if price breaks and holds above $0.1281 resistance.
🔻 Declining Selling Pressure:
Sellers appear to be losing momentum, as seen in the declining weekly volume.
This could signal distribution is ending and accumulation is underway.
📈 Bullish Scenario:
If GRT holds this critical support and breaks above key resistance, a strong mid-term rally may follow:
1. Breakout Confirmation:
Valid if the weekly candle closes above $0.1281.
2. Upside Targets (Fibonacci + Historical Resistance):
🎯 $0.1868 → minor resistance / past consolidation zone.
🎯 $0.2402 → previous rejection area.
🎯 $0.3233 → key Fibonacci retracement level.
🎯 $0.4352 → strong horizontal resistance.
🎯 $0.5285 → mid-term bullish target.
3. Ideal Bullish Conditions:
Bullish divergence on the weekly RSI.
Increasing volume on breakout confirmation.
📉 Bearish Scenario:
If the support fails to hold, GRT could face further downside:
1. Breakdown Below $0.07 – $0.09 Zone:
⚠️ $0.0550 → minor support.
⚠️ $0.0300 → All-Time Low and psychological support.
2. Deeper Risk:
If panic selling occurs or broader market sentiment worsens, GRT may print new lows, continuing its long-term bearish trend.
🧭 Conclusion & Strategy:
> GRT is in a highly interesting accumulation phase from a technical perspective.
The risk-to-reward from this support zone is attractive, with signs of a potential reversal building. However, traders should wait for confirmation and always use proper risk management.
Entry Strategy:
Speculative entry: inside the $0.08–$0.09 zone (tight stop-loss below $0.07).
Confirmed entry: after breakout and weekly close above $0.1281 (targeting levels mentioned above).
#GRT #TheGraph #GRTUSDT #CryptoReversal #DoubleBottom #SupportZone #AltcoinSetup #BullishCrypto #BearishRisk #TechnicalAnalysis

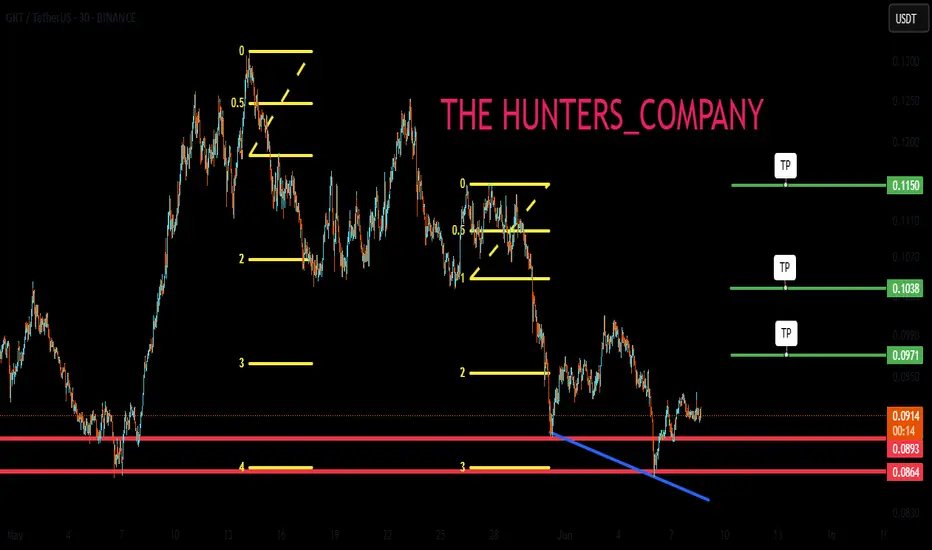
Maintaining support is necessary, not essential, for the climb.Hello friends🙌
🔊Given the price drop, you can see that the support we identified has worked well for you so far and buyers have supported the price.
Now, given the heavy price drop and disappointment in the market, we can expect a rise until the targets are set.
Don't forget capital and risk management, friends.🙏
🔥Join us for more signals🔥
*Trade safely with us*
GRTUSDT 1D AnalysisGRT ~ 1D Analysis
#GRT On the 1D time frame the selling pressure has stopped.. Buy on this support block with a short term target of at least 10%+ from here.

GRT Analysis (12H)From the point where we placed the red arrow on the chart, it seems that a large-degree triangle on the GRT chart has completed, and we are now in a new wave sequence.
In these new downward waves, wave A/W has completed, and it now appears we are in the middle of wave B/X.
We are looking for a rebuy opportunity around the green zone.
It is expected that during the middle of wave B/X, there will be a correction down toward the green zone, followed by an upward move to continue wave B/X.
A daily candle closing below the invalidation level will invalidate this analysis.
For risk management, please don't forget stop loss and capital management
Comment if you have any questions
Thank You

GRT Long Spot OpportunityMarket Context:
GRT has retraced to a key support zone and is presenting a potential bounce-back opportunity for a long position.
Trade Details:
Entry Zone: $0.125 - $0.14
Take Profit Targets:
$0.18 - $0.20
$0.2350 - $0.2550
Stop Loss: Just below $0.12
This setup offers a solid risk-to-reward ratio if the support holds. Watch for any price reaction at this level! 📈

WILL #GRT MAKE IT!!!
Currently #GRT is facing a resistance which was previously strong support of descending triangle.
#grtusdt needs to break above this resistance, then we can probably see rally up to 0.5$ region after breaking out resistance of previously formed descending triangle.
In case of any further dip, we can see #grt heading towards its major support region.

#GRT (SPOT) entry (0.1700- 0.2100)T.(0.8300) SL(0.1666)BINANCE:GRTUSDT
#GRT / USDT
Entry ( 0.1700- 0.2100)
SL 1D close below 0.1666
T1 0.2600
T2 0.3800
T3 0.8300
______________________________________________________________
Golden Advices.
********************
* collect the coin slowly in the entry range.
* Please calculate your losses before the entry.
* Do not enter any trade you find it not suitable for you.
* No FOMO - No Rush , it is a long journey.
Useful Tags.
****************
My total posts
www.tradingview.com
1Million Journey
www.tradingview.com
www.tradingview.com
**********************************************************************************************
#Manta #OMNI #DYM #AI #IO #XAI #ACE #NFP #RAD #WLD #ORDI #BLUR #SUI #VOXEL #AEVO #VITE #APE #RDNT #FLUX #NMR #VANRY #TRB #HBAR #DGB #XEC #ERN #ALT #IO #ACA #HIVE #ASTR #ARDR #PIXEL #LTO #AERGO #SCRT #ATA #HOOK #FLOW #KSM #HFT #MINA #DATA #SC #JOE #RDNT #IQ #CFX #BICO #CTSI #KMD #FXS #DEGO #FORTH #AST #PORTAL #CYBER #RIF #ENJ #ZIL #APT #GALA #STEEM #ONE #LINK #NTRN #COTI #RENDER #ICX #IMX #ALICE #PYR #PORTAL #GRT #GMT #IDEX #NEAR #ICP #ETH #QTUM #VET #QNT #API3 #BURGER #MOVR #SKL #BAND #ETHFI #SAND #IOTX #T #GTC #PDA #GMX #REZ #DUSK #BNX #SPELL #POWR #JOE #TIA #TFUEL

#GRT (SPOT) entry range( 0.1360- 0.1660)T.(0.3860) SL(0.1259)BINANCE:GRTUSDT
entry range ( 0.1360- 0.1660)
Target1 (0.2320) - Target2 (0.2890)- Target3 (0.3860)
SL .1D close below (0.1259)
*** collect the coin slowly in the entry range ***
*** No FOMO - No Rush , it is a long journey ***
**** #Manta ,#OMNI, #DYM, #AI, #IO, #XAI , #ACE #NFP #RAD #WLD #ORDI #BLUR #SUI #Voxel #AEVO #VITE #APE #RDNT #FLUX #NMR #VANRY #TRB #HBAR #DGB #XEC #ERN #ALT #IO #ACA #HIVE #ASTR #ARDR #PIXEL #LTO #AERGO #SCRT #ATA #HOOK #FLOW #KSM #HFT #MINA #DATA #SC #JOE #RDNT #IQ #CFX #BICO #CTSI #KMD #FXS #DEGO #FORTH # AST #PORTAL #CYBER #RIF #ENJ #ZIL #APT #GALA #STEEM #ONE #LINK #NTRN #COTI #RENDER #ICX #IMX #ALICE #PYR #PORTAL #GRT ***

TheGraph Protocol- The Graph Protocol is a decentralized indexing protocol for querying blockchain data. It allows developers to efficiently access and retrieve data from blockchains like Ethereum without building complex data-fetching solutions.
- When GRT was introduced, it was often referred to as the "Google of the Blockchain" due to its role in efficiently indexing and querying blockchain data, much like how Google organizes and retrieves data from the web.
- So, GRT is bullish like most altcoins but lagging. It needs to break out of this Yellow triangle to confirm upward momentum.
----------------------------------------------------------------------------------------------
Trading Part
----------------------------------------------------------------------------------------------
- Buy a breakout after 0.3$ ( and wait weekly candle confirmation )
- Wait for a dip and buy 0.15$-0.14$ (30% invest)
- full invest (add 70%) 0.05$
----------------------------------------------------------------------------------------------
Take profits
----------------------------------------------------------------------------------------------
- TP1 : 0.3$
- TP2 : 0.5$
- TP3 : ATH
----------------------------------------------------------------------------------------------
Long Term Bull Run TP : 7.5$ - 10$ Max
----------------------------------------------------------------------------------------------
Happy Tr4Ding !

#GRT/USDT#GRT
The price is moving in a descending channel on the 4-hour frame
And it is sticking to it well
We have a bounce from the lower limit of the descending channel and we are now touching this support at the price of 1470
We have an upward trend on the RSI indicator that is about to be broken, which supports the rise
We have a trend to stabilize above the moving average 100
Entry price 0.1600
First target 0.1900
Second target 0.2124
Third target 0.2510

#PORTAL (SPOT) entry range( 0.1360- 0.1660)T.(0.3860) SL(0.1259)BINANCE:GRTUSDT
entry range ( 0.1360- 0.1660)
Target1 (0.2320) - Target2 (0.2890)- Target3 (0.3860)
SL .1D close below (0.1259)
*** collect the coin slowly in the entry range ***
*** No FOMO - No Rush , it is a long journey ***
**** #Manta ,#OMNI, #DYM, #AI, #IO, #XAI , #ACE #NFP #RAD #WLD #ORDI #BLUR #SUI #Voxel #AEVO #VITE #APE #RDNT #FLUX #NMR #VANRY #TRB #HBAR #DGB #XEC #ERN #ALT #IO #ACA #HIVE #ASTR #ARDR #PIXEL #LTO #AERGO #SCRT #ATA #HOOK #FLOW #KSM #HFT #MINA #DATA #SC #JOE #RDNT #IQ #CFX #BICO #CTSI #KMD #FXS #DEGO #FORTH # AST #PORTAL #CYBER #RIF #ENJ #ZIL #APT #GALA #STEEM #ONE #LINK #NTRN #COTI #RENDER #ICX #IMX #ALICE #PYR #PORTAL #GRT ***

GRT potential long term targetsGRT / USDT
We are still in the same cycle since beginning of 2023 with macro bull market HH and HL structure intact
Whats next ?
Here i can see a high potential upside movement from around current prices(HL) to produce a new HH ,The most important resistances are highlighted
Best of wishes

GRT got a Rocket in its Pocket....GRT headed to 0.52 with ease. BTC is gonna bounce from a low of 68k if there is a dip. HODL.
BTC to 94k. GRT to 0.80 after the whales enter.
GRT used for metrics on too many platforms like UniSwap, Coin Gecko, etc... not to be worth 1.00.
Happy Gains... Leggo BULLS!
Follow for more signals....
-Jasdacylon91

GRT: sell high channel📊Analysis by AhmadArz:
🔍Entry: 0.442
🛑Stop Loss: 0.459
🎯Take Profit: 0.427 -0.410 -0.398
🔗"Uncover new opportunities in the world of cryptocurrencies with AhmadArz.
💡Join us on TradingView and expand your investment knowledge with our five years of experience in financial markets."
🚀Please boost and💬 comment to share your thoughts with us!

GRTUSDT.1DBased on the given market data, the cryptocurrency GRT is currently trading at 0.1724 USDT. The Relative Strength Index (RSI) values indicate that the currency is neither overbought nor oversold in any of the time frames, suggesting a neutral market sentiment.
In the 4-hour time frame, the Moving Average Convergence Divergence (MACD) is slightly positive, suggesting a weak bullish trend. However, the price is below the Bollinger Band (BB) midline, indicating bearish pressure. The immediate support and resistance levels are at 0.1632 and 0.1974, respectively.
In the 1-day and 7-day time frames, the MACD values are positive, suggesting a bullish trend. However, the price is below the BB midline in both time frames, suggesting that bearish pressure still exists. The support levels are lower in these time frames, indicating potential downside risks.
In conclusion, GRT seems to have mixed signals with slight bullish indications from the MACD values but bearish pressure from the BB values. It is crucial to watch out for the mentioned support and resistance levels. As always, it's recommended to consider other factors and your risk tolerance before making an investment decision. Please note that trading cryptocurrencies involves risk, and you should only invest what you can afford to lose.

Go to reverse zone(GRT)❤️❤️Thanks for boosting 🚀 and supporting us!
📈And in bull-tend come to reverse zone.
📊 (Entry) : 0.2052
🔴 Stop Loss : 0.2211
🎯 Take Profit : 0.1887-0.1778-0.1640-0.1467
🔗 For more communication with us, In the footnote and send a message in TradingView.
👨🎓 Experience and Education: Our trading team has five years of experience in financial markets, especially cryptocurrencies.

Long GRT - The GraphNo clue what these people do, longing here. Up a bunch already. Not advise, good luck :)

GRTUSDTThe current situation of BINANCE:GRTUSDT (Graph Token) is as follows:
A few days ago, we witnessed an unsuccessful breakout that led to a price decline up to this point. There has been a downtrend lasting for more than 150 days, but fortunately, we also have a supportive trend line with two strong supports.
we have a change of character from a downtrend to an uptrend, and we can confirm this with higher pivots that have been formed. However, this doesn't necessarily imply a reason for the price to go up.
In my opinion, a price of 0.105 could be a reasonable buying price with the target of retesting the downtrend line.
⚠️"Daily crypto market analyses I provide are personal opinions & not financial advice. Trading carries risks, so do your own research & seek advisor's help."
Don't forget to like and comment

GRT target 128%4h time frame
-
GRT creating a potential triangle
Not a good time to enter now
Better to wait it completes breakout and retest
Stay prepared!
