GRT/USDT – Descending Trendline, Breakout or Rejection?🔍 Market Structure & General Condition
On the Daily (1D) timeframe, GRT/USDT remains in a clear bearish market structure, characterized by:
Consistent Lower Highs and Lower Lows
Price trading below a descending trendline (yellow line)
Sellers still controlling the market despite a short-term rebound
The descending trendline acts as a major dynamic resistance, rejecting price multiple times in the past.
---
📐 Technical Pattern Explanation
🔻 Descending Trendline / Bearish Trend Structure
The yellow diagonal line represents a valid descending trendline formed from previous swing highs.
As long as price fails to break and close above this trendline, the overall bias remains bearish.
The current upward movement is still considered a pullback within a downtrend, not a confirmed trend reversal.
---
🟡 Key Support & Resistance Levels
Resistance Zones (Supply Areas):
0.04530 – 0.04800 → nearest resistance & rejection zone
0.05234
0.06050
0.06950
0.07950 – 0.08650
0.10120 – 0.10440 (major resistance / range high)
Support Zones (Demand Areas):
0.04322 (current minor support)
0.03800
0.03450
0.03000 → major low / strong demand zone
---
🚀 Bullish Scenario
The bullish scenario becomes valid only with confirmation:
1. Price breaks and closes above the descending trendline
2. Supported by increasing volume
3. Price holds above 0.04530 – 0.04800
🎯 Bullish Upside Targets:
0.05234
0.06050
0.06950
0.07950
0.08650
➡️ A confirmed breakout would signal a medium-term trend reversal from bearish to bullish.
---
🐻 Bearish Scenario
The bearish scenario remains dominant if:
1. Price gets rejected at the trendline
2. Bearish candles appear around 0.045 – 0.048
3. Price breaks below 0.04322
🎯 Bearish Downside Targets:
0.03800
0.03450
0.03000 (strong support & major demand zone)
➡️ A breakdown below 0.03000 could open the door for further bearish continuation.
---
🧠 Conclusion
Primary Trend: BEARISH
Price is currently at a critical decision zone
No confirmed trend reversal yet
Best approach: wait for breakout or breakdown confirmation
#GRT #GRTUSDT #CryptoAnalysis #TechnicalAnalysis #Altcoin #Downtrend #Trendline #BearishMarket #BullishBreakout #SupportResistance
Grtusdtanalysis

GRT/USDT — On the Edge of Collapse or Start of a Major Reversal?GRT is currently sitting at a critical decision zone, a historical support area that has served as a strong price floor since 2022. After a long and exhausting downtrend, the weekly candle has once again reached the key demand zone at $0.0661 – $0.051, with a deep wick extending down to $0.03 — a classic sign of a liquidity sweep that could mark the beginning of a major accumulation phase.
---
🔹 Market Structure and Pattern
On the macro scale, GRT remains in a bearish trend, forming a consistent pattern of lower highs and lower lows since its 2021 peak. However, this phase is now showing early signs of potential bottom formation in the same demand zone that triggered a strong rally back in mid-2023.
The long wick to the downside indicates market capitulation — a point where many traders panic sell, while larger players quietly start accumulating positions. If the weekly candle closes above this yellow zone, the probability of a macro reversal begins to rise.
---
🟢 Bullish Scenario – Rebound from the Depths
Initial confirmation: Weekly close above $0.055 – $0.06.
First upside target: $0.125 (local resistance and weekly pivot).
A break above $0.125 opens the door to the next targets:
$0.18695 → $0.32369 → $0.43378 → $0.52727 → $1.0568
Expected structure: Higher Low + Break of Structure (BoS) on the weekly timeframe.
Strong momentum in this zone could signal the beginning of a re-accumulation phase before the next bullish cycle.
---
🔴 Bearish Scenario – If the Support Gives Way
If the weekly close falls below $0.051, GRT could enter another phase of distribution.
A failed retest at $0.0661 would strengthen the bearish signal, targeting $0.03 or lower.
The structure remains bearish until a valid higher high forms on the weekly timeframe.
This could also represent the final capitulation leg before a true long-term reversal begins.
---
⚖️ Conclusion
GRT is currently positioned at a decisive crossroads — will this become “the final dip before reversal,” or the continuation of pain?
The reaction within this zone will determine the macro structure for 2025.
As long as the $0.0661–$0.051 area holds, a rebound remains highly possible.
However, a weekly close below this zone will confirm a deeper bearish continuation and delay recovery for a longer period.
---
#GRTUSDT #GRT #TheGraph #CryptoTA #PriceAction #SupportResistance #ReversalZone #CryptoTrading #MarketStructure #SwingTrade #CryptoChart

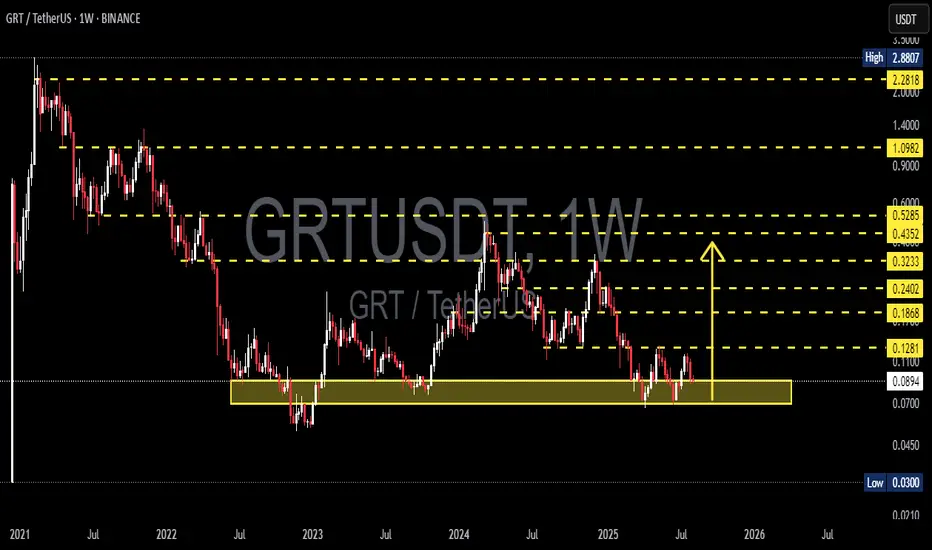
GRT/USDT — Accumulation Zone or Bearish Continuation?GRT/USDT is once again retesting the historical support zone (0.047–0.095), an area that has acted as a major demand level since 2022. This zone can be considered the “final wall” before a potential continuation of the long-term downtrend — or the foundation for a multi-year accumulation base.
The long-term structure still shows a series of lower highs since the 2021 peak, reflecting strong selling pressure. However, the fact that this yellow zone has held for nearly 3 years signals possible institutional demand or smart retail accumulation.
If this zone holds, the probability of a major reversal increases, especially if supported by strong weekly volume.
---
📈 Bullish Scenario
1. Rebound from accumulation zone: If price holds above 0.082 and forms a strong reversal candle (hammer / bullish engulfing), the first target is 0.1281.
2. Confirmed breakout: A weekly close above 0.1281 would shift structure bullish, opening upside targets at 0.1868 → 0.2402 → 0.3233.
3. Extended rally: If the broader crypto market supports, the price could extend toward 0.4352 – 0.5285, with long-term potential toward 1.0982.
---
📉 Bearish Scenario
1. Support breakdown: A weekly close below 0.047 would invalidate the accumulation zone, confirming further downside.
2. Bearish continuation: Next liquidity levels may lie around 0.03 – 0.02 or potentially new lows.
3. High selling volume: If breakdown occurs with strong bearish volume, chances of a quick recovery diminish significantly.
---
📊 Technical Pattern
Accumulation zone (yellow box): Major demand area since 2022.
Range-bound movement: Trading between 0.047 (bottom) and 0.128 (top).
Lower highs: Sellers remain in control, yet buyers repeatedly step in around 0.05–0.08.
Potential large double/triple bottom: If support holds, this could form a strong long-term reversal structure.
---
🎯 Trading Plan & Risk Management
Aggressive setup (risk-takers): Buy within 0.055–0.082 with a stop below 0.047. First target 0.1281 (R:R ≈ 1:1.7), extended targets up to 0.2402 (R:R > 5).
Conservative setup (trend-followers): Wait for a weekly breakout above 0.1281 with strong volume confirmation, then aim for 0.1868 – 0.2402.
Risk note: Since the support box is wide, use small position sizing to avoid large drawdowns.
---
📌 Conclusion
GRT is at a multi-year critical level. The 0.047–0.095 zone is decisive for long-term direction:
If it holds → strong chance of a major reversal and accumulation base.
If it breaks down → high probability of deeper continuation of the bearish trend.
Swing traders may look for bounces within the range, while long-term investors should closely monitor weekly closes and volume before committing.
---
#GRT #GRTUSDT #TheGraph #CryptoAnalysis #CryptoTrading #SupportResistance #AltcoinAnalysis #CryptoSwing #TechnicalAnalysis

GRT/USDT Weekly Analysis — “Life or Death Zone” for The Graph!🟡 🔥 Critical Zone: Demand Area in Play!
The Graph (GRT) is retesting one of its most critical historical demand zones — the $0.0700 to $0.0897 area — a level that has acted as strong support multiple times since mid-2022.
> This zone is not just a support — it’s a make-or-break level that has defined the survival of the GRT trend on the higher timeframes.
The current price action shows hesitation, low volatility, and potential accumulation — all classic signs that a major move is brewing.
---
📊 Technical Structure & Price Behavior
GRT has been trading in a wide sideways channel after a long-term downtrend, with multiple bounce attempts off this demand zone.
No higher highs have been confirmed since the last rally towards $0.24.
Volume appears to be declining, indicating compression before expansion.
Price has failed to break and sustain above key resistance levels, hinting that buyers are cautious — or waiting for macro confirmation.
---
🐂 Bullish Scenario: Accumulation & Breakout Potential
If buyers continue to defend the $0.0700–$0.0897 zone, and GRT can break above short-term resistance at $0.1281, this could confirm a reversal structure or at least a mid-term relief rally.
🎯 Potential Bullish Targets:
1. $0.1281 – minor local resistance
2. $0.1868 – structural breakout level
3. $0.2402 – previous rejection zone
4. $0.3233 – historical supply
5. $0.4352 & $0.5285 – macro targets if momentum builds
> A breakout above $0.1868 with volume could kickstart a trend reversal towards the $0.30–$0.50 region.
---
🐻 Bearish Scenario: Breakdown Below Demand
However, if GRT loses the $0.0700 key support, this would invalidate the accumulation thesis and potentially trigger panic selling.
⚠️ Bearish Breakdown Targets:
$0.0450 – intermediate support
$0.0300 – all-time low and last line of defense
> A breakdown would likely signal a return to macro bearish sentiment and a reset of the entire structure.
---
🔄 Market Psychology: The Calm Before the Storm?
We are in a classic zone of indecision, where both bulls and bears are waiting for a confirmation. This setup is often followed by high-volatility breakout or breakdown moves.
Traders and investors alike should be watching this area very closely.
---
📌 Strategic Summary:
Strategy Type Action
Long-term Investors Accumulation with strict stop below $0.0700
Swing Traders Wait for breakout of $0.1281 with confirmation
Risk-Averse Traders Avoid until direction is clear above $0.1868 or below $0.0700
#GRT #GRTUSDT #CryptoAnalysis #AltcoinUpdate #TechnicalAnalysis #SupportAndResistance #CryptoBreakout #DemandZone #AltcoinWatchlist #CryptoReversal #TheGraph
GRT/USDT at a Crossroads: Golden Pocket Retest or Breakdown?The GRT/USDT chart is currently at a critical technical juncture, presenting a high-probability setup for both breakout continuation or breakdown rejection. Here’s a breakdown of the key elements visible on the chart:
---
📐 1. Major Downtrend Breakout
GRT has been in a long-term downtrend since its peak in late 2024, with a well-respected descending trendline acting as resistance.
In mid-July 2025, the price broke above this trendline, signaling a potential trend reversal from bearish to bullish.
While volume was moderate, the breakout is technically valid.
---
📊 2. Golden Pocket Fibonacci Retest
Price is currently retesting the critical Fibonacci retracement zone:
0.5 = $0.09453
0.618 = $0.08941
This range is widely known as the “Golden Pocket”, a high-probability bounce zone during bullish continuation setups.
Price is currently sitting inside this zone, which makes this a potential low-risk entry area.
---
🧱 3. Key Historical Consolidation Zone
The area between $0.089 and $0.095 is not only the golden pocket but also aligns with a strong historical consolidation zone from April to June 2025.
This level acted as both support and resistance, making it a key technical and psychological level.
---
⚔️ Potential Price Scenarios
---
📈 Bullish Scenario (Upside Potential):
If price holds and bounces from the $0.089 – $0.095 support zone:
1. Initial resistance targets:
$0.10185 to $0.11000
2. Followed by breakout targets:
$0.11625
$0.12987
$0.14748
3. Medium-term bullish targets if trend continues:
$0.19021
$0.23545
📌 Bullish Confirmation Signs:
Bullish engulfing or strong reversal candle on the daily close.
Increased volume on the bounce.
RSI recovery from neutral (30–50) zone.
---
📉 Bearish Scenario (Downside Risk):
If price fails to hold above the $0.08941 Fibonacci level:
1. A breakdown below support may trigger further selling pressure.
2. Key downside targets:
$0.08000 (minor support)
$0.06629 (previous swing low)
📌 Bearish Confirmation Signs:
Daily close below $0.089 with strong bearish volume.
RSI drops below 30.
Strong rejection from resistance with bearish structure.
---
🧠 Pattern and Market Structure Insights
Breakout + Retest: Classic setup where price breaks a long-term trendline and returns to retest the breakout zone.
Fibonacci Confluence: The golden pocket aligns with previous price structure, reinforcing its strength.
Hidden Double Bottom (Potential): If price holds, this may also form a subtle double bottom structure — a bullish continuation signal.
---
📚 Conclusion & Trading Strategy
GRT/USDT is currently showing a technically strong setup, with a clean breakout followed by a meaningful retest at a key demand zone.
💡 If you're looking for a strategic long entry, this area offers low risk, high reward potential, provided you manage your stop-loss correctly.
---
🎯 Trade Idea & Risk Management
Potential Entry: $0.089 – $0.095
Conservative Stop Loss: Below $0.088
Initial Target Zone: $0.101 – $0.116
Mid-term Target: $0.19 – $0.23
#GRT #GRTUSDT #TheGraph #AltcoinAnalysis #CryptoBreakout #TechnicalAnalysis #CryptoTrading #FibonacciLevels #TrendlineBreak #GoldenPocket #BullishSetup #BearishBreakdown #CryptoEducation #Altcoins

GRT/USDT at a Critical Point! Reversal Structure or Breakdown?📊 Full Technical Analysis – GRT/USDT (1W Timeframe)
🔎 Overview:
GRT is currently positioned at one of the most critical technical levels in its long-term structure. After a prolonged downtrend from the $2.88 all-time high, price is once again testing the historical demand zone between $0.07 – $0.09, which has repeatedly acted as a strong support level since mid-2022. This area represents a major accumulation zone, where smart money may be silently positioning.
🧠 Structure & Pattern Formation:
✅ Historical Demand Zone (Major Support Area):
The $0.07 – $0.09 range has been tested over 5 times in the last 2 years, showing strong demand.
This zone also acts as the potential base of a double bottom pattern, indicating a possible macro reversal.
🟡 Double Bottom Potential (Reversal Pattern):
Two nearly equal lows forming around this demand area hint at a classic double bottom formation.
Confirmation comes if price breaks and holds above $0.1281 resistance.
🔻 Declining Selling Pressure:
Sellers appear to be losing momentum, as seen in the declining weekly volume.
This could signal distribution is ending and accumulation is underway.
📈 Bullish Scenario:
If GRT holds this critical support and breaks above key resistance, a strong mid-term rally may follow:
1. Breakout Confirmation:
Valid if the weekly candle closes above $0.1281.
2. Upside Targets (Fibonacci + Historical Resistance):
🎯 $0.1868 → minor resistance / past consolidation zone.
🎯 $0.2402 → previous rejection area.
🎯 $0.3233 → key Fibonacci retracement level.
🎯 $0.4352 → strong horizontal resistance.
🎯 $0.5285 → mid-term bullish target.
3. Ideal Bullish Conditions:
Bullish divergence on the weekly RSI.
Increasing volume on breakout confirmation.
📉 Bearish Scenario:
If the support fails to hold, GRT could face further downside:
1. Breakdown Below $0.07 – $0.09 Zone:
⚠️ $0.0550 → minor support.
⚠️ $0.0300 → All-Time Low and psychological support.
2. Deeper Risk:
If panic selling occurs or broader market sentiment worsens, GRT may print new lows, continuing its long-term bearish trend.
🧭 Conclusion & Strategy:
> GRT is in a highly interesting accumulation phase from a technical perspective.
The risk-to-reward from this support zone is attractive, with signs of a potential reversal building. However, traders should wait for confirmation and always use proper risk management.
Entry Strategy:
Speculative entry: inside the $0.08–$0.09 zone (tight stop-loss below $0.07).
Confirmed entry: after breakout and weekly close above $0.1281 (targeting levels mentioned above).
#GRT #TheGraph #GRTUSDT #CryptoReversal #DoubleBottom #SupportZone #AltcoinSetup #BullishCrypto #BearishRisk #TechnicalAnalysis

GRTUSDT 1W AnalysisGRT ~ 1W Analysis
#GRT Buy back gradually from here with a short term target of at least 20%+ from this support.

GRTUSDT 1D AnalysisGRT ~ 1D Analysis
#GRT On the 1D time frame the selling pressure has stopped.. Buy on this support block with a short term target of at least 10%+ from here.

GRTUSDT 1D AnalysisGRT ~ 1D Analysis
#GRT Buy when re -testing this support block or buy after successfully penetrating this resistant line with a short -term target of at least 10%+.

GRTUSDT 1WGRT ~ 1W Analysis
#GRT Buy gradually from here if you still have a Conviction on this Coin with a minimum target of 20%+.

GRTUSDT 1WGRT ~ 1W Analysis
#GRT If you still have Conviction on this coin, this is a very good support block for now. buy from here with a minimum target of 20%+

GRTUSDT 1WGRT Update ~ 1W
#GRT If you still have Conviction on this coin,. Buy gradually within this support block,. with a target of at least 20%+ from here

GRTUSDT UPDATE 1WGRT Update ~ 1W
#GRT rejected again from this resistance line,. If you still have Conviction on the coin,. Maybe this support block will be a very good buy zone. buy gradually with small trades,. with a minimum target of 20%+

GRTUSDTGRT ~ 4D
#GRT If you still have Conviction on this coin,. You can start placing Buy on this support block. Make purchases in stages with a short-term target of at least 20%++

GRTUSDTGRT ~ 3D ✅
#GRT Closing the price above this descending pattern, will be a Bulls indicator for further price increases.

GRT potential long term targetsGRT / USDT
We are still in the same cycle since beginning of 2023 with macro bull market HH and HL structure intact
Whats next ?
Here i can see a high potential upside movement from around current prices(HL) to produce a new HH ,The most important resistances are highlighted
Best of wishes

GRTUSDTGRT ~ 1W ✅
#GRT Make purchases gradually after breaking through the resistance line of this descending pattern.

GRTUSDTBINANCE:GRTUSDT is attempting a retest of the 0.16242 area. Are we going to see a rejection of the zone for a continuation of the bullish move or are we going to see a further push to the lower side? Either way, #GRTUSDT will tell us its next move. Until then, fingers crossed
Updates on this will follow...

GRT/USDT Need to Break the pattern for continue the upward move!💎 GRT has recently experienced notable shifts in the market. Currently, GRT has bounced from the demand area, with the candle exhibiting a positive response.
💎 If this bounce is validated, the next objective is the resistance trendline of the descending channel pattern. A successful breakout from this pattern probability could initiate a bullish momentum, facilitating an easy movement towards our target strong resistance area.
💎 However, should GRT fail to break out of the pattern, there's a potential retreat to the demand area to create new market momentum. Sustaining the demand zone is crucial, as a breakdown could signal a bearish trend, leading to a downward movement with the next support level situated at the support area, possibly extending further downward.

GRT/USDT Break this level, It will be confirmed Bullish movement💎 GRT has recently demonstrated noteworthy market dynamics, seemingly breaking out of the major cup and handle pattern, a reversal pattern indicating bullish momentum.
💎 However, for further confirmation, GRT needs to break above the bearish OB + supply area. A successful breakout from this zone could lead to a significant upward movement, probability signaling a bullish trend.
💎 Conversely, if GRT fails to break above and experiences rejection, there is potential for the price to retreat downwards towards the support area, which previously acted as resistance at the neckline of the CNH pattern.
💎 The support area holds significant importance, as a failure to maintain price above this level could invalidate the pattern, potentially leading to a reversal back into a downward trend. This could result in further decline towards the demand area, or possibly even lower levels.

GRTUSDTBINANCE:GRTUSDT Price has been bullish for a while now. Broke the 0.1245 resistance and did a retest of the zone.
My position is bullish with Targets:
0.16624
0.23660
0.32000
A break below the zone might just trigger some bearish move

GRT/USDT particularly as it approaches a crucial resistance area💎 GRT has consistently been a point of interest in the market, particularly as it approaches a crucial resistance area. Historically, GRT has faced strong rejections at this level, but a successful breakthrough could signal a significant upward shift. Achieving this would mean a probability movement towards our targeted daily resistance.
💎 However, if GRT is unable to surpass this resistance, remaining in consolidation at this level for the next few days, it risks facing another rejection. This could lead GRT to reverse its direction, moving back towards the demand area.
💎 The demand area represents a critical support level for maintaining GRT's bullish momentum. Should GRT fail to rebound upon reaching this zone and be unable to sustain levels above this key support, it risks a breakdown. A failure to hold above this key support could lead to further decline, possibly taking GRT to lower levels.

GRT target 0.251D time frame
-
GRT is breaking out the falling wedge structure, but this downtrend line is not standard due to many wicks. On higher time frame like 4h or 1D, GRT gain demand at 0.08 which is also the structural support, and face the resistance from downtrend line, if GRT can break it out with high volume, we can set target based on the wedge.
TP: 0.25~0.25
SL: 0.0745
