#GTC/USDT#GTC
The price is moving within a descending channel on the 1-hour frame, adhering well to it, and is heading towards a strong breakout and retest.
We are seeing a bounce from the lower boundary of the descending channel. This support is at 0.224.
We have a downtrend on the RSI indicator that is about to be broken and retested, which supports the upward trend.
We are looking for stability above the 100 moving average.
Entry price: 0.234
First target: 0.245
Second target: 0.255
Third target: 0.266
Gtcusdtshort

#GTC/USDT Long Trade Plan#GTC
The price is moving within a descending channel on the 1-hour frame and is expected to break and continue upward.
We have a trend to stabilize above the 100 moving average once again.
We have a downtrend on the RSI indicator that supports the upward break.
We have a support area at the lower boundary of the channel at 0.282, acting as strong support from which the price can rebound.
We have a major support area in green that pushed the price upward at 0.275.
Entry price: 0.293
First target: 0.303
Second target: 0.317
Third target: 0.332
To manage risk, don't forget stop loss and capital management.
When you reach the first target, save some profits and then change the stop order to an entry order.
For inquiries, please comment.
Thank you.

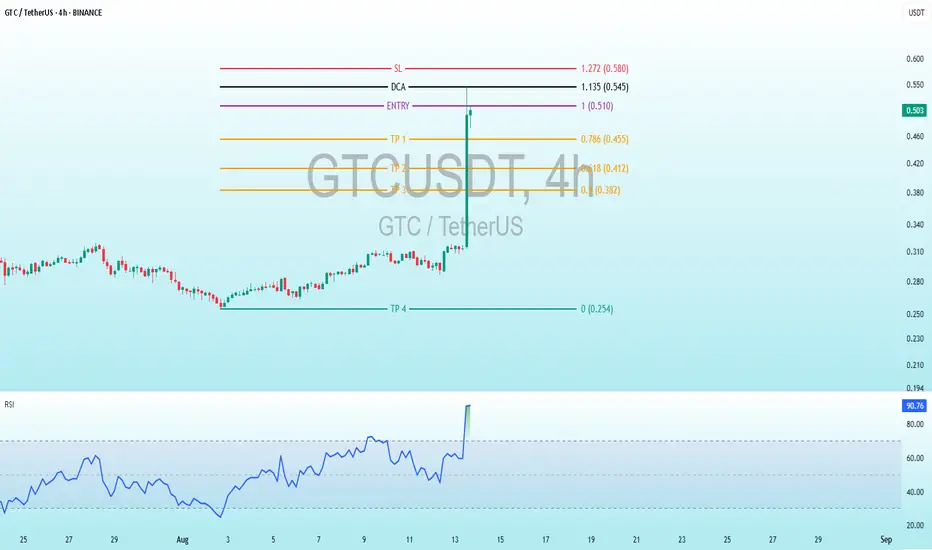
Master the Surge: $GTC 4H Trading Guide with RSI PeakBINANCE:GTCUSDT
Master the Surge: LSE:GTC 4H Trading Guide with RSI Peak
Trading Levels:
Entry: 1.00 (0.510 USDT) - The level where the initial purchase is planned.
DCA (Dollar-Cost Averaging): 1.135 (0.549 USDT) - An additional buying point if the price rises (note: same value as Entry, possibly a typo).
SL (Stop Loss): 1.272 (0.586 USDT) - The level where the loss would be limited.
TP (Take Profit):TP1: 0.786 (0.455 USDT)
TP2: 0.618 (0.412 USDT)
TP3: 0.5 (0.382 USDT)
TP4: 0.254 (0.254 USDT) - A significantly lower target, possibly a long-term goal.
RSI (Relative Strength Index) Indicator:
The current RSI value is 90.72, which is well into the overbought territory (above 70, and nearing 90). This suggests the price may be overextended, indicating a potential reversal or correction soon.
Analysis and Interpretation:Strategy:
The chart employs Fibonacci levels to set entry, exit, and loss points. The entry is planned at 0.549 USDT, with a DCA at the same level (which may be an error), and a stop loss at 0.586 USDT to protect capital.
Profit Targets: TP1 to TP3 are based on Fibonacci retracement levels (0.786, 0.618, 0.5), indicating a technical approach to securing profits incrementally. TP4 at 0.254 USDT seems unusually low and might reflect a long-term target or an error.
RSI: The extremely high RSI value (90.72) signals a strong overbought condition. This could imply an imminent pullback or consolidation, especially if the price fails to sustain its recent surge.
Recommendation:
Monitor the price closely around the entry level (0.549 USDT). Given the overbought RSI, consider caution with new entries or prepare for a potential sell-off.

GTC/USDT: BINANCE:GTCUSDTPERP BINANCE:GTCUSDT
Hello everyone 😃
Before we start to discuss, I'll be so glad if you share your opinion on this post's comment section and hit the like button if you enjoyed it!
$GTC have reached the Supply zone and the local highs are located before the DARVAS box's high.
With the current local high and the Supply above, It's better to have the SHORT here with a SL located at the local higher high at $1.426.
I'll trail my Stop-Loss after reaching the TP1.
Hope you enjoyed the content I created, You can support us with your likes and comments!
Attention: this isn't financial advice we are just trying to help people with their vision.
Have a good day!
@Helical_Trades

GTCUSDTPERP - potential good entry point- global trend up
- local trend up
- same participants accumulation positions on the upward channel
- potential entry point when price made break out trend line or key level 8.30
