TheGrove | EURAUD BUY | Idea Trading AnalysisEURAUD remains overall bullish, trading within a well-defined ascending structure.
Price is now approaching a high-confluence area, where the demand zone aligns perfectly with the lower red trendline. This intersection is critical, as it represents a classic trend-following buy zone within a healthy uptrend.
As long as this zone holds, we will be looking for bullish reactions and continuation setups, aiming for a move back toward the upper side of the channel and the previous highs.
Hello Traders, here is the full analysis.
I think we can soon see more fall from this range! GOOD LUCK! Great BUY opportunity EURUAD
I still did my best and this is the most likely count for me at the moment.
-------------------
Traders, if you liked this idea or if you have your own opinion about it, write in the comments. I will be glad 🤝
H-setup

ASX200 to find support at market price?AU200AUD - 24H expiry
There is no clear indication that the upward move is coming to an end.
Offers ample risk/reward to buy at the market.
The lack of interest is a concern for bears.
Our short term bias remains positive.
20 1hour EMA is at 8848.
We look to Buy at 8851 (stop at 8811)
Our profit targets will be 8971 and 8991
Resistance: 8869 / 8900 / 8950
Support: 8830 / 8777 / 8740
Risk Disclaimer
The trade ideas beyond this page are for informational purposes only and do not constitute investment advice or a solicitation to trade. This information is provided by Signal Centre, a third-party unaffiliated with OANDA, and is intended for general circulation only. OANDA does not guarantee the accuracy of this information and assumes no responsibilities for the information provided by the third party. The information does not take into account the specific investment objectives, financial situation, or particular needs of any particular person. You should take into account your specific investment objectives, financial situation, and particular needs before making a commitment to trade, including seeking, under a separate engagement, as you deem fit.
You accept that you assume all risks in independently viewing the contents and selecting a chosen strategy.
Where the research is distributed in Singapore to a person who is not an Accredited Investor, Expert Investor or an Institutional Investor, Oanda Asia Pacific Pte Ltd (“OAP“) accepts legal responsibility for the contents of the report to such persons only to the extent required by law. Singapore customers should contact OAP at 6579 8289 for matters arising from, or in connection with, the information/research distributed.

GBPAUD to find sellers at market price?GBPAUD - 24h expiry
Intraday rallies continue to attract sellers and there is no clear indication that this sequence for trading is coming to an end.
Our outlook is bearish.
20 1day EMA is at 2.0118.
Offers ample risk/reward to sell at the market.
There is no clear indication that the downward move is coming to an end.
We look to Sell at 2.0115 (stop at 2.0171)
Our profit targets will be 1.9955 and 1.9925
Resistance: 2.0145 / 2.0189 / 2.0204
Support: 2.0100 / 2.0060 / 2.0028
Risk Disclaimer
The trade ideas beyond this page are for informational purposes only and do not constitute investment advice or a solicitation to trade. This information is provided by Signal Centre, a third-party unaffiliated with OANDA, and is intended for general circulation only. OANDA does not guarantee the accuracy of this information and assumes no responsibilities for the information provided by the third party. The information does not take into account the specific investment objectives, financial situation, or particular needs of any particular person. You should take into account your specific investment objectives, financial situation, and particular needs before making a commitment to trade, including seeking, under a separate engagement, as you deem fit.
You accept that you assume all risks in independently viewing the contents and selecting a chosen strategy.
Where the research is distributed in Singapore to a person who is not an Accredited Investor, Expert Investor or an Institutional Investor, Oanda Asia Pacific Pte Ltd (“OAP“) accepts legal responsibility for the contents of the report to such persons only to the extent required by law. Singapore customers should contact OAP at 6579 8289 for matters arising from, or in connection with, the information/research distributed.

ENA: entry point.Factors for Entering a Long Position
1. We enter at the PoC level.
2. Long FVG.
3. The price returns to the range where we have the PoC level and the long FVG. I expect the price to react from this level up to the upper limit of the range.
BINANCE:ENAUSDT.P

MON trade setupBINANCE:MONUSDT.P
The logic is practically the same as in my review of ENA.
We observed a price deviation from the range. Then, we returned to the range and entered from the point of convergence (PoC) to the upper limit.

EURAUD to continue in the downward move?EURAUD - 24h expiry
There is no clear indication that the downward move is coming to an end.
Although we remain bearish overall, a correction is possible without impacting the trend lower.
Short term RSI has turned negative.
Risk/Reward would be poor to call a sell from current levels.
The measured move target is 1.7400.
We look to Sell at 1.7450 (stop at 1.7500)
Our profit targets will be 1.7350 and 1.7325
Resistance: 1.7450 / 1.7500 / 1.7510
Support: 1.7400 / 1.7375 / 1.7350
Risk Disclaimer
The trade ideas beyond this page are for informational purposes only and do not constitute investment advice or a solicitation to trade. This information is provided by Signal Centre, a third-party unaffiliated with OANDA, and is intended for general circulation only. OANDA does not guarantee the accuracy of this information and assumes no responsibilities for the information provided by the third party. The information does not take into account the specific investment objectives, financial situation, or particular needs of any particular person. You should take into account your specific investment objectives, financial situation, and particular needs before making a commitment to trade, including seeking, under a separate engagement, as you deem fit.
You accept that you assume all risks in independently viewing the contents and selecting a chosen strategy.
Where the research is distributed in Singapore to a person who is not an Accredited Investor, Expert Investor or an Institutional Investor, Oanda Asia Pacific Pte Ltd (“OAP“) accepts legal responsibility for the contents of the report to such persons only to the extent required by law. Singapore customers should contact OAP at 6579 8289 for matters arising from, or in connection with, the information/research distributed.
From Silver Shine to Zinc Strength: Hindustan Zinc’s Rally AheadBreakout: Stock has broken out of a descending triangle (bullish signal).
Current Price: ₹498.10
Target Zone: ₹572.10 (upside potential)
Stop-Loss: ₹444.95 (risk level)
Volume: Strong at 36.55M, confirming momentum.
Market Drivers
Silver Rally: Recent gains supported by rising silver prices.
Sector Strength: Outperformed metals sector and Sensex in early December.
Fundamentals
India’s only integrated zinc producer.
Strong reserves with >25 years mine life.
⚠️ Disclaimer
This is educational analysis only, not investment advice. Please consult a SEBI-registered advisor before trading.

AUD/NZD – Monthly Mean Reversion SHORTTrade Plan (Monthly Timeframe)
Direction: Short
Execution style: Scale-in / position trade
Time horizon: 3-6 months
Entry (Short)
Sell zone: 1.1450 – 1.1600
(Current price is already inside this zone)
Optional scale-in if price extends:
1.1680
1.1750 (final add)
Stop Loss at Monthly close above: 1.1800
A sustained monthly close above this level invalidates the mean-reversion thesis.
Take Profit Targets
TP1: 1.1200 (partial take profit)
TP2: 1.0950 (mean reversion to range value)
Rationale
Price is at a valuation extreme
Carry and rate differentials are fully priced
Monthly structure shows distribution, not breakout acceptance
Historically, AUD/NZD reverts slowly but decisively from these zones
This trade is managed on monthly closes only.
Daily and weekly noise is ignored.
Patience > precision on macro timeframe trades.
Not financial advice. For educational purposes only.

GBPNZD to continue in the upward move?GBPNZD - 24h expiry
There is no clear indication that the upward move is coming to an end.
Although we remain bullish overall, a correction is possible with plenty of room to move lower without impacting the trend higher.
Risk/Reward would be poor to call a buy from current levels.
A move through 2.3400 will confirm the bullish momentum.
The measured move target is 2.3475.
We look to Buy at 2.3300 (stop at 2.3225)
Our profit targets will be 2.3450 and 2.3475
Resistance: 2.3400 / 2.3450 / 2.3475
Support: 2.3350 / 2.3300 / 2.3225
Risk Disclaimer
The trade ideas beyond this page are for informational purposes only and do not constitute investment advice or a solicitation to trade. This information is provided by Signal Centre, a third-party unaffiliated with OANDA, and is intended for general circulation only. OANDA does not guarantee the accuracy of this information and assumes no responsibilities for the information provided by the third party. The information does not take into account the specific investment objectives, financial situation, or particular needs of any particular person. You should take into account your specific investment objectives, financial situation, and particular needs before making a commitment to trade, including seeking, under a separate engagement, as you deem fit.
You accept that you assume all risks in independently viewing the contents and selecting a chosen strategy.
Where the research is distributed in Singapore to a person who is not an Accredited Investor, Expert Investor or an Institutional Investor, Oanda Asia Pacific Pte Ltd (“OAP“) accepts legal responsibility for the contents of the report to such persons only to the extent required by law. Singapore customers should contact OAP at 6579 8289 for matters arising from, or in connection with, the information/research distributed.

XPL - local shortWe have reached the previous high. We have hit a pause. The picture paints a local short. Watch the price carefully. If the price goes above the previous high, it is advisable to skip it.
BINANCE:XPLUSDT.P

TheGrove | GBPCAD SELL | Idea Trading AnalysisGBPCAD broke down sharply from the rising channel, confirming a bearish. the impulsive sell-off invalidated prior bullish structure and pushed price below key intraday supports.
GBPCAD is moving on Resistance area..
The chart is above the support level, which has already become a reversal point twice.
We expect a decline in the channel after testing the current level.
We expect a decline in the channel after testing the current level
Hello Traders, here is the full analysis.
I think we can soon see more fall from this range! GOOD LUCK! Great SELL opportunity GBPCAD
I still did my best and this is the most likely count for me at the moment.
-------------------
Traders, if you liked this idea or if you have your own opinion about it, write in the comments. I will be glad ⚜️

NZDUSD to find buyers at current support?NZDUSD - 24h expiry
There is no clear indication that the upward move is coming to an end.
Although we remain bullish overall, a correction is possible with plenty of room to move lower without impacting the trend higher.
Risk/Reward would be poor to call a buy from current levels.
A move through 0.5800 will confirm the bullish momentum.
The measured move target is 0.5850.
We look to Buy at 0.57700 (stop at 0.5735)
Our profit targets will be 0.5845 and 0.5850
Resistance: 0.5800 / 0.5825 / 0.5850
Support: 0.5770 / 0.5760 / 0.5750
Risk Disclaimer
The trade ideas beyond this page are for informational purposes only and do not constitute investment advice or a solicitation to trade. This information is provided by Signal Centre, a third-party unaffiliated with OANDA, and is intended for general circulation only. OANDA does not guarantee the accuracy of this information and assumes no responsibilities for the information provided by the third party. The information does not take into account the specific investment objectives, financial situation, or particular needs of any particular person. You should take into account your specific investment objectives, financial situation, and particular needs before making a commitment to trade, including seeking, under a separate engagement, as you deem fit.
You accept that you assume all risks in independently viewing the contents and selecting a chosen strategy.
Where the research is distributed in Singapore to a person who is not an Accredited Investor, Expert Investor or an Institutional Investor, Oanda Asia Pacific Pte Ltd (“OAP“) accepts legal responsibility for the contents of the report to such persons only to the extent required by law. Singapore customers should contact OAP at 6579 8289 for matters arising from, or in connection with, the information/research distributed.

NEAR - an addition to the original idea (AMD model).My first review here -
Nothing has changed; everything is still relevant. I'm just analyzing it in terms of the AMD model.
It looks really technical and cool!
BINANCE:NEARUSDT.P

SMR 1D: Small reactors. Big nerves.I am looking at NuScale Power without emotions. After a strong impulsive move, the price is in a deep correction phase and is now forming a base. The key focus is not old trendlines, but current market behavior. On the daily chart, RSI reached oversold levels and started to turn up, while price is no longer making aggressive new lows. This signals weakening selling pressure. Volume increased noticeably in the 16.50–18.00 zone, suggesting accumulation rather than panic selling. This is not a fast reversal, but a classic stabilization phase after a sharp sell off.
From a technical perspective, as long as this base holds, a recovery scenario remains valid. Initial upside levels are around 23.50, followed by 30.65. In a more optimistic scenario, the 42.00 area becomes relevant, but only if momentum and volume continue to confirm.
Fundamentally, NuScale remains a high risk but strategic story. The company continues to develop small modular nuclear reactors, targeting long term demand from energy infrastructure and data centers. As of late 2025, profitability is still negative, with Q4 2025 EPS estimated around −0.16 USD, which is already priced in by the market. Revenue remains modest, with near term estimates around 9 million USD, but the real value lies in government backed programs, long term energy contracts, and the strategic role of SMR technology in the energy transition. This is why the stock reacts sharply to any shift in sentiment around nuclear energy and infrastructure spending.
For me, this is not a place for excitement, but a zone to watch carefully. As long as RSI continues to recover and volume confirms demand, the base scenario stays constructive. If the base fails, the market will quickly remind us that future technologies still come with present day risks.
Nuclear energy promises stability. The SMR chart reminds us that the road there is anything but calm.

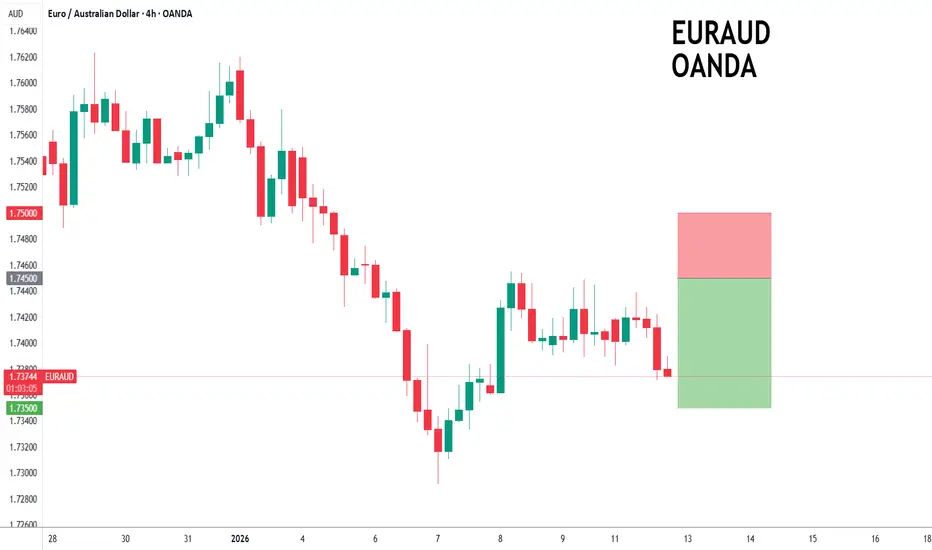
EURAUD to continue in the downward move?EURAUD - 24h expiry
There is no clear indication that the downward move is coming to an end.
Although we remain bearish overall, a correction is possible without impacting the trend lower.
Short term RSI has turned negative.
Risk/Reward would be poor to call a sell from current levels.
The measured move target is 1.7250.
We look to Sell at 1.7400 (stop at 1.7450)
Our profit targets will be 1.7300 and 1.7250
Resistance: 1.7400 / 1.7450 / 1.7500
Support: 1.7350 / 1.7300 / 1.7250
Risk Disclaimer
The trade ideas beyond this page are for informational purposes only and do not constitute investment advice or a solicitation to trade. This information is provided by Signal Centre, a third-party unaffiliated with OANDA, and is intended for general circulation only. OANDA does not guarantee the accuracy of this information and assumes no responsibilities for the information provided by the third party. The information does not take into account the specific investment objectives, financial situation, or particular needs of any particular person. You should take into account your specific investment objectives, financial situation, and particular needs before making a commitment to trade, including seeking, under a separate engagement, as you deem fit.
You accept that you assume all risks in independently viewing the contents and selecting a chosen strategy.
Where the research is distributed in Singapore to a person who is not an Accredited Investor, Expert Investor or an Institutional Investor, Oanda Asia Pacific Pte Ltd (“OAP“) accepts legal responsibility for the contents of the report to such persons only to the extent required by law. Singapore customers should contact OAP at 6579 8289 for matters arising from, or in connection with, the information/research distributed.

DAX 3-Drives Pattern - Monster Short SignalOK, I admit, it’s very early to call this a three-drives pattern.
But as a trader, I always think, “What if?”
This is my way of preparing early in the process. It allows me to make educated decisions, rather than FOMO trades.
What I am waiting for now is a break of the yellow CIB line. Typically, after such a break, price pulls back to retest it. This behavior is similar to what we see when the median line of a fork is broken.
If this setup triggers, it would clearly be a long-term play. Or it could be over vevry quick via a very sharp, violent move to the south.
Let’s watch it and prepare for this thesis.

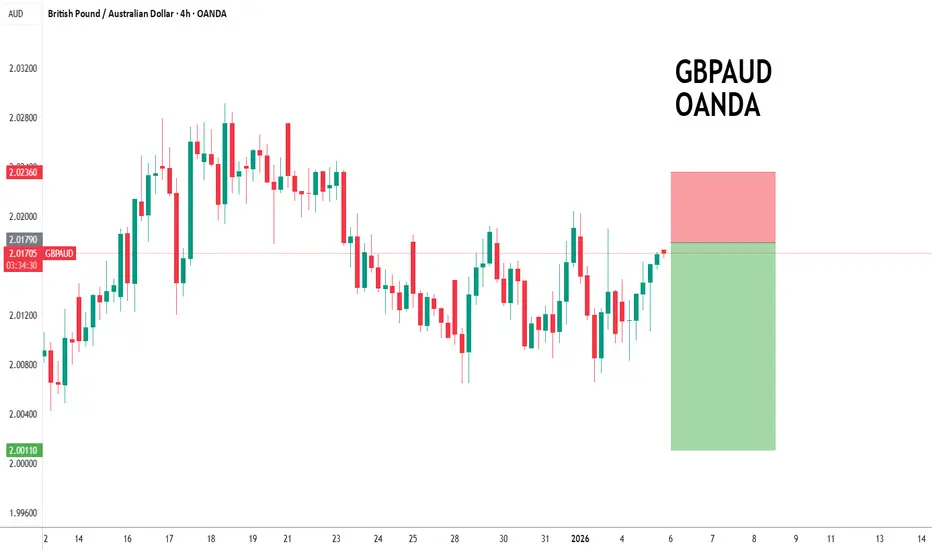
GBPAUD to find resistance at current market price?GBPAUD - 24h expiry
Intraday rallies continue to attract sellers and there is no clear indication that this sequence for trading is coming to an end.
2.0204 has been pivotal.
Bespoke resistance is located at 2.0190.
We look for a temporary move higher.
Preferred trade is to sell into rallies.
We look to Sell at 2.0179 (stop at 2.0236)
Our profit targets will be 2.0011 and 1.9971
Resistance: 2.0163 / 2.0204 / 2.0240
Support: 2.0100 / 2.0065 / 2.0000
Risk Disclaimer
The trade ideas beyond this page are for informational purposes only and do not constitute investment advice or a solicitation to trade. This information is provided by Signal Centre, a third-party unaffiliated with OANDA, and is intended for general circulation only. OANDA does not guarantee the accuracy of this information and assumes no responsibilities for the information provided by the third party. The information does not take into account the specific investment objectives, financial situation, or particular needs of any particular person. You should take into account your specific investment objectives, financial situation, and particular needs before making a commitment to trade, including seeking, under a separate engagement, as you deem fit.
You accept that you assume all risks in independently viewing the contents and selecting a chosen strategy.
Where the research is distributed in Singapore to a person who is not an Accredited Investor, Expert Investor or an Institutional Investor, Oanda Asia Pacific Pte Ltd (“OAP“) accepts legal responsibility for the contents of the report to such persons only to the extent required by law. Singapore customers should contact OAP at 6579 8289 for matters arising from, or in connection with, the information/research distributed.
BTC is at the stage of overheating.We have reached the upper limit of our monthly sideways movement and removed liquidity from above. Now, we need to remove liquidity from below.
We will either leave from the current level or from the $92,300 level.
Use your RM. Good luck with your trading, everyone! Let's see how Monday opens.
BINANCE:BTCUSDT.P

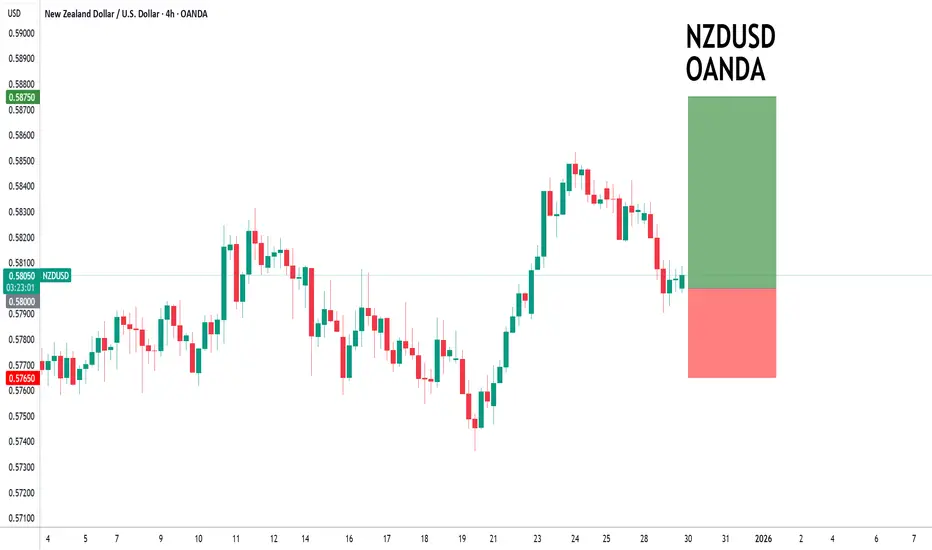
NZDUSD to find support market price?NZDUSD - 24h expiry
There is no clear indication that the upward move is coming to an end.
Although we remain bullish overall, a correction is possible with plenty of room to move lower without impacting the trend higher.
Risk/Reward would be poor to call a buy from current levels.
A move through 0.5850 will confirm the bullish momentum.
The measured move target is 0.5900.
We look to Buy at 0.5800 (stop at 0.5765)
Our profit targets will be 0.5875 and 0.5900
Resistance: 0.5850 / 0.5875 / 0.5900
Support: 0.5800 / 0.5775 / 0.5750
Risk Disclaimer
The trade ideas beyond this page are for informational purposes only and do not constitute investment advice or a solicitation to trade. This information is provided by Signal Centre, a third-party unaffiliated with OANDA, and is intended for general circulation only. OANDA does not guarantee the accuracy of this information and assumes no responsibilities for the information provided by the third party. The information does not take into account the specific investment objectives, financial situation, or particular needs of any particular person. You should take into account your specific investment objectives, financial situation, and particular needs before making a commitment to trade, including seeking, under a separate engagement, as you deem fit.
You accept that you assume all risks in independently viewing the contents and selecting a chosen strategy.
Where the research is distributed in Singapore to a person who is not an Accredited Investor, Expert Investor or an Institutional Investor, Oanda Asia Pacific Pte Ltd (“OAP“) accepts legal responsibility for the contents of the report to such persons only to the extent required by law. Singapore customers should contact OAP at 6579 8289 for matters arising from, or in connection with, the information/research distributed.
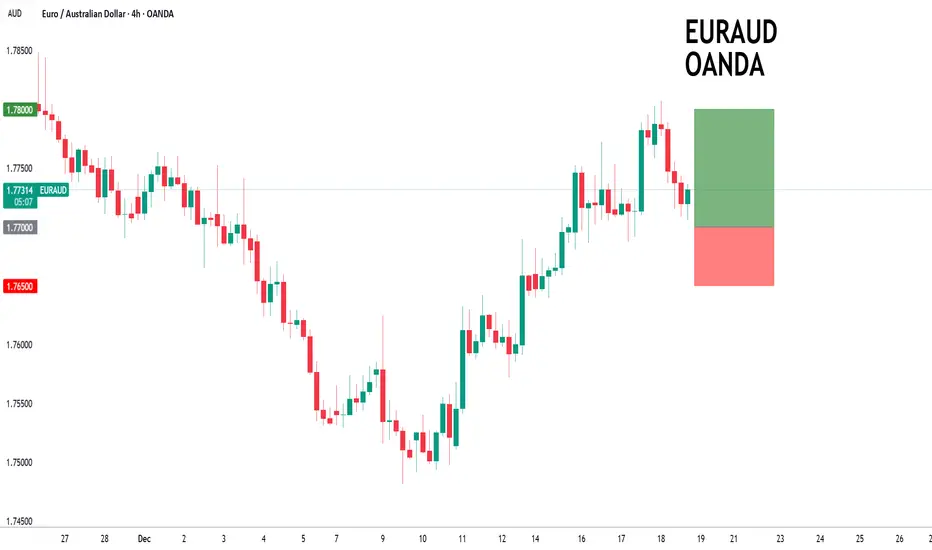
EURAUD to find buyers at market price?EURAUD - 24h expiry
There is no clear indication that the upward move is coming to an end.
Although we remain bullish overall, a correction is possible with plenty of room to move lower without impacting the trend higher.
Risk/Reward would be poor to call a buy from current levels.
A move through 1.7650 will confirm the bullish momentum.
The measured move target is 1.7725.
We look to Buy at 1.7600 (stop at 1.7550)
Our profit targets will be 1.7700 and 1.7725
Resistance: 1.7650 / 1.7700 / 1.7725
Support: 1.7600 / 1.7575 / 1.7550
Risk Disclaimer
The trade ideas beyond this page are for informational purposes only and do not constitute investment advice or a solicitation to trade. This information is provided by Signal Centre, a third-party unaffiliated with OANDA, and is intended for general circulation only. OANDA does not guarantee the accuracy of this information and assumes no responsibilities for the information provided by the third party. The information does not take into account the specific investment objectives, financial situation, or particular needs of any particular person. You should take into account your specific investment objectives, financial situation, and particular needs before making a commitment to trade, including seeking, under a separate engagement, as you deem fit.
You accept that you assume all risks in independently viewing the contents and selecting a chosen strategy.
Where the research is distributed in Singapore to a person who is not an Accredited Investor, Expert Investor or an Institutional Investor, Oanda Asia Pacific Pte Ltd (“OAP“) accepts legal responsibility for the contents of the report to such persons only to the extent required by law. Singapore customers should contact OAP at 6579 8289 for matters arising from, or in connection with, the information/research distributed.

ASX200 to see extended gains?ASX200 - 24H expiry
Price action looks to be forming a bottom.
A break of the recent high at 8722 should result in a further move higher.
We look for gains to be extended today. Our outlook is bullish.
The primary trend remains bullish.
We look to Buy a break of 8723 (stop at 8649)
Our profit targets will be 8883 and 8913
Resistance: 8722 / 8750 / 8800
Support: 8655 / 8610 / 8543
Risk Disclaimer
The trade ideas beyond this page are for informational purposes only and do not constitute investment advice or a solicitation to trade. This information is provided by Signal Centre, a third-party unaffiliated with OANDA, and is intended for general circulation only. OANDA does not guarantee the accuracy of this information and assumes no responsibilities for the information provided by the third party. The information does not take into account the specific investment objectives, financial situation, or particular needs of any particular person. You should take into account your specific investment objectives, financial situation, and particular needs before making a commitment to trade, including seeking, under a separate engagement, as you deem fit.
You accept that you assume all risks in independently viewing the contents and selecting a chosen strategy.
Where the research is distributed in Singapore to a person who is not an Accredited Investor, Expert Investor or an Institutional Investor, Oanda Asia Pacific Pte Ltd (“OAP“) accepts legal responsibility for the contents of the report to such persons only to the extent required by law. Singapore customers should contact OAP at 6579 8289 for matters arising from, or in connection with, the information/research distributed.

Review and plan for 22nd December 2025 Nifty future and banknifty future analysis and intraday plan.
Few stocks.
This video is for information/education purpose only. you are 100% responsible for any actions you take by reading/viewing this post.
please consult your financial advisor before taking any action.
----Vinaykumar hiremath, CMT

EURAUD to continue in the upward move?EURAUD - 24h expiry
There is no clear indication that the upward move is coming to an end.
Although we remain bullish overall, a correction is possible with plenty of room to move lower without impacting the trend higher.
Risk/Reward would be poor to call a buy from current levels.
A move through 1.7750 will confirm the bullish momentum.
The measured move target is 1.7825.
We look to Buy at 1.7700 (stop at 1.7650)
Our profit targets will be 1.7800 and 1.7825
Resistance: 1.7750 / 1.7800 / 1.7825
Support: 1.7725 / 1.7700 / 1.7675
Risk Disclaimer
The trade ideas beyond this page are for informational purposes only and do not constitute investment advice or a solicitation to trade. This information is provided by Signal Centre, a third-party unaffiliated with OANDA, and is intended for general circulation only. OANDA does not guarantee the accuracy of this information and assumes no responsibilities for the information provided by the third party. The information does not take into account the specific investment objectives, financial situation, or particular needs of any particular person. You should take into account your specific investment objectives, financial situation, and particular needs before making a commitment to trade, including seeking, under a separate engagement, as you deem fit.
You accept that you assume all risks in independently viewing the contents and selecting a chosen strategy.
Where the research is distributed in Singapore to a person who is not an Accredited Investor, Expert Investor or an Institutional Investor, Oanda Asia Pacific Pte Ltd (“OAP“) accepts legal responsibility for the contents of the report to such persons only to the extent required by law. Singapore customers should contact OAP at 6579 8289 for matters arising from, or in connection with, the information/research distributed.