Trend prediction for 20 to 24 September 2021
Greetings, the HSI trend has reached a new low point 24424 in 2021 years at 17/09/2021. Then it rebounce back and end with 24920. It could be studied as the investors do not want to let the trend break through 24580 and there is a resistance line at there. The trade volume at 17/09/21 is more than any day trade in September. Will it be a chance to rebounce THIRD Time?
Before we talk about the rebounce, there are few news that we should keep in our mind.
Last week, Evergrande (3333) debt crisis event, and also the announcement of Macau government to amend the gambling gaming law, have caused serious impact to Hong Kong Stock market. The trend start to go down trend at 13 September to 16 September. Since the incidents haven't been resolved, the panic of the Hong Kong investors not stable yet.
From chart, we could find out that even the trend keeps go down trend, but the MACD and RSI of three rebounce point are one wave higher than one wave. And each time the trend reached the low point (27/07) (20/08) & (16/09), obvious rebounce will happen. THERE IS A RESISTANCE AT 24580 TO PREVENT THE TREND DROP FURTHER , which means the will of investors do not want the trend go down trend further. However, you will also find out that, EACH TIME OF REBOUNCE, THE RESISTANCE POINT BECOME LOWER EACH TIME. You may study the phenomenon as LOSS OF STRENGTH , even the trade volume is higher than any trade volume in September. But, after a period for investors to examine the news and policy of CHINA government, the market atmosphere will gradually calm down, and restart new investment strategy.
But the trend at 17 September 2021 appears a PIERCING LINE PATTERN, which is a signal about the change of trend or bottom signal. If the trend can stand back above 25000 and end with red candle on next Monday or Tuesday (20 - 21Spetember), the trend can be confirmed to turn uptrend and start a new rebounce again. If not, then it might break through the 24580 and find a new low point again.
============================
Suggestion for the HSI market
============================
Since the trend is unknown, OBSERVE THE TREND FOR NEXT MONDAY AND TUESDAY and wait until it has confirmed its trend change to uptrend. If not, consider the down trend will keeps continue.
Keep in mind that the entire trend of HSI is high first and low. If this trend analysis does not change in the future, it means that more lower point will appear in September.
Again, All the prediction above just assumption, and it is not an advise to purchase or sell the share, please be responsible to your own trade behaviour.
Hope all of you may earn more money and be a rich man/woman.
==============New update============
Hang Seng Future (Night) + ADR for 20 September 2021
Closed price = 24784
Advise =Next Monday (20/09) HSI maybe will low open at 24784, but it might be changed on next Monday again.
Hangsengindex

HSI1! 2021 Sep 20 Week
HSI1!
HSI1! 2021 Sep 20 Week
Weakness played out last week and market was supported at about 24587, this is the 50% of the Feb 2016 - Jan 2018 uptrend.
If there is a breakdown and this becomes resistance, market would see more down side.
The last up move from 20 Aug - 08 Sep took more days and volume than the one before it while we see more ease of downward
movement.
Weekly: Wide spread down bar closing off low net change from previous down bar is narrow = some demand
Daily: Up bar closing off high = weakness
H3: The last wide spread UHV up bar is SOW. Market exited down channel. Will its demand line become resistance or will price
attempt to re-enter the channel?
Strategy for Short (Test and Reject)
Strategy for Long (Test and Support)
Entry will be based off the price reaction to these levels:
Have a sane trading week for Hang Seng : )

HSI1! 2021 Sep 13 WeekHSI1!
HSI1! 2021 Sep 13 Week
Last week's preference to keep to long last week was fruitful.
Weekly: Up bar close below 50% of bar = weakness
and a third off the high = weakness.
Daily: Price is attempting to test recent high in the red zone, nothing meaningful yet on
daily chart.
H3: Market moving up, but shortening of thrust. Effort no result = weakness
Long will be at the channel's demand line or when price is
marked down to test previous UHV wide spread bars.
Strategy for Short (Test and Reject)
Strategy for Long (Test and Support)
Entry will be based off the price reaction to these levels:
Have a sane trading week for Hang Seng : )

Hang Seng Index Trend Prediction of 13 to 17 SeptemberGreetings, here comes the conclusion of the trend for this week. The reason of the rebounce end early is because, the trade volume of the entire Hang Seng Index Significantly weakened and there is not enough power to push the HSI up to the new high price. Also, Tencent SDN BHD, one of the biggest company of China and Hong Kong, has been summoned by the government to have a talk about the issue of the restriction gaming hours of teenager and child, and also the delayed released announcement of their big game project . Two reasons above are the main impact to cause the Hang Seng Index trend end the rebouce early and the panic of investors sold out their shares. Also, BABA(9988), XIAO-MI(1810), MEITUAN (3690) are the main influence as TENCENT, and all of them fall in price together today and influence the HSI at the same time.
After explain the reason of why the HSI end the rebouce and go down trend, now we start to analysis the future trend.
As we predicted before, the ENTIRE HSI is still in BEARISH position. In fact, there is also not enough power and volume to support the trend to go bullish as the entire Hong Kong market considered the HSI trend by now just a rebounce but not a chance to go bullish.
So, the bottom support line off 24550 will be the second test of the breakthrough resistance position. However, it might break through the resistance with BIG POSIBILITY as the trend this week has been break through the 20 and 10 EMA. ONLY IF THE TREND CAN BE RECOVER AND STAND STILL ABOVE 10 EMA, THEN MAYBE IT WILL BE A SECOND REBOUNCE OF HSI .
The other reason we say BIG POSIBILITY to break through the bottom support line is because, the WEEK AND MONTH TREND are still bearish and only the startto go down trend. Keep in mind that Overall market atmosphere is still remain sidelines and not enough confidence to support the HSI turn into uptrend.
Therefore, the suggestion is that, OBSERVE THE TREND WHETHER WILL BACK TO 24550 AGAIN OR NOT, THEN WAIT FOR IT TO REBOUCE OR BREAKTHROUGH , then you may consider it is going to be rebounce again or breakthrough down tren.
Again, All the prediction above just assumption, and it is not an advise to purchase or sell the share, please be responsible to your own trade behaviour.
Hope all of you may earn more money and be a rich man/woman.

HSI1! 2021 Sep 06 Week
HSI1!
HSI1! 2021 Sep 06 Week
Last week's preference to keep to long last week was fruitful.
Weekly: Up bar broke previous week's high but close below its high
and a third off the high = weakness.
Daily: Upthrust + weakness in the background = weakness
H4: Upthrust and supply came in = Weakness has appeared. However
no follow through on the UHV down bar at the moment, with 25748 acting
as immediate support.
Opportunity for short should price return to test the high.
Long will be at the channel's demand line or when price is
marked down to test previous UHV wide spread bars.
Strategy for Short (Test and Reject)
Strategy for Long (Test and Support)
Entry will be based off the price reaction to these levels:
Have a sane trading week for Hang Seng : )

New prediction of next week HSI (30/8/21 - 3/9/21)Greeting, this is my new prediction for the future Hang Seng Index, please forget our previous prediction without accurate information.
Basically, Hang Seng Index has entered Bearish Trend. The Down Trend has gone through two waves, and the third wave will happen in the future. If it is not a big down trend, it will end the bear trend after three wave.
Therefore, my prediction about the third wave is, the highest point of the third wave might be 25982.64, then the lowest point of the third wave might break through the 24748.24. It might be happened within 2 week (30/8/21 - 10/9/21), and will rebounce before break through 23124.
Next week (30/8/21 - 3/9/21) may will happen a little rebouce, then drop again until the 24748.24.
After that, if the trend break though 24748.24, the trend between 6/9/21 - 10/9/21 will be down trend again and the retracement will end within September.
At last, we may prepare for the third wave of down trend in the future. All the prediction above just assumption, and it is not an advise to purchase or sell the share, please be responsible to your own trade behaviour.
Hope all of you may earn more money and be a rich man/woman.
HSI1! 2021 Aug 30 Week
HSI1!
HSI1! 2021 Aug 30 Week
Last week's long preference worked well.
24306 was a previous high demand area, will buyers
come in to support should price reach there?
Daily: No Demand tiny spread, background = lower high.
Last 2nd and 3rd bar effort not result for the bears.
H4: 20 - 25 Aug we see the highest bullish volume emerged on
the background of this downtrend.
Also a spring in the 24780 - 26900 range.
Prefer to long on test of low.
Strategy for Short (Test and Reject)
Strategy for Long (Test and Support)
Entry will be based off the price reaction to these levels:
- 26900 - 26584
- 25955
- 25682
- 25330
- 24780
- 24306
Have a sane trading week for Hang Seng : )

30 Aug to 3 Sept 2021 bearish alert?Last week, we predict this week might rebouce until 26840.
However, this week HSI has not enough power to rise back at 26840, therefore we may assume that next week 30/8/21 to 3/9/21 will break through 24750.
The assumption is based on the Zigzag down trend hasn't reaches it new bottom.
We predict that Hang Seng Index might reach it previous low point 23130 within 2 week in future. If HSI didnt break through 23130, then it will rebounce.
This is our new update, and we might no update any new post next two week, hope everyone good luck

Hang Seng Index Rebounded Sharply after Touching 24,850 SupportThe Hang Seng Index found some support at 24,850 and has since rebounded.
Holding above this level may pave the way for a technical rebound towards 26,200 – the 61.8% Fibonacci retracement.
The MACD indicator remains below the neutral midpoint, underscoring bearish momentum.

Prediction of HSI trend this week 23 Aug to 27 Aug 2021Hi guys, well, as last week predict, this week probably will be the rebounce of HSI, and today it has a small rebounce. Therefore, for this week, it is importance that whether the trend will kill going up or drop down and break the bottom support line.
Altough Zigzag hasn't reach it new bottom, the same rebounce can be found at the end of June 2021. Therefore, we may predict this week will rebounce as before.
This is my comment for this week, and probably wont update again until next week. Sorry for poor english, if this can help some one else, it is my honor.

Buyers to move. Is the triangle almost complete?For the flows here, buyers are clearly in control and have been over multiple decades - although since 2016 we have been inside a compression range which looks set to blow later in 2022. Strong support comes into play at 23,500 which should be enough to cap the outflows before continuation in a bull market towards a measure 40,000 breakout target.
↳ To the downside sellers are itching to test 23,500 and it looks within reach. It is dangerous to step in till we complete the moves, because the eye of the law is on it.
↳ After 23,500 comes the slingshot attempt towards 40,000, which will likely be a Q222 story, as will also reinstate the secular bull market and allow gains in confidence to play an important part in capital migration from West to East.
↳ To sum up, there is the following zig zag in play; 25,000 (current levels) -> 23,500 (strong support) -> 40,000 (strong resistance)
Of course on the fundamental side, the rocking of the cradle from the nanny state continues and we are entering into the final chapters of the handover. Naturally when choosing a map in equities you should take into account its elasticity with the currency and the threats it can deliver, highly recommend tracking the Chinese Yuan over the coming weeks and months for any signs of distress as we enter into strong support levels.

HSI1! 2021 Aug 23 WeekHSI!!
HSI1! 2021 Aug 23 Week
Last week's long levels become short levels market did not even try to test the immediate high.
Supply proved stronger. Market returned to test the UHV, and it looks like a spring has occured
Weekly: Wide Spread sown bar closing off lows = Demand has come in.
Daily: Wide spread down closing in middle, rejection of lower prices. Reduced bearish volume on the test.
H4: Demand has come in to support the market. Bearish effort no result, reduced bearish volume on test of previous low.
Prefer to long on test of low.
Strategy for Short (Test and Reject):
- 26900 - 26584
- 25814
Strategy for Long (Test and Support):
- 25400
- 24780
- 24306
- 23870
Have a sane trading week for Hang Seng : )

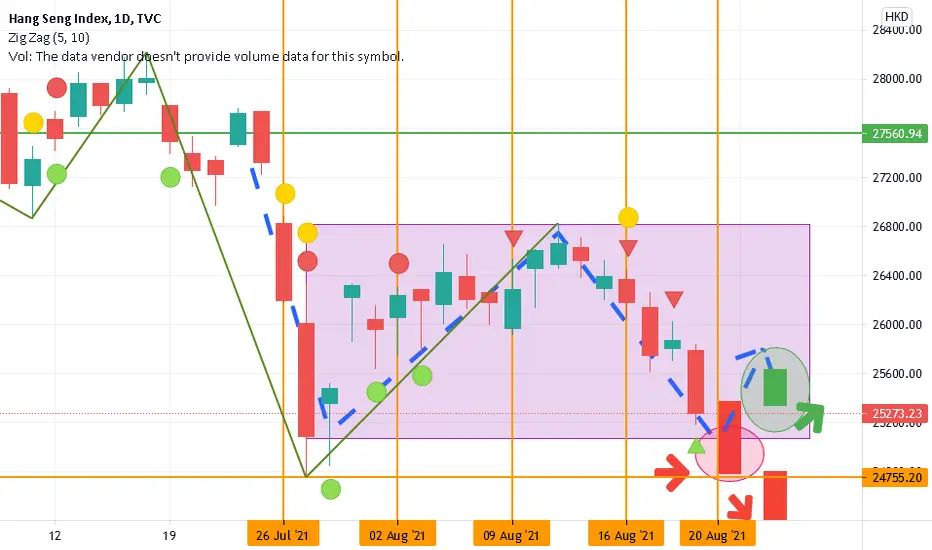
Next week Hang Seng Index Rebounce? As we predicted last night, today the hangseng index come to the lower point of 24748 (27/7/21) before, but didn't break through the lower point. Therefore, the main point for next week is whether the hangseng index will rebounce or not?
Reading from MACD and RSI, even today come to the lower point, but the RSI and MACD not yet touch or over the lower point as 27/7/21 reached. It may be study as it might potentialy rise in the future, but on the other hand, it may also study as remain potential to drop again. All the assumption have to depend on the CHINA government policies.
Therefore, we may observe the trend on next Monday whether it rebounce or break through the frame.

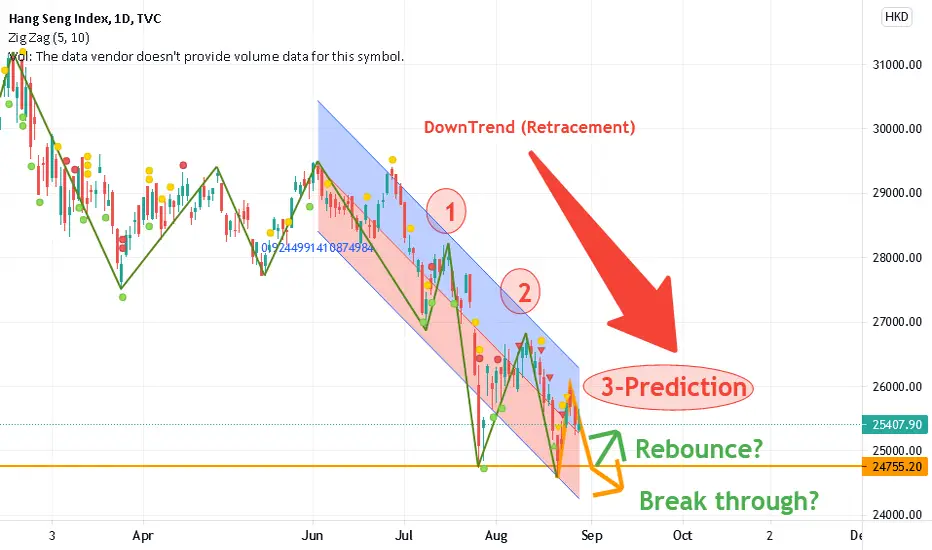
will HSI Index Rebounce or continue Retracement at 20 AugustToday HangSengIndex drop as expected, therefore the main point is, will the retracement will end at tomorrow 20/8/21?
According to our analysis, we expect that August will be the month of retracement of HangSengIndex. This week will decide whether the index will rebouce or keep dropping, we expect 20/08/21 will be the last drop of HSI. If next week monday, the index break through the bottom support line of 24755, it might start to drop more faster than expect, but if rebouce and rise at next week, we expect it might rise back to 26800 next month. Or, 3RD possiblility, is that it might go as pattern (3) as the chart listed, and continue retracement until the end of August or Half of September
SORRY ABOUT THE POOR ENGLISH AND HOPE EVERYONE MAY EARN PROFIT IN FUTURE.
HSI1! 2021 Aug 16 WeekHSI1!
HSI1! 2021 Aug 16 Week
Gentle ascend, intermediate trend channel established.
High probability short trade from the upthrust.
Tested Historic UHV High from 27 Jul
Weekly: Up bar close above middle
(some strength, but supply still present)
Daily: Strength coming in
H4: Supply still present and Lower High
Strategy for Short (Test and Reject):
- 26900
- 26584
Strategy for Long (Test and Support):
- 25815
- 25560
- 24743 - 24930
- 26340 (ultimate confirmation if there is acceptance
at this price followed by strong bullish volume)
Have a sane trading week for Hang Seng : )

The HSI has likely breached an immediate resistance at 26,650 - A successful attempt may open the door for further upside potential
- MACD indicator is trending higher, underscoring upward momentum

2021 Aug 09 Week HSI1!
HSI1!
HSI1! 2021 Aug 09 Week
Last week's market:
= No follow through in breakout - Weakness
- Upthrust and returned to rotation zone = weakness
- Yet to test the Historic UHV from 27 Jul
- Market in 650pt rotation (grey box)
Monthly = UHV wide spread down bar closing off low (Change in behavior takes time)
Weekly = Potential demand, close on middle 26042
Daily: No result from Reversal1. Last bar closing off low, no sign of strength yet
H4: Supply still present. (Weakness appears on Up bars)
Immediate Resistance 26340 - 26483
Intermediate support 25560 - 25650
Strategy:
1) Price reaction off Red/Green Zones
2) Price reaction off boundary of rotation zone (grey box)

2021 Aug 02 Week
OANDA:HK33HKD
2021 Aug 02 Week
Last week a historically UHV down bar appeared. Strength always appears on UHV ultra wide spread DOWN bar.
Weekly: Market has rolled over with a wide spread down bar closing in middle (UHV) = Indecision.
Price bounced off Monthly channel demand line.
Daily: Shakeout + Reversal = Strength. Market was resisted at 26340 temporarily.
Given the UHV, there should still be supply to clear.
H4: Bar A UHV ultra wide spread bar closing off low = strength. Automatic reversal after climatic Bar A
has reasonably good bullish volume. Test of the lower region of bar A is to be expected.
Bar B test of low has off the low and level with bar A, some demand is present.
Strategy:
(1) Red/Green zones = preferred entry
(2) Dotted Red/Green is to indicate late entry, but risk will be higher since SL is further away
Remember to follow and like if you find this useful.
Have a profitable week ahead.

Hang Seng Index Futures at Key Inflection Point, Top to Resume?After tumbling recently, Hang Seng Futures are back to retesting a former trendline from 2020 as new resistance.
This is also around the often pivotal 61.8% Fibonacci retracement at 26078.
The near-term 20- and 50-day Simple Moving Averages (SMAs) still offer a downside bias, potentially acting as key resistance in the event prices materially push higher.
Otherwise, downtrend resumption entails clearing key support, which seems to be the 78.6% level at 24708, as the index flirts with bear market territory.
HSI1!

HK Hang Seng Index bearing the bruntThe HSI is bearing the brunt of the China regulatory actions, as equites are being dumped. A second day down, slightly more than yesterday's magnitude, brings the technicals bearish and suggest more downside to follow until the next support.
HODL!

HANG SENG INDEX Will Go Down! Sell!
Hello,Traders!
HSI is trading below a strong horizontal resistance
That was established 4 months ago
And once the index retested the level
We saw a nice bearish reaction
Given the renewed lockdowns in some parts of China
Together with the 2nd biggest port brought to a halt
And the persistent news of the Radioactive leak In the Southern Provinces
The sentiment isn't optimistic
And the date on sales of cars and smartphones China confirms that
All of that combined make a bearish correction very real
And the target is near the previous low that stands at -4%
Vis a vis the current levels
Sell!
Like, comment and subscribe to boost your trading!
See other ideas below too!

HSI1! 2021 June 21 Week (Intraday)
HSI1!
HSI1! 2021 June 21 Week (Intraday)
Market has made lower high and we can now visualize a down channel.
Intermittent support at 28441.
Scenario:
1) Short opportunity if price returns to test 28751 - 28655 region
2) Wait for price reaction at red/green zone before taking position.

[HK50 Short] 8 June, 2021 - Roger V Trading Ideas08/06/2021
HK50
Entry Resistance level idea:
Range between 30250 to 30800 Resistance
TP Support level idea:
1st aim: 29000
Final aim: 26720
Final SL for all Short positions:
31315 Resistance Level
Comments:
RVTA trading ideas on HK50, looking at the monthly chart, we can see multiple candlestick has formed in a consolidation queue. This shows that in the long term trend, if it get resisted in between 30250 to 30800 resistance level, the main direction for HK50 will go in a bearish trend over at least 3-6 months time from the date 8/6/2021 writing this trading idea.
However, if it was to break the final SL of RVTA trading ideas of 31315 resistance. As per RVTA strategy secrets, it will inversely default look long position for HK50. (Please beware of fake breakouts.)
--------------------
(Note: The forecast above is an estimation of the resistance/ support level for the entry, TP, and SL. For more precise positions will depend on the shape formed with the candlestick at the time.)
--------------------
Disclaimer: ALuoTradingJournal does not provide any personal advice or general advice. This is only a journal to keep ALuo in noting the trades and what the market is going on as a trading journal. ALuo will not take any responsibility for any profits or losses. Please trade at your own risk.
