Last bulish wave price target We got last bulish wave in 4 triangle pattern
That Price is the 98000 dollar
In the wave we have a fast momentume for give liquidity then rejected vdown price to 74000
For confirmation we shold be RD _ in histogram macd
Set your money management & stop loss actually
Harmonicsignals

The Breakout Is Closer Than You Think…NZD/USD – 1H MARKET STRUCTURE ANALYSIS
1) Current Price Structure
- Market is in a clean uptrend (higher highs & higher lows on the left side of chart).
- After the impulsive bullish leg, price has shifted into a sideways range, forming a clear consolidation between Support and Resistance.
- Micro-structure inside the range shows repeated equal highs & equal lows → compression before expansion.
2) Liquidity & Key Zones
- Resistance Zone (Top of Range): 0.5785 – 0.5805
- Multiple rejections → liquidity resting above (buy stops & breakout traps).
- Support Zone (Bottom of Range): 0.5750 – 0.5765
Consistently defended by buyers → liquidity sitting below (sell stops).
Liquidity Note:
Expect a sweep of support (fake break) before a bullish continuation — classic smart money behavior in a bullish market.
3) Today’s Market Scenario
Main Scenario (Bullish Bias – Preferred):
- Price retests the support zone
- Likely performs a liquidity sweep below the zone
- Sharp bullish rejection
- Price rotates back to resistance
- Breaks out → continuation with uptrend alignment
This matches your projected red zig-zag + final bullish impulse.
Alternative Scenario (Low Probability):
- Clear candle close below 0.5740 with no recovery → shift to bearish intraday bias.
4) Market Psychology
- The market is "resting" after a strong push → accumulation psychology.
- Smart money wants liquidity → they will likely sweep below the support to fill buy orders.
- Retail traders try to sell the range highs and buy the lows, but SM often collects their stops before moving to the real direction.
Key idea:
Range = where weak hands lose money.
Breakout = where strong hands take profits
5) Intraday Strategy (Entry – SL – TP)
BUY Setup (Aligned With Your Chart):
Entry: 0.5755 – 0.5765
Stop Loss: 0.5740 (below liquidity pocket)
TP1: 0.5795
TP2: 0.5820
TP3 (Extended): 0.5840+
Trade Management:
If price sweeps support and closes back above → BUY confirmation.
If price closes below → invalidate bullish setup and reassess.

When an Uptrend Breaks..Smart Money Doesn’t Hesitate📉 XAUUSD MARKET OUTLOOK (1H)
- Gold has officially transitioned from its previous rising channel into a clear downtrend structure, marked by lower highs, lower lows, and a decisive break below the rising support line. The bullish momentum has faded, and sellers are gradually taking control.
- Price is now moving inside a descending correction channel, and every rally is being absorbed by supply — a textbook shift from accumulation to distribution.
1️⃣ Uptrend Channel Has Been Broken
Gold traded for several days inside a rising channel, respecting both support and resistance.
But price has now:
- Broken below the rising trendline
- Retested it and failed
- Formed a new bearish structure
This confirms the end of the previous bullish phase.
2️⃣ Strong Resistance Zone Holding Firm
The resistance zone around 4,235 – 4,245 has rejected price multiple times.
Each rejection produced:
- Lower swing highs
- Increasing bearish pressure
- Momentum shift toward sellers
This zone is now the ceiling of the new downtrend.
3️⃣ Descending Channel Signals Bearish Continuation
- Price is currently moving cleanly inside a downward-sloping channel.
- Every bounce is shallow → every drop is sharp.
- This is the behavior of a market controlled by sellers.
If the current corrective bounce fails at the upper boundary of the channel, another hard leg down is highly likely.
4️⃣ Key Target: Strong Support Zone Below
The next major liquidity area lies at the 4,105 – 4,120 strong support zone.
This is where buyers previously stepped in aggressively.
If price reaches this zone again, expect:
- Either a strong bullish reaction
- Or a deeper breakdown if momentum remains heavy
➡️ Primary Scenario (High Probability)
Retest of the channel top → rejection → bearish continuation into 4,105 – 4,120 zone.
Sellers remain in control as long as price stays under the broken trendline.
⚠️ Risk Scenario
A clean breakout above the descending channel may trigger a temporary bullish correction, but the overall structure remains bearish unless price reclaims the old resistance zone.
What’s your take on gold’s trend shift?

Gold 4H – Bearish Harmonic Rejection SetupGold is currently testing a major descending trendline drawn from the previous swing high (Point A). Price has tapped into a strong supply zone / rejection block around 4150–4170, which also aligns with the 0.618 and 0.70 Fibonacci retracement levels taken from the C–D leg projection.
The structure shows a potential harmonic completion, where the market has printed an A–B–C pattern and is now forming the final leg toward D. The repeated rejections from the shaded supply zone indicate weakening bullish momentum.
As long as price remains below this supply region and fails to break the descending trendline, the setup favors a downside continuation, targeting the lower trendline support near 3800–3850, completing the projected D-leg.
Key Highlights:
Price reacting to multi-touch descending trendline
Strong supply zone (4150–4170) aligned with 0.618/0.70 fib
Bearish harmonic structure aiming for D-leg completion
Potential downside target: 3800–3850
Bias remains bearish unless price breaks and holds above the supply zone

NAS100 Rejection last 4H candle# 📊 NAS100 (SPOT NASDAQ100) Rejection TECHNICAL ANALYSIS 🎯
## Week of November 10-14, 2025 | Intraday & Swing Trade Setup
Close Price: 25,121 | Entry Point: November 8, 2025, 12:54 AM UTC+4 💹
---
## 🔍 EXECUTIVE SUMMARY - MULTI-TIMEFRAME PERSPECTIVE
The Nasdaq-100 index exhibits a compelling convergence of technical signals across all analyzed timeframes. Elliott Wave structure suggests we're navigating wave cycles with potential breakout scenarios emerging through harmonic pattern confirmations. Bollinger Bands are contracting, indicating volatility consolidation before directional expansion. RSI readings across 5M-1H timeframes show overbought extremes transitioning to neutral zones, creating premium entry opportunities for disciplined traders. Volume analysis reveals institutional interest patterns correlating with Ichimoku Cloud positioning.
---
## 📈 TIMEFRAME-BY-TIMEFRAME ANALYSIS
### 5-MINUTE (Intraday Scalping) ⚡
Candle Pattern: Japanese candlesticks reveal micro-trend reversals with consecutive hammer formations suggesting buyer rejection zones. Evening Star patterns detected at resistance levels.
Elliott Wave: Sub-wave completion suggests wave 4 consolidation before wave 5 impulse move. Wave structure favors breakout traders targeting 25,280-25,420 resistance confluence.
Bollinger Bands: Middle band acts as dynamic support; lower band rejection patterns create high-probability short setups. Band squeeze indicating imminent volatility breakout.
RSI (14): Oscillating between 35-65 range—avoiding extremes. Divergences between price highs and RSI highs signal potential reversals at 25,180 and 25,240 levels.
Support & Resistance: Micro S/R zones at 25,095 | 25,140 | 25,180 | 25,220 | 25,280. Volume nodes clustered around 25,150.
VWAP: Price oscillating around session VWAP—each touch generates scalp opportunity. Aggressive traders fade upper band extremes.
### 15-MINUTE (Quick Swing) 🎢
Candlestick Analysis: Three-candle patterns emerging—flag continuation structures with potential for 60-80 pip breakouts. Engulfing bars confirming directional bias shifts.
Harmonic Patterns: Gartley Pattern formation detected—potential reversal zone (PRZ) at 25,165-25,195. Risk-reward ratio favorable at 1:2.5 for harmonic traders.
Wyckoff Theory: Accumulation phase evident with volume concentration and price consolidation. Distribution signs emerging—caution at resistance clusters.
Bollinger Bands: Band squeeze tightening—historical data shows 40-120 pip moves follow. Upper band resistance at 25,285; lower band support at 25,085.
Volume Analysis: Volume profile reveals point of control (POC) at 25,140—high-probability rejection zone. Volume surge required for breakout confirmation above 25,250.
Ichimoku Cloud: Price above cloud (bullish). Tenkan-sen at 25,205 acts as dynamic support. Kijun-sen (25,160) provides secondary support for pullback traders.
### 30-MINUTE (Intraday Swing) 🔄
Pattern Formation: Symmetrical Triangle formation with apex target at 25,290. Ascending triangle variant shows bullish bias—breakout above 25,270 targets 25,380-25,420 extension.
Dow Theory: Confirming higher highs & higher lows structure. Secondary trend remains bullish; pullbacks to moving average (EMA 20) present optimal entry zones.
RSI Divergence: Positive RSI divergence confirmed—price making lower lows while RSI forms higher lows at 42 level. Classic reversal setup targeting 25,260 minimum.
Exponential Moving Average: EMA 9 above EMA 21—bullish alignment. Price hugging EMA 9 (25,125) indicates strong intraday uptrend. EMA 50 (25,080) provides stop-loss anchor.
Support Zones: 25,080 (EMA 50) | 25,120 (EMA 9) | 25,160 (Kijun-sen) | 25,200 (Demand Zone)
Resistance Zones: 25,250 (Breakout trigger) | 25,290 (Triangle apex) | 25,350 (Weekly resistance)
### 1-HOUR (Core Swing Trade) 🎯
Elliott Wave Complete Picture: Primary trend shows potential Wave 3 completion near 25,350. Wave 4 correction (current consolidation) targeting 25,140-25,180 support zone. Wave 5 breakout anticipated—target: 25,450-25,520.
Pennant Pattern: Bullish Pennant formation within consolidation—breakout confirmation above 25,280 validates pattern. Minimum target: 25,450 (measured move from pole).
Bollinger Bands (1H): Upper band at 25,380 represents squeeze breakout target. Middle band (25,200) = bullish support. Lower band rejection creates risk-reward optimization point.
VWAP Daily: Price trading above VWAP—bullish gradient confirmed. Each hourly candle close above VWAP strengthens trend continuation probability. Rejection below VWAP = caution signal.
Volume Profile: Heavily traded at 25,150-25,180 (support) and 25,240-25,280 (resistance). Imbalances favor upside—low volume zone above 25,300 suggesting vacuum to fill.
Ichimoku Alignment: Price above Senkou Span A & B—cloud thickness indicates strong support. Chikou Span lag above candles = bullish confirmation. Cloud color shift (bullish green) reinforces uptrend.
Gann Theory: 45-degree angle trendline from swing low confirms rally angle. Resistance at 38.2% Fibonacci extension (25,280) precedes aggressive breakout phase.
### 4-HOUR (Swing Trade Foundation) 💼
Daily Chart Alignment: 4H timeframe shows potential Inverse Head & Shoulders pattern—right shoulder completing (current zone: 25,120-25,180). Breakout above 25,280 neckline targets 25,450-25,520 extension.
Wyckoff Accumulation: Institutional buying evident—small barometer move (SBM) triggers accumulation phase. Spring tests below support anticipated 25,080-25,100 zone.
RSI 4H: RSI at 54-60 range—neutral bullish. Still room for upside extension without extreme overbought. RSI above 70 targets 25,350+. Below 30 requires defensive posturing.
Cup & Handle Pattern: Potential bullish Cup formation completing—handle stabilization near 25,150-25,200. Breakout above handle (25,280) targets cup depth extension = 25,420.
EMA Ribbon: EMA 8, 13, 21, 50, 200 = bullish alignment. Compression and expansion cycles indicate momentum phases. Ribbon support at 25,120 = critical hold level.
Support Tiers 4H: 25,050 (structural) | 25,120 (EMA 8) | 25,160 (EMA 21) | 25,200 (demand cluster)
Resistance Tiers 4H: 25,280 (key breakout) | 25,350 (extension) | 25,420 (major target) | 25,500 (weekly projection)
### DAILY CHART (Swing Trade Thesis) 📅
Macro Elliott Wave: We're potentially in Wave 3 of a larger cycle—still room for aggressive expansion. Wave structure favors break of 25,350 targeting 25,500-25,650 daily close.
Double Bottom Recognition: Historical pattern shows Double Bottom formation near 25,000 support—confirmed breakthrough above 25,250 neckline triggered. Second target near 25,450-25,500.
Bollinger Bands Daily: Upper band at 25,480 = realistic daily target. Mean (25,200) = healthy pullback support. Band slope indicates volatility expansion—expect 250-400 pip daily ranges.
Volume Signature: Daily volume profile shows strong buying volume bar at 25,050-25,100 zone (institutional accumulation marker). Selling volume decreasing—demand controlling.
Ichimoku Daily: Cloud thickness growing—bullish trend strengthening. Cloud support around 25,150-25,200. Kumo Breakout anticipated—targets cloud top edge at 25,350-25,420.
Harmonic Analysis: Butterfly Pattern potential completion—PRZ at 25,280-25,320 suggests reversal zone OR breakout confirmation. Confluence amplifies probability.
Gann Angles & Fibonacci: 50% retracement (25,100) + 61.8% extension (25,420) = key reversal zones. Gann fan angles suggest 25,350-25,400 as structural resistance before continuation.
Key Daily Support: 25,000 (psychological/structural) | 25,050 (accumulation) | 25,140 (weekly midpoint) | 25,200 (demand zone)
Key Daily Resistance: 25,280 (breakout trigger) | 25,350 (extension) | 25,420 (measured move) | 25,500 (weekly target)
---
## 🎪 TRADING SETUP PLAYBOOK - NOV 10-14
### BULLISH SCENARIO (Probability: 72%) ✅
Trigger: 4H candle close above 25,280 + volume surge + RSI above 55
Entry Zone: 25,200-25,250 (with breakout confirmation)
Target 1: 25,350 | Target 2: 25,420 | Target 3: 25,500
Stop Loss: 25,120 (below EMA support)
Risk/Reward: 1:2.8 (excellent entry)
### BEARISH SCENARIO (Probability: 28%) ⚠️
Trigger: Daily close below 25,200 + volume increase + RSI divergence
Entry Zone: 25,280-25,300 (short setup)
Target 1: 25,200 | Target 2: 25,140 | Target 3: 25,050
Stop Loss: 25,350 (above resistance)
Risk/Reward: 1:2.1 (acceptable but lower probability)
---
## ⚠️ VOLATILITY & OVERBOUGHT/OVERSOLD CONDITIONS
Current Volatility Status: Moderate compression → Expect expansion soon
5M/15M: RSI in 40-65 range (neutral)—room for 25-40 pip moves
30M/1H: RSI near 55-60 (bullish bias, not extreme)
4H: RSI 54-62 range—still room to run without overbought
Daily: RSI 58-68 (approaching caution zone)—be defensive if daily RSI>75
Overbought Recognition Points:
Watch for RSI>75 combined with Band upper rejection + Ichimoku cloud top break fails. Take profits on technical extremes.
Oversold Setups:
RSI<30 on 1H + price below EMA 50 = high-probability bounce back to 25,200-25,250.
---
## 🎯 ENTRY & EXIT OPTIMIZATION
### OPTIMAL ENTRY TIMING
For Bullish Scalpers (5M): RSI bounce from 40-45 zone after Band lower touch = 15-25 pip scalp target
For Swing Traders (15M-30M): 15M candle close above 25,250 with 4H alignment = 60-120 pip swing target
For Core Swings (1H-4H): 4H pennant breakout above 25,280 on volume = 150-300+ pip target (hold 24-48 hours)
For Position Traders (Daily): Daily close above 25,350 = continuation play targeting 25,500-25,650 (hold 5-7 days)
### EXIT STRATEGIES
Take Profit Levels: 1. Fibonacci 38.2% = 25,280 | 2. Harmonic PRZ = 25,320 | 3. Daily Band upper = 25,420 | 4. Weekly target = 25,500
Stop Loss Placement: Below most recent swing low + 10 pips (risk management priority)
Trailing Stops: Activate at 25,350—trail with 40-50 pip buffer for 4H+ trades
Breakeven Exit: Move stops to entry after 1:1 risk/reward achieved—reduce emotional trading
---
## 🔔 REVERSAL & BREAKOUT RECOGNITION CHECKLIST
### REVERSAL SIGNALS TO WATCH:
RSI divergence (lower highs on price, higher lows on indicator)
Candlestick engulfing patterns at resistance/support zones
Volume breakdown (declining volume on breakout attempts)
Ichimoku Cloud rejection (price fails to penetrate cloud layer)
Harmonic pattern completion (Gartley/Butterfly PRZ exact hit)
Elliott Wave 5th wave failure (truncation pattern)
### BREAKOUT CONFIRMATION RULES:
Close beyond resistance on high volume (>20% volume increase)
RSI confirms breakout direction (above 55 for bullish, below 45 for bearish)
VWAP crosses align with directional move
Bollinger Band breakout with band expansion (squeeze release)
Multiple timeframe confluence (5M + 15M + 1H aligned)
Ichimoku Cloud break (price clears all clouds smoothly)
---
## 💡 WEEK FORECAST SUMMARY - NOV 10-14
Monday (10th): Consolidation continuation—watch for range break direction. European open volatility catalyst expected.
Tuesday-Wednesday: Breakout window opens—25,280 represents key decision point. Expect 150-250 pip daily moves.
Thursday: Potential pullback/consolidation after breakout (profit-taking). Support retest of 25,250-25,200.
Friday (14th): Weekly close pattern formation—extension run anticipated if above 25,350. Week target: 25,420-25,500.
---
## 📍 CRITICAL CONFLUENCE ZONES
25,080-25,100: Major support (accumulation zone, Wyckoff spring testing area)
25,140-25,180: Secondary support (EMA 9, Ichimoku, volume POC)
25,200-25,250: Entry zone (demand cluster, Cup handle support)
25,280-25,320: KEY BREAKOUT ZONE (all timeframe resistance, harmonic confluence)
25,350-25,420: Primary upside target (Elliott Wave 5, daily Band, measured move extension)
25,500+: Weekly resistance/extension target
---
## 🏆 RISK MANAGEMENT SUMMARY
✅ Never risk >2% account per trade
✅ Use 1:2+ risk/reward minimum on all entries
✅ Scale profits at 1:1 and 1:2 levels
✅ Maintain tight stops (10-15 pips on 1H trades)
✅ Avoid breakout FOMO—wait for close confirmation
✅ Respect daily support zones—psychological holds matter
---
## #TRADINGSETUP #NAS100 #TECHNICALANALYSIS #NASDAQ100
#ELLIOTTWAVE #HARMONICPATTERN #BREAKOUTTRADING #SWINGTRADER
#DAYTRADING #INTRADAY #FOREX #TRADING #ANALYSIS #TRADINGVIEW
#BOLLINGER BANDS #RSI #ICHIMOKU #VWAP #TRADINGSTRATEGY
#WYCKOFFMETHOD #GANNTHEORY #DOWTHEORY #TECHNICALS
#SUPPORTANDRESISTANCE #VOLUMEANALYSIS #OVERBOUGHT #OVERSOLD
---
Disclaimer: This analysis is educational only. Always conduct your own research and use appropriate risk management. Past performance ≠ future results. Trade at your own risk.
Analysis Created: November 8, 2025 | Valid Through: November 14, 2025

Making HH HL.HAEL
CMP 25.32 (17-09-2025)
Making HH HL.
Took Support from a very important level of 21 - 22.
It has the potential to touch 30 & then 35.
& if 35.50 is Crossed & Sustained with Good Volumes,
it may touch 45 - 47.
However, breaking 20 this time will bring more selling
pressure.

Research Shows That Trading Harmonic Pattern Could Improve IQ. Hey everyone, in this video, I broke down a fantastic trading setup on the EUR/USD pair using harmonic patterns. I love trading harmonics because it constantly challenges your IQ and makes you a smarter, more analytical trader.
I focused on my three-step framework that I apply to any pair:
Key Level: First, I identified a crucial order block on the higher time frame (weekly). This is our potential reversal zone.
Harmonic Pattern: Next, I moved to the 4-hour and daily charts to find a harmonic pattern aligned with that key level. I found a beautiful bearish Butterfly pattern. It's crucial to match the pattern with the trend—since the overall structure was bullish, we looked for an extension pattern (like the Butterfly) into the key level, not a retracement pattern.
Liquidity Sweep & Entry: The final step was confirming the setup. We waited for a liquidity sweep (a break of the Previous Daily High - PDH) and then a close below a key bullish candle. Entry is on the retest of that break, with a stop loss placed just above the key level.
I showed how the Fibonacci measurements (the 1.272 and 2.0 extensions) converged perfectly in the Potential Reversal Zone (PRZ), making it a high-probability trade. We also discussed profit targets and how to manage the trade by moving stop losses to maximize profits.
This exact same process is what I've used successfully on pairs like GBP/JPY, USD/JPY, and indices like the German 40. It's a structured, repeatable method that filters out market noise.
If you have any questions, drop them in the comments below! Don't forget to like, subscribe, and watch out for more videos like this.
Happy trading!

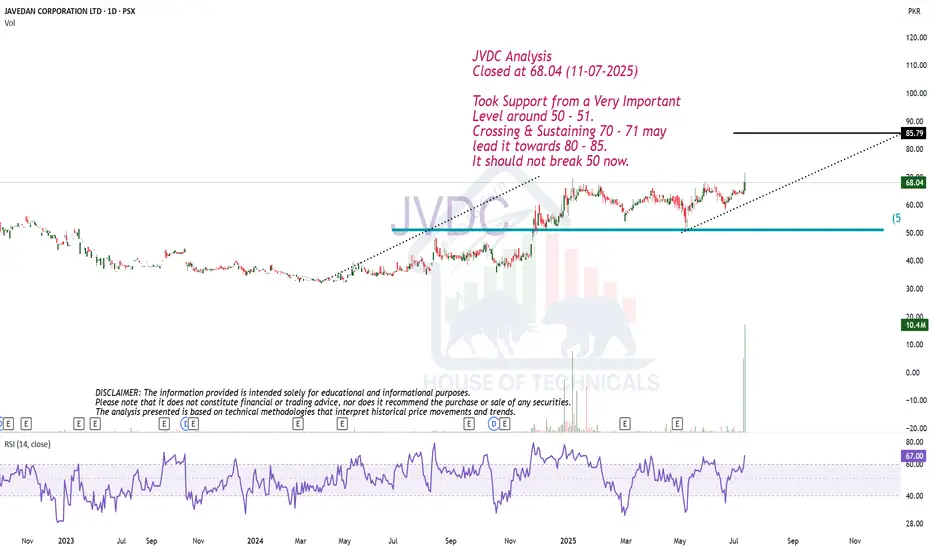
ABCD Possible.JVDC Analysis
Closed at 68.04 (11-07-2025)
Took Support from a Very Important
Level around 50 - 51.
Crossing & Sustaining 70 - 71 may
lead it towards 80 - 85.
It should not break 50 now.
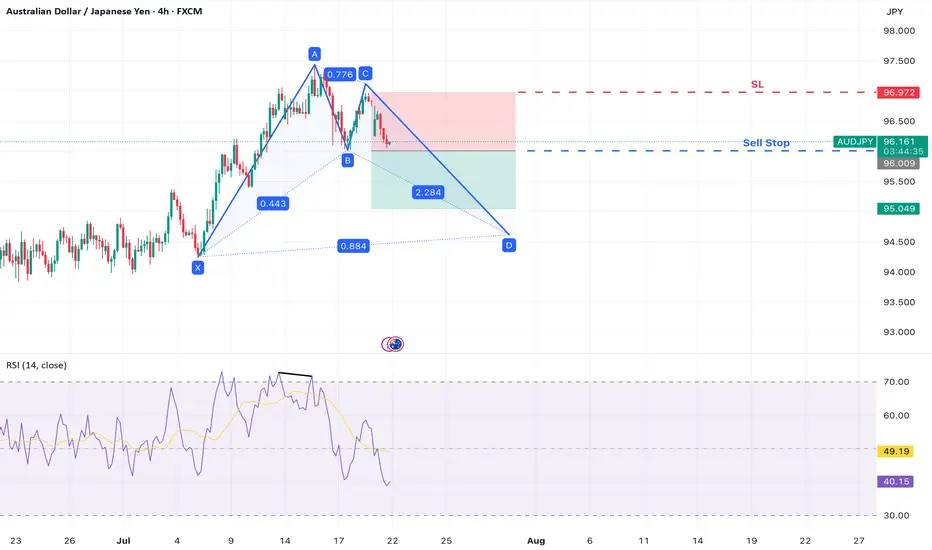
AUD/JPY – Bearish Move Within Bullish Bat StructureAUD/JPY is developing a Bullish Bat harmonic pattern on the 4-hour chart . While the full pattern has not yet completed, a potential short-term bearish opportunity is emerging as the pair begins forming the CD leg.
A clear b earish divergence on the RSI at Point A suggests waning bullish momentum, and a break below Point B may confirm the start of the final leg down toward Point D , completing the harmonic structure.
Trade Setup
Sell Stop Entry: 96.009 (break of Point B – confirms CD leg underway)
Stop Loss: 96.978 (above Point C – invalidates CD leg projection)
Take Profit 1: 95.040 (1:1 risk-to-reward level)
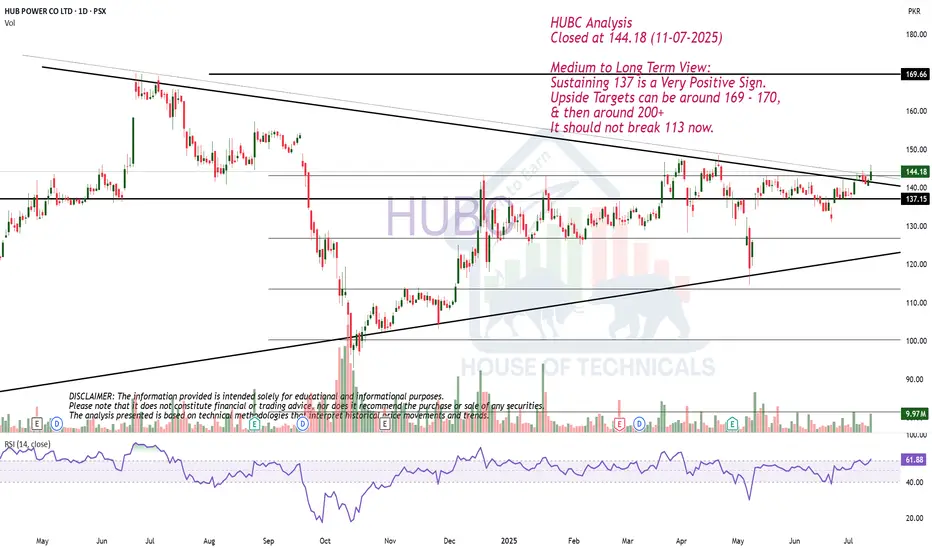
Medium to Long Term View.HUBC Analysis
Closed at 144.18 (11-07-2025)
Medium to Long Term View:
Sustaining 137 is a Very Positive Sign.
Upside Targets can be around 169 - 170,
& then around 200+
It should not break 113 now.
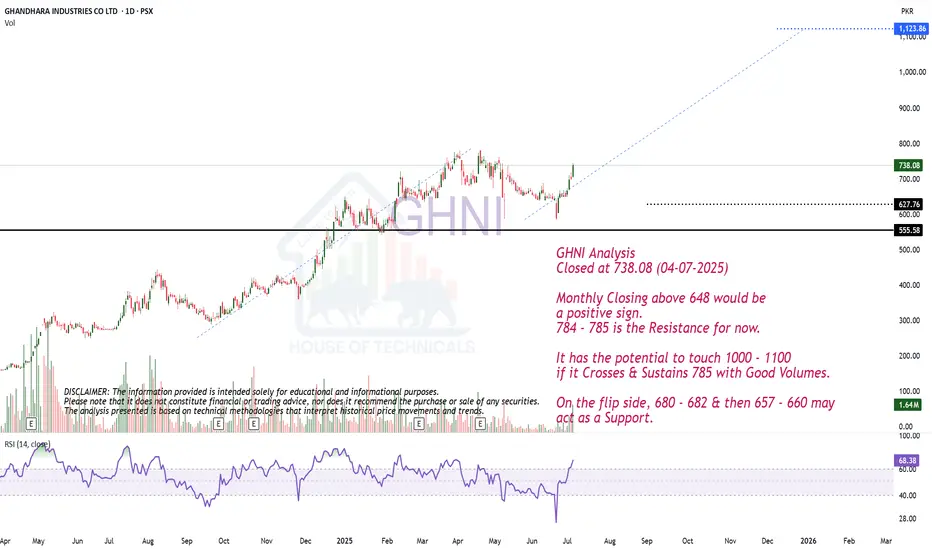
ABCD PatternGHNI Analysis
Closed at 738.08 (04-07-2025)
Monthly Closing above 648 would be
a positive sign.
784 - 785 is the Resistance for now.
It has the potential to touch 1000 - 1100
if it Crosses & Sustains 785 with Good Volumes.
On the flip side, 680 - 682 & then 657 - 660 may
act as a Support.
SP500 - Cycle Analysis; New V-Bottom24 Dec 2018 - V-Bottom Trough:
This marks a clean V-bottom. Both the 227-ROC and 114-ROC showed simultaneous positive acceleration after price reacing its low. Shortly after, both crossed their 57-SMA almost in sync — increasing the probability of a sustained bullish move. Price confirmed this by breaking resistance and forming a V pattern. This was further validated by the centered moving average crossover (114-CMA crossing above 227-CMA).
25 Mar 2020 - Deep COVID Crash Trough:
During this phase the priced broke below the support, creating a deep trough. Altough both ROC lines initially showed strong negative acceleration due to the COVID-19 crash, they soon reversed above their 57-SMAs, signaling a major shift in momentum. This coincided with the price breaking above the key resistance which was also crossed in 2019 when confirming the old V-pattern. After this breakout, a brief pullback followed before the uptrend resumed with increasing strength.
22 Jun 2021 to 19 Dec 2023 - Pattern
During the initial period a bearish divergence was visible in the ROC, nevertheless price and rate of change both declined making a low in early October 2022. A technical pattern began to form, which appears to align more closely with a symmetrical triangle; So when measuring its height and projecting it from the breakout point aligns with the new all-time highs that were reached on 27 June 2025.
21 Mar 2025 - New Cycle Trough
A new V-bottom formed shortly after the current cycle began. Both ROC indicators had already crossed their SMAs to the upside, showing early signs of positive acceleration, days before of price broke through the resistance and reached the new record high.
The 227-SMA is likely to cross from below the fast SMA while a possibility of a pullback increase.
Following that, the 114-CMA will probably has the chance to cross back the 227-CMA, with the price potentially confirming a new support level and resuming its uptrend - in line with the broader cycle timeline.

Beautiful ABCD pattern appearing on bigger tf.Beautiful ABCD pattern appearing on
bigger tf.
Crossing 101 - 102 with Good Volumes may
trigger new highs towards 120 atleast.
78 - 80 is an Immediate Resistance area.
On the flip side, a Very Strong Support is
around 68 - 70 & then around 62 - 63

EURAUD - Bearish Trend to Start - Harmonic + Divergence ComboHello Friends, Market after making series of HH and HLs, have finally made a fantastic Bearish Divergence on 1H time frame which is clear sign of correction.
Further market has almost completed AB=CD harmonic pattern, which is suggesting Potential Reversal Point as marked.
these confluences suggest a bearish trend to start
We are waiting for the neckline (HL) to break with a good candle and then we enter into the market with TP1 and TP2 with a R:R of 1:1 and 1:2 respectively. Further, place stoploss slightly above the HH.

Good Stock for Medium to Long TermClosed at 181.52 (05-06-2025)
Printed HH on Daily tf.
Should retrace towards 177 - 178
& then may be around 165 -166 to print
HL.
188 - 195 is the resistance for now that
needs to be sustained.
Crossing this may move the price towards
235 - 236.
Medium to Long term target can be around
290 - 300 if 260 is crossed with Good Volumes.

GBPJPY - Formation of Gartley Bearish Pattern Market is forming Gartley Pattern - We can enter into the market upon formation of any bearish candle-

AUDUSD BULLISH RUNAUDUSD is expected to buy to complete the Deep crab pattern. With higher than expected CPI figures AUD is expected to bully the green-back which is struggling with low interest rate figures as a result of declining inflation figures nearing its 2024 inflation target of 2% and global trade wars.
expecting AUDUSD to hit around0.66000 psychological level

NZDUSD BUYSNZDUSD is expected to buy to complete the crab pattern around 0.61200 psychological level BOUNCING FROM A 1HR FVG(Fair value Gap). we saw an expected rate cut of NZD interest rate at 25 basis point(0.25%) was was a dovish stand by the central bank. with investment sentiment still high on risk-on assets, I expect nzd to bully the green-back which is struggling with low interest rate figures as a result of declining inflation figures nearing its 2024 inflation target of 2% and global trade wars.

NZDJPY Analysis Potential Temporal Sell for Continous Buy
I just conducted a very powerful analysis on NZDJPY. Please watch the video to learn more.
Also remember to drop your comment below this video, thank you all.


