Potential Harmonic Butterfly Possibility in #SOLThe "Harmonic Patterns with Potential Detection" indicator on #SOL has detected a potential Harmonic Butterfly pattern. The potential target for point D is $146.23, and the stop-loss level is $129. It has a good profit/loss ratio.
Notes: I conducted this analysis using the Harmonic Patterns with Potential Detection indicator that I created. This is purely for informational purposes, and I hope it will be helpful to you as well. However, I recommend that you make your final decision based on your own analysis. Wishing everyone profitable trades.
Harmonictraders

BITCOIN — THE MARKET IS APPROACHING ITS REAL DECISION POINTTraders,
We dumped. Now Bitcoin is grinding through a controlled recovery. The important question is not simply if we move higher. The real question is where the market will reveal its true intention. The chart is giving us a very clean map and the next major decision point is already forming.
1. The structure so far
Bitcoin sold off aggressively, found real buyers, and reclaimed the breakdown wick. That reclaim shows that the low was bought by spot demand rather than mechanical short covering.
Price is now pushing into a zone where the next expansion will be decided. The recovery itself is not the interesting part. The levels above and below are.
2. The major checkpoint above: 104k to 105k
This zone is extremely important. Two strong pieces of confluence meet here:
The 0.886 of the A to B retracement
The 1.618 extension of the impulse move you marked with the arrows
This creates a clean Potential Reversal Zone.
What this means:
If the market rejects 104k to 105k structurally, the next major destination becomes the lower imbalance cluster around 64k. That would be a true higher timeframe unwind because the entire path down is filled with thin volume and inefficient price action.
If Bitcoin breaks above 105k with flow support, then the next magnets open up immediately.
3. Targets above
If price accepts above the 104k to 105k PRZ:
First target area
Around 116k to 118k where we have a liquidity pocket and HTF inefficiencies.
Second target area
123k to 125k where a swing failure pattern is very likely. This is a weak high with resting liquidity and a natural magnet for price during bullish expansions.
At target two I expect the first serious reaction because of the liquidity sitting above the weak high.
4. Order flow confirms accumulation not distribution
Looking at the CVD grids:
Spot CVD is trending lower while price holds steady. This is a sign of absorption because someone is taking the other side of the selling.
Stablecoin margined CVD continues lower but without price following.
Coin margined CVD is sweeping lows with no breakdown in price.
This creates a hidden bullish divergence across the board.
Open interest also supports this view:
Stablecoin margined OI remains high which means traders did not exit during the dump.
Coin margined OI is slowly building which often appears before directional expansion.
This is not the profile of a market preparing for distribution. It is the profile of a market preparing for a move.
5. CME chart: AVWAP support from the last major swing
On CME, the AVWAP anchored from the previous major swing low to swing high is still holding as support. CME often leads during inflection zones. As long as this AVWAP holds, the market is positioned in a continuation PRZ rather than a breakdown PRZ.
If CME loses this AVWAP, the cascade scenario strengthens. As long as it holds, the bullish structure remains intact.
6. What happens if we break down instead
if Bitcoin fails to reclaim structure and breaks back down, the following levels become active:
83k to 84k
This is the shallow retrace zone and the first structural catch.
81k to 82k
This area contains the 1.113 extension and a previously unfilled FVG.
79k to 80k
This is the 1.272 level and a strong imbalance pocket.
72k to 73k
This contains the 1.414 extension and the next clean liquidity cluster.
64k
This is the 1.618 extension and the final major downside target. It aligns with the strong HTF imbalance that has never been fully tested.
A rejection from 104k to 105k can eventually lead price through these levels in sequence because the entire zone from 90k down to 70k contains thin volume. There is not much structural support built on the way up.
7. Real time confirmation tools
Watch these signals when we approach the 104k to 105k decision zone:
Spot CVD rising means continuation likelihood increases
Funding staying negative means shorts are still stuck
OI rising with price means momentum is building
CVD stalling or rolling over at 104k to 105k means rejection risk is high
CME AVWAP reclaim or failure will guide direction
If buyers hold flow above 105k, the path to 117k and then 124k is clean.
If buyers fail and we reject 105k with aggressive selling, the path down becomes active.
Final view
Bitcoin is approaching one of the most important technical levels on the chart.
We dumped on real flow.
We recovered on spot demand.
Now the market is converging toward the 104k to 105k PRZ where a true decision will be made.
Break above and the next magnets are 117k and 124k with a likely swing failure at the second target.
Reject and the lower zones activate with 64k as the eventual HTF destination.
This is the map. The levels are clear.
TLDR
BTC is recovering with spot support
104k to 105k is the major PRZ
Break above: targets at 116k to 118k and 123k to 125k
Reject here: downside levels at 83k, 82k, 80k, 73k and 64k
Order flow is showing hidden bullish divergence
CME AVWAP is holding which keeps the bullish narrative alive
The market leaves its footprints long before it shows its direction. Read the sands, follow the flow and stay prepared.
- ThetaNomad
----------------------------------------------
If you enjoy this style of analysis feel free to leave a like or comment. It lets me know you find value in these deeper structural and flow based breakdowns.
----------------------------------------------

AIXBTUSDT.P - LONG POSITION SETUP
Timeframe: 4-Hour (4H)
Analysis: Multiple signals on the price chart and oscillators indicate the potential for a strong bullish reversal.
1. Technical Analysis Confirmations:
Harmonic Pattern: The chart shows the D point of the Anti-Cypher Harmonic Pattern, which signals a bullish signal. This pattern indicates that the price will make a strong bottom reversal.
TDG Indicator: The TDG oscillator has broken above the zero line, confirming a clear upward momentum and strengthening the trend.
Support and Resistance: The price has broken above WMA50, confirming an upward trend reversal, while the TDG indicator's macro trend analysis chart is also showing positive signals.
2. Macro Analysis Confirmations:
Crypto Market: According to the macro chart, money is flowing into altcoins and the "Risk-On" mode is active. This indicates an increase in overall market risk appetite and a strong upside potential for altcoins.
Global Markets: The rise in the NASDAQ and the fall in the DXY indicate an increase in global risk appetite and a shift of capital towards risky assets.
Entry Conditions: A long position was opened at point D of the pattern and when the TDG oscillator crossed into positive territory.
Targets and Risk Management:
Target: Targets and resistance levels determined by the pattern will be monitored.
Stop-Loss: Placed just below point D of the Anti-Cypher pattern.

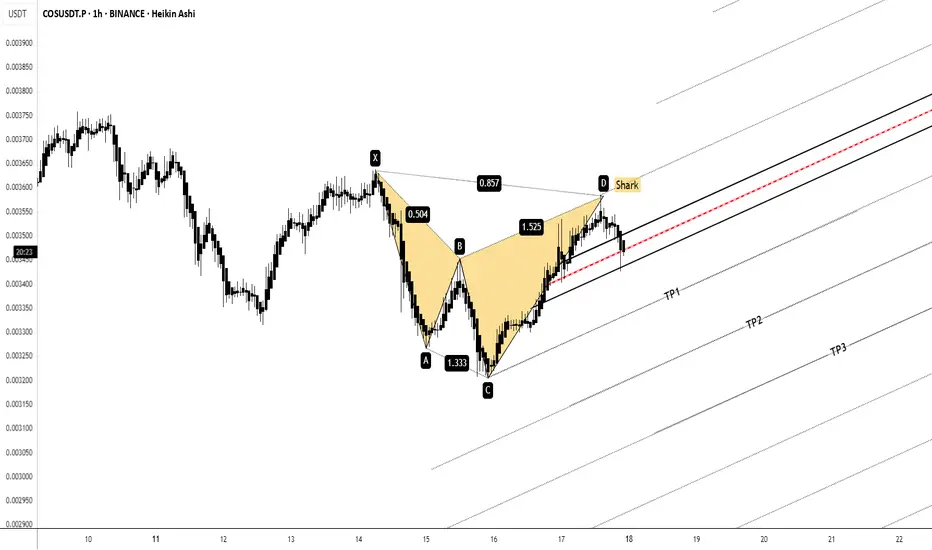
COSUSDT.P | 1H Short ThermOpening a short setup on COSUSDT.P (1H) based on the completion of a Shark harmonic pattern at point D.
🔎 Confluences:
– Shark pattern completion aligning with resistance
– TDG indicator flashing bearish momentum (Sell mode)
– Market structure respecting the pitchfork channel
📉 Setup:
– Entry: Point D rejection
– Targets: TP1 → TP2 → TP3 (scaling out)
– Stop: Above X to limit risk
⚠️ This is not financial advice, just sharing my analysis for discussion.
Question: Do you guys find Shark patterns reliable compared to Bat/Crab, or do you mostly ignore them?
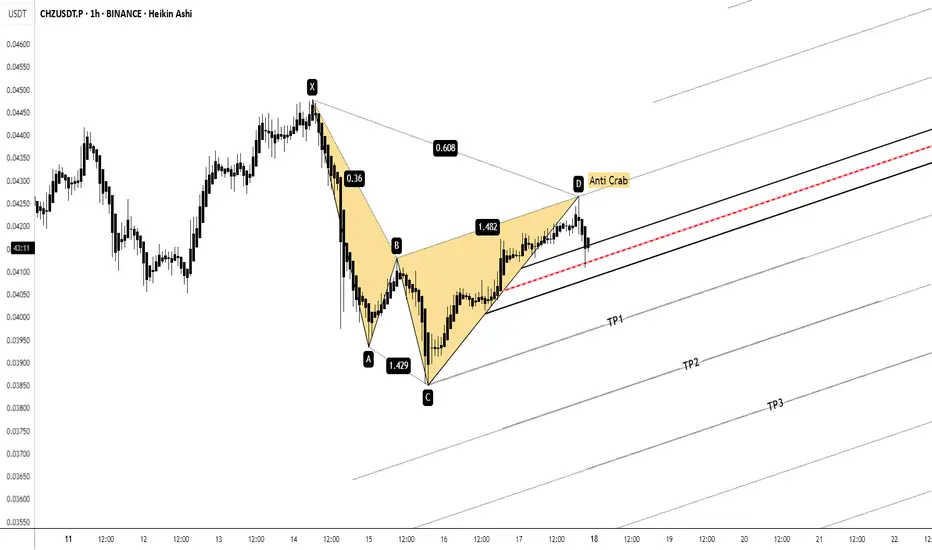
CHZUSDT.P | 1H Short ThermI’m taking a short position on CHZUSDT.P (1H) based on an Anti Crab harmonic pattern that completed at point D.
🔎 Confluences:
– Anti Crab harmonic completion at resistance
– TDG momentum indicator flipped bearish (Sell mode)
– Structure aligned with median line channel (Pulsefork)
📉 Plan:
– Entry: Point D rejection
– Targets: TP1 → TP2 → TP3 (scaling out)
– Stop: Above X to protect capital
I’m sharing this setup for discussion — not financial advice.
Curious: do you also combine harmonic patterns with custom momentum tools like TDG, or do you rely purely on price action?
BEARISH BAT ON USOIL was a huge successWhat a successful trading opportunity on usoil, the bearish bat pattern was in alignment with the weekly order block. A full video breakdown of this trade and more will be posted soon, and the link is attached to this video for you all to learn.

Beautiful ABCD pattern appearing on bigger tf.Beautiful ABCD pattern appearing on
bigger tf.
Crossing 101 - 102 with Good Volumes may
trigger new highs towards 120 atleast.
78 - 80 is an Immediate Resistance area.
On the flip side, a Very Strong Support is
around 68 - 70 & then around 62 - 63

Good Stock for Medium to Long TermClosed at 181.52 (05-06-2025)
Printed HH on Daily tf.
Should retrace towards 177 - 178
& then may be around 165 -166 to print
HL.
188 - 195 is the resistance for now that
needs to be sustained.
Crossing this may move the price towards
235 - 236.
Medium to Long term target can be around
290 - 300 if 260 is crossed with Good Volumes.

INFY 1H Chart Analysis (Bullish Bat + Falling Wedge)NSE:INFY
INFY 1H Chart Analysis (Bullish Bat + Falling Wedge)
In this 1-hour chart of Infosys Ltd (NSE: INFY), a Bullish Bat Harmonic Pattern has completed at point D, suggesting a potential reversal zone. Additionally, a falling wedge formation adds to the bullish confluence.
1. Pattern Structure:
The chart displays a complete Bullish Bat Pattern (X-A-B-C-D).
Point D aligns with the PRZ (Potential Reversal Zone), with a CD leg extending \~1.618 of BC, supporting a bullish reversal.
2. Falling Wedge Pattern;
A falling wedge, generally a bullish pattern, has formed from point C to D.
A breakout above the wedge trendline may confirm a bullish move.
3. Price Action:
The price is testing the upper boundary of the wedge.
Buying interest is visible at the P,R,Z near ₹1,540–₹1,545.
Trade Plan:
Buy Entry: Above ₹1,555 (confirmation breakout above wedge)
Stop Loss: Below ₹1,538 (beneath point D and wedge support)
Target 1: ₹1,568 (previous resistance)
Target 2: ₹1,611 (mid-term resistance)
Target 3: ₹1,631 (major swing high)
A strong bullish confluence exists with the harmonic pattern and falling wedge. Wait for confirmation above ₹1,555 before entering. Maintain proper risk-reward with a stop below ₹1,538.
NSE:INFY NSE:NIFTY NSE:CNXIT

GBPAUD SHORT TERM SELLS BEFORE TE BUYSGbpAUD is expected to sell for a short term correction before the major buys

AUDNZD Potential Bullish Cypher Hello guys, this is my view on AUDNZD. so I will update you guys as things progress on this trading opportunity either in a loss or in a profit.
Remember you are not in competition with anyone, is not about who is the best analyst. is all about making small/big consistent profits little by little over time.
Your personal encounter on the chart is going to be different from others. be real to yourself and trust yourself to make the right decision on the chart.
Love you all.

Navarro Harmonic & Pitchfork StrategyNavarro pattern formation is present. According to our pitchfork strategy, after the price exits the pitchfork channel, our target levels are 100%, 150% and 200% respectively. Good luck.

Gold Bearish Crab Signals Potential Reversal!FX_IDC:XAUUSD
Gold is currently testing a critical resistance zone near $2,947, where a Bearish Crab harmonic pattern has formed. This structure suggests potential downside risk as price approaches exhaustion at this key level.
🔹 Technical Breakdown:
📌 Resistance: $2,956
📌 Bearish Crab PRZ (Potential Reversal Zone): $2,947
📌 Support Levels: $2,916 → $2,795
If gold fails to break and hold above $2,947, we could see a pullback toward $2,795, aligning with the monthly fractal resistance. However, a sustained move above $2,956 would invalidate the bearish scenario, potentially opening the door for further upside.
Happy Trading,
André Cardoso
Risk Warning: Trading financial assets carries a high level of risk and may result in the loss of all your capital. Make sure to fully understand the risks involved before you start trading and carefully consider your investment objectives, level of experience, and risk tolerance. The data and information provided in this content do not constitute financial or investment advice and should not be considered as such. Only invest what you can afford to lose, and be aware of the risks associated with trading financial assets.

$BTCUSD Expansion or Reversal? Key Levels to WatchBITSTAMP:BTCUSD
Overview
We explore the key resistance and support levels, potential pattern formations, and what we should monitor in the coming sessions.
Bitcoin appears to be forming an expanding triangle within the broader range of its weekly fractals. Additionally, there is the potential emergence of a double top reversal pattern . This pattern has a critical support level at $89,164, which acts as a neckline. A breakdown below this support could threaten the weekly fractal support positioned at $91,530. If the breakdown confirms , Bitcoin may experience a significant decline, targeting the previously broken monthly fractal resistance at $73,794 , representing a potential 17% drop . This level coincides with the 200% Fibonacci extension, often seen as a default target for a double top reversal.
Despite the downside risks, a corrective move lower may provide a bullish setup. A key support level at $76,368 aligns with the 161.8% Fibonacci extension of the last bullish swing. A potential Bullish Deep Crab Pattern could form around this level, indicating a possible reversal. If Bitcoin reaches this zone, traders should monitor price reactions for signs of recovery.
Will Bitcoin break higher, or is a deeper correction on the horizon? Stay tuned for further updates!
Key Takeaways
Weekly Fractal Resistance: $109,359
Weekly Fractal Support: $91,530
Daily Fractal Resistance: $98,871 (rejecting 38.2% Fibonacci retracement at $98,314)
Daily Support: $93,340 (above weekly fractal support)
Critical Support Level: $89,164 (neckline for a potential double top)
Downside Target: $73,794 (previous monthly fractal resistance, aligning with 200% Fibonacci extension)
Bullish Reversal Zone: $76,368 (161.8% Fibonacci extension, potential Bullish Deep Crab Pattern)
It is important to remain neutral regarding bias unless the price confirms the pattern with a breakdown below the neckline. Until that happens, the market structure remains open to different scenarios, and traders should focus on confirmation signals rather than assumptions.
Happy Trading,
André Cardoso
Risk Warning: Trading financial assets carries a high level of risk and may result in the loss of all your capital. Make sure to fully understand the risks involved before you start trading and carefully consider your investment objectives, level of experience, and risk tolerance. The data and information provided in this content do not constitute financial or investment advice and should not be considered as such. Only invest what you can afford to lose, and be aware of the risks associated with trading financial assets.

S&P 500Hello & welcome to this analysis
The index has entered into the potential reversal zone (PRZ) of a Bearish Harmonic ABCD pattern suggesting a higher probability of completion of an uptrend and likely reversal.
The likelihood of reversal confirmation would require it to start sustaining below 5900 on weekly basis since this is a pattern formed in the monthly time frame.
Harmonic Patterns are based on unique structures backed by specific Fibonacci ratios.
Regards

GBPJPY LONGHarmonic Pattern Trading Strategy:
1. Combine patterns with 2-3 confirmations (e.g., MA, BB, RSI, Stoch) for increased accuracy.
2. Implement proper risk management.
3. Limit exposure to 3% of capital per trade.
4. Exercise caution: Not every Harmonic Pattern presents a good trading opportunity.
5. Conduct thorough diligence and analysis before trading.
Disciplined approach = Enhanced edge.

AUDCAD BAT PATTERNHarmonic Pattern Trading Strategy:
1. Combine patterns with 2-3 confirmations (e.g., MA, BB, RSI, Stoch) for increased accuracy.
2. Implement proper risk management.
3. Limit exposure to 3% of capital per trade.
4. Exercise caution: Not every Harmonic Pattern presents a good trading opportunity.
5. Conduct thorough diligence and analysis before trading.
Disciplined approach = Enhanced edge.

GBPCAD BAT PATTERNHarmonic Pattern Trading Strategy:
1. Combine patterns with 2-3 confirmations (e.g., MA, BB, RSI, Stoch) for increased accuracy.
2. Implement proper risk management.
3. Limit exposure to 3% of capital per trade.
4. Exercise caution: Not every Harmonic Pattern presents a good trading opportunity.
5. Conduct thorough diligence and analysis before trading.
Disciplined approach = Enhanced edge.

A Lot is Happening on Gold!While the price of Gold (XAU/USD) has been rangebound since December 2024, a possible AB=CD harmonic support zone at US$2,471 continues to call for attention. A 61.8% Fibonacci retracement ratio also complements this support at US$2,473. Investors will also likely take note of the double-top pattern around the December 2024 peak of US$2,726. The pattern’s neckline at US$2,605 has been breached, and its profit objective conveniently resides just above the AB=CD support at US$2,483.
So, two patterns indicate that a push lower could materialise before buyers attempt to step in. However, given Gold’s clear uptrend, a bullish move above the December 2024 peak also remains possible.

near is nearhello friends
Considering the pressure of the price in the triangle and the upward trend before it, we can expect its failure and get a good profit.
Don't forget capital management...
good luck

Trade Execution on EURNZD|PRZ Area of Interest Simplified I hope you got value from the video, more to come, and wishing you all a more profitable trading opportunity.

Bullish BAT Supported by Volumewe have a bullish formation of BAT pattern on NYSE:NU which is supported by relative volume.
✅ Target 1 : $14.25
✅ Target 2 : $15.07
⛔ Stop Loss: $13.5
Have a good weekend! 🫡✌️
