HBAR Bull Pennant or deeper correction?HBAR wave (2) appears to be completed at $0.122 the 0.5 Fibonacci retracement and High Volume Node support.
However, price does appear to have completed an ABC corrective wave up keeping the the wave (2) alive with a target of the S1 pivot, 'alt-coin golden pocket' 78.6 Fib retracement and High Volume Node support. The high probability terminal target area if we continue lower.
Bulls want to see the local downside action complete as a bull pennant and continue to the upside negating the ABC corrective wave.
Currently price is a below the weekly pivot, RSI is crossed bearishly at the EQ.
Upside targets remain $0.77 - $1.16 at the R3-R5 weekly pivots.
Safe trading
Hbar

HBAR Long Spot Setup – Retesting Major SupportHBAR is pulling back into a key support zone between $0.19–$0.21, a historically significant area where buyers have previously stepped in with strength. With the broader market showing signs of stabilization, this zone may offer a solid opportunity for laddered spot accumulation.
Price action shows confluence with previous demand levels, and volume is beginning to stabilize, which could signal waning selling pressure. If this level holds, a bounce toward higher resistance zones becomes likely in the coming sessions or weeks.
🔁 Trade Setup:
• Entry Zone: $0.19–$0.21 (laddered entries)
• Target 1: $0.28–$0.31
• Target 2: $0.36–$0.40
• Stop Loss: Below $0.18

HBARUSDT – Support Retest Could Spark a BounceHBAR is currently retesting a key support zone between $0.22 and $0.23, an area that has acted as a strong demand level over the past few sessions. Despite some recent pullbacks, the broader structure remains bullish, and price action suggests buyers are still defending this zone.
A successful hold here could lead to a short-term rally, with targets aligned to previous resistance levels. Risk is clearly defined, offering an attractive risk-to-reward setup for spot traders.
🔹 Trade Setup:
• Entry Zone: $0.22 – $0.23 (Support zone)
• Take Profit Targets:
🥇 $0.28 – $0.31
🥈 $0.36 – $0.40
• Stop Loss: Daily candle close below $0.21

HBAR ANALYSIS📊 #HBAR Analysis
✅There is a formation of Falling Wedge Pattern on 4HR chart with a breakout and currently trading above its major support area🧐
Pattern signals potential bullish movement incoming in few days
👀Current Price: $0.2385
🚀 Target Price: $0.2780
⚡️What to do ?
👀Keep an eye on #HBAR price action and volume. We can trade according to the chart and make some profits⚡️⚡️
#HBAR #Cryptocurrency #TechnicalAnalysis #DYOR

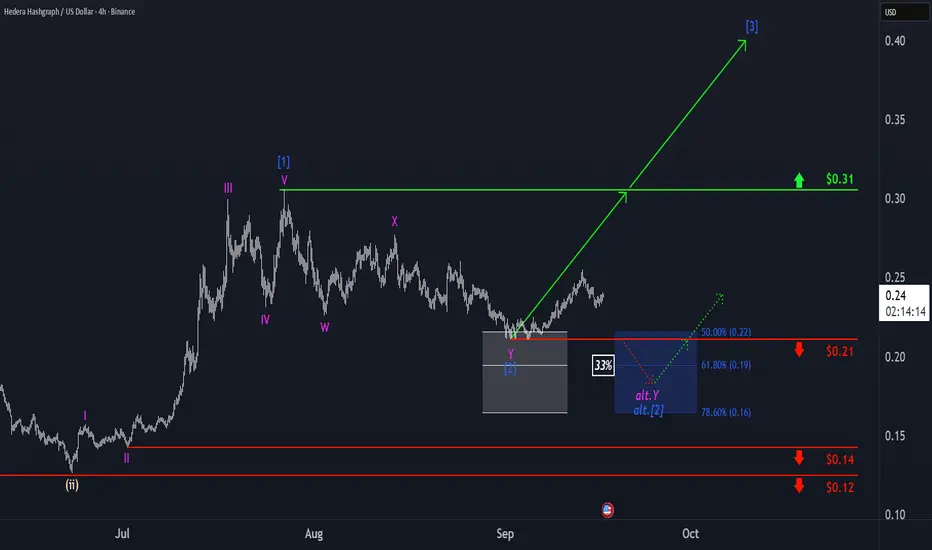
Hedera Hashgraph: Target Hit—Next Rally in SightA reversal began to emerge in the upper third of our grayed out Target Zone, prompting us to mark blue wave as complete. In the now-unfolding, same-colored wave , we anticipate gains well above resistance at $0.31. At the same time, we assign a 33% probability to a deeper low of wave alt. . In this case, however, we’d expect the reversal to happen no later than the blue (alternative) Target Zone ($0.22–$0.16), which would once again present an opportunity to initiate new long positions.
Can 2-Month High Inflows End HBAR Price’s Downtrend?
At the time of writing, Hedera is priced at $0.237, facing resistance at $0.241. The cryptocurrency has been weighed down by a two-month-old downtrend that began after it failed to break above $0.248 earlier this summer.
Given current market inflows and bullish technical indicators, HBAR is likely to bounce back from the $0.230 support. If successful, the price could retest $0.241 and possibly $0.248. Surpassing this level would officially end the ongoing downtrend.
However, if bearish sentiment intensifies, Hedera could lose its footing. A breakdown below $0.230 would expose the cryptocurrency to a fall toward $0.219. Such a move would invalidate the bullish outlook and risk extending the downtrend further.

HBARUSDCOINBASE:HBARUSD try to break 0.257$ but we hope up-trend in last reaction to 0.257$ an break this level.
Best support: 0.239 - 0.230
Best resistance: 0.257 - 0.277 - 0.292
Please control risk management⚠️

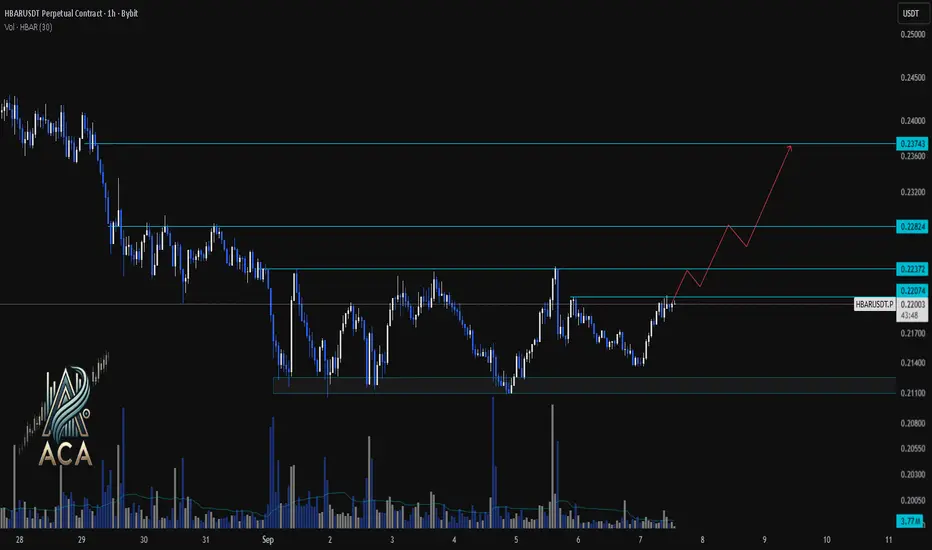
HBARUSDT 1H Chart Analysis | Bullish Structure in PlayHBARUSDT 1H Chart Analysis | Bullish Structure in Play
🔍 Let’s break down the recent price action for the HBAR/USDT perpetual contract and outline the roadmap for potential bullish continuation.
⏳ 1-Hour Overview
The 1-hour chart shows HBAR recovering from a strong demand zone near $0.21100, pushing upward with notable momentum. Price action is now challenging immediate resistance at $0.22372, with higher levels at $0.22824 and $0.23743 presenting the next bullish targets.
🔺 Long Setup:
A decisive close and hold above $0.22372 could fuel further upside, targeting the $0.22824 resistance next. Sustained bullish volume and higher lows may pave the way for an extension up to $0.23743, aligning with the drawn projection path.
📊 Key Highlights:
- Strong defense of the $0.21100 support region led to a sharp rebound.
- Immediate resistance stands at $0.22372, with the bullish path mapped toward $0.22824 and $0.23743.
- Volume spikes on upward candles indicate increasing buyer interest and potential for trend follow-through.
🚨 Conclusion:
HBARUSDT is building a bullish structure above local support, with momentum favoring continued upside if $0.22372 flips into support. Watching volume and reaction at key resistance areas remains crucial for confirming the next leg higher.
HBAR Price Ready for $0.23 Breakout? Hedera 4H Chart Targets ExpHedera HBAR is approaching a key decision point on the 4-hour chart. In this update, I outline the critical support and resistance levels that will determine whether bulls can push toward $0.23 and beyond. My bias mid-term remains for upside, but price must reclaim levels step by step before momentum can fully shift.
We also look at how Bitcoin’s resistance battle at $112,190 connects to HBAR’s outlook. If BTC sustains recovery, HBAR has room to extend toward $0.24–$0.25. If not, downside levels at $0.20 and $0.19 become the key defense lines. Watch this analysis to see what to expect next.

Squeeze is in the works. Stay tuned for the next move. Barring a major crash in the crypto sector, 40 cents is the next likely move for HBAR.
If it crosses and sustains above 40 cents, then a move to its all-time high (57 cents) is very likely.
If it breaks below the wedge, then 13 cents is the next target. 0.8 cents below that.
LONG-TERM, THIS HAS A LOT OF ROOM ABOVE.

What To Expect From HBAR Price In September 2025?At the time of writing, BINANCE:HBARUSDT trades at $0.218, down 9% over the past month. The persistent outflows suggest continued weakness, leaving the altcoin vulnerable to further decline. Should selling continue, HBAR could slip to $0.205, extending its drawdown and reinforcing bearish momentum in the short term.
Historically, September has been a poor month for BINANCE:HBARUSDT . On average, the token has declined 10% during this period, with a median drop of 5%. Based on this pattern, the probability of another drawdown remains elevated, aligning with current technical signals that highlight weakening support levels.
If inflow returns and investor sentiment improves, BINANCE:HBARUSDT could bounce back to reclaim the $0.230 support. Holding this level would be crucial for triggering recovery. A complete reversal would require the token to climb toward $0.271 or higher, signaling renewed strength after months of bearish market activity.

HBARUSD Is this a Bull Flag to 0.47500?Hedera (HBARUSD) is trading below its 1D MA50 (blue trend-line) along with the majority of the market and has found itself within a Channel Down (red) on this correction.
This correction may simply be a technical pull-back in the form of a Bull Flag. As long as the 1D MA200 (orange trend-line) holds, which is roughly where the 0.5 Fibonacci retracement level of the June move lies, we expect this Bull Flag to break upwards to at least the 2.0 Fibonacci extension, giving us a 0.47500 Target.
-------------------------------------------------------------------------------
** Please LIKE 👍, FOLLOW ✅, SHARE 🙌 and COMMENT ✍ if you enjoy this idea! Also share your ideas and charts in the comments section below! This is best way to keep it relevant, support us, keep the content here free and allow the idea to reach as many people as possible. **
-------------------------------------------------------------------------------
💸💸💸💸💸💸
👇 👇 👇 👇 👇 👇

▒H▒ HEDERA FORECAST | 6HR ▒H▒
CRYPTOCAP:HBAR
Someone was screaming about HBAR in the Cryptocurrency chat so I took a look. I am not trading this nor other ALTS. I may with a tiny amount of money here and there. I fundamentally and strongly believe in BTC and BTC only as the King. With that being said I do realize there is a need for utility based (non-meme coins). I would never trade a coin that I was not fine with losing all of the money involved (which will only be a little in these situations) or being stuck holding it for 5+ years. Which is why I will always be a Bitcoin Maximalist.
This is my forecast showing an HBAR low of $0.14 in early Oct.
============================================
An Introduction to Hedera (HBAR)
Often called the "trust layer of the internet," Hedera is a public network designed for the decentralized economy, but with a unique architecture that sets it apart from traditional blockchains.
At its core, Hedera is not built on a blockchain. Instead, it utilizes a patented consensus algorithm called Hashgraph, a type of Directed Acyclic Graph (DAG). This technology allows for incredibly high throughput (10,000+ transactions per second), near real-time finality, and the highest grade of security (aBFT), all while maintaining fair ordering of transactions and stable, low-cost fees.
What truly distinguishes Hedera is its governance model. The network is owned and overseen by the Hedera Governing Council, a rotating body of world-leading, term-limited organizations such as Google, IBM, Boeing, Dell, and LG. This model is designed to provide stable and reliable decentralized governance, ensuring the network will never fork and can be trusted by enterprises for mission-critical applications.
The native token, HBAR, serves two primary functions: it acts as fuel to pay for network services like smart contracts and transactions, and it is used to secure the network through staking.
In summary, Hedera is engineered from the ground up for mainstream, enterprise-grade adoption, prioritizing performance, security, and stable governance to power real-world decentralized applications.
I WILL BE POSTING FORECASTS FROM THE TOP TRADED ALTS IN ADDITION TO MY REGULAR BITCOIN POSTS.
COINBASE:ETHUSD
COINBASE:XRPUSD
BINANCE:BNBUSD
COINBASE:SOLUSD
COINBASE:DOGEUSDC
COINBASE:SOLUSD
CAPITALCOM:ADAUSD
COINBASE:LINKUSDC.P
DISCLAIMER
I AM NOT A FINACIAL ADVISOR, NOR AM I YOURS. THIS IS NOT FINANCIAL ADVICE. MEARLY DOODLINGS ON A MATHMATICALLY DRIVEN GRAPHICAL INTERFACE, TRACKING AN INVISIBLE 256BIT MILITARY-GRADE ENCRYPTED ASSET. . . FOR ENTERTAINMENT/AMUSEMENT PUROSES ONLY. ENJOY!

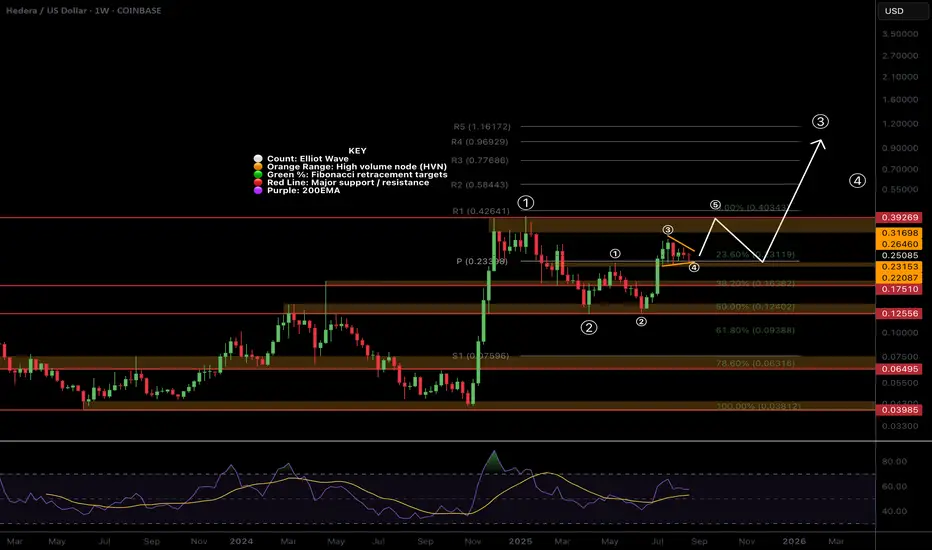
$HBAR Macro Chart - Ready for wave 5 of (1) of 3 up?CRYPTOCAP:HBAR appears to be printing a wave 4 triangle above the weekly pivot point. This implies the next move would be a terminal wave (5) of 1 of (3) likely completing with a poke above all time high to trap FOMO novice investor / traders. Classic Elliot Wave.
Wave 2 of (3) has a high probability of ending at the wave 4 triangle base which is the weekly pivot and 0.236 Fibonacci retracement adding confluence. This fib level support would indicating continued trend strength.
If it is a wave 1 of (3) is completing then we can expect the long term target to overextend the weekly R5 pivot point of $1.16, possibly reaching $3.
Weekly RSI remains at the EQ so plenty of room to grow.
Analysis is invalidated below the weekly pivot.
Safe trading
Hbar is forming a tradable structureBAR is printing many tradable structures on major timeframes. The current one is the possible bull flag with a great RR. Keeping in mind that the daily momentum and trend are still showing negative pressure. Keep your POI hand as the PA unfolds.

HBAR/USDT – Gearing Up for a Major Bullish Wave!🚀 Trade Setup Details:
🕯 #HBAR/USDT 🔼 Buy | Long 🔼
⌛️ TimeFrame: 1D
--------------------
🛡 Risk Management (Example):
🛡 Based on $10,000 Balance
🛡 Loss-Limit: 1% (Conservative)
🛡 The Signal Margin: $374.39
--------------------
☄️ En1: 0.19607 (Amount: $37.44)
☄️ En2: 0.17665 (Amount: $131.04)
☄️ En3: 0.16401 (Amount: $168.48)
☄️ En4: 0.15228 (Amount: $37.44)
--------------------
☄️ If All Entries Are Activated, Then:
☄️ Average.En: 0.17047 ($374.39)
--------------------
☑️ TP1: 0.25245 (+48.09%) (RR:1.8)
☑️ TP2: 0.305 (+78.92%) (RR:2.95)
☑️ TP3: 0.38787 (+127.53%) (RR:4.77)
☑️ TP4: 0.5266 (+208.91%) (RR:7.82)
☑️ TP5: 0.73806 (+332.96%) (RR:12.47)
☑️ TP6: Open 🔝
--------------------
❌ SL: 0.12493 (-26.71%) (-$100)
--------------------
💯 Maximum.Lev: 2X
⌛️ Trading Type: Swing Trading
‼️ Signal Risk: 🙂 Low-Risk! 🙂
🔎 Technical Analysis Breakdown:
This technical analysis is based on Price Action, Elliott waves, SMC (Smart Money Concepts), and ICT (Inner Circle Trader) concepts. All entry points, Target Points, and Stop Losses are calculated using professional mathematical formulas. As a result, you can have an optimal trade setup based on great risk management.
📊 Sentiment & Market Context:
Hedera Hashgraph (HBAR) is showing strong bullish potential on the daily timeframe, supported by increasing volume and a solid base formation around key demand zones. With broader altcoin sentiment improving and BTC showing stability, HBAR could be poised for a breakout rally in the coming weeks.
🔍 Fundamental Highlights:
HBAR powers the Hedera network, a next-gen public ledger built on a unique Hashgraph consensus mechanism—faster, more secure, and more scalable than traditional blockchains. With real-world enterprise partnerships (like Google, IBM, and Boeing), Hedera’s ecosystem continues to gain momentum as Web3 adoption expands.
⚠️ Disclaimer:
Trading involves significant risk, and past performance does not guarantee future results. This analysis is for informational purposes only and should not be considered financial advice. Always conduct your research and trade responsibly.
💡 Stay Updated:
Like this technical analysis? Follow me for more in-depth insights, technical setups, and market updates. Let's trade smarter together!

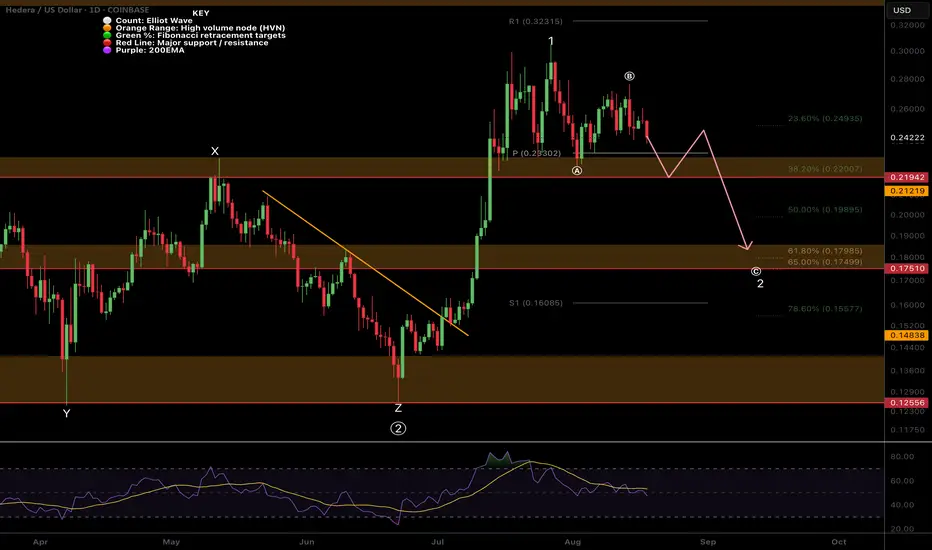
A Local look at the $HBAR retracementWave (c) appears to be underway with a target of the golden pocket and major support High Volume Node at $0.175.
There may resistance at the daily 200EMA along the way but it just seems to floating between supply and demand zones right now.
Daily RSI has room to fall.
Safe trading
HBARUSDT — Retest of Demand Zone After Breakout?HBAR/USDT is currently in a crucial retest phase after a strong breakout from its key accumulation zone around 0.199–0.217 (yellow box, Fib 0.5–0.618 area). The recent rally toward 0.29–0.30 highlighted strong buying momentum, but price is now consolidating near 0.243, suggesting a healthy pullback before the next potential move.
This structure often signals a bullish retest after breakout — but if key support levels are lost, it could trigger a deeper correction.
---
🔍 Structure & Pattern
Previous phase: HBAR traded sideways for months within a large range.
Recent move: Clean breakout above the accumulation zone.
Current phase: Retesting the demand zone.
Pattern in play: Bullish Retest / Flag Consolidation on the daily timeframe.
Bullish continuation trigger: Daily close above 0.29197 with volume confirmation.
Bearish invalidation: Daily close below 0.19928 (Fib 0.618).
---
📌 Key Technical Levels (1D)
Support (Demand Zone):
0.21707 (Fib 0.5) → first line of defense.
0.19928 (Fib 0.618) → strongest support; bullish invalidation if broken.
Resistance Levels:
0.26511 → minor resistance.
0.29197 → major resistance / breakout trigger.
0.33037 → TP1.
0.37526 → TP2.
0.40139 → local high & ultimate mid-term target.
Downside targets (if breakdown):
0.160–0.140 → prior consolidation zone.
0.093–0.087 → historical low.
---
🚀 Bullish Scenarios
1. Conservative (Breakout Buyer):
Entry: Daily close above 0.29197
Stop: Below 0.26511
Targets: 0.33037 / 0.37526
Potential reward: +35% to +54% from current levels
2. Aggressive (Buy the Dip):
Entry: 0.217–0.199 demand zone
Stop: Below 0.199 (bullish invalidation)
Targets: 0.265 / 0.292 / 0.330
Attractive R:R potential (>1:3) if demand holds
---
⚠️ Bearish Scenarios
1. Breakdown of 0.199:
Daily close below 0.199 → structure invalidated.
Downside targets: 0.16 → 0.14, and possibly 0.087 (historical low).
2. Rejection at Resistance:
Failure to break 0.292 + formation of a lower-high = possible range or distribution phase.
Price could revisit 0.217 demand zone again.
---
📈 Strategy & Risk Management
Aggressive traders: Buy dips at 0.217–0.199 with tight stops.
Conservative traders: Wait for confirmation above 0.292 before entering.
Risk management: Limit exposure to 1–2% per trade.
Extra confirmation: Watch for volume spikes or bullish candlestick reversals (hammer, engulfing) in demand zones.
---
✅ Conclusion
HBAR is in a critical demand retest. As long as 0.217–0.199 holds, the bias remains bullish, with mid-term targets at 0.33–0.37. A daily close below 0.199, however, would shift momentum bearish and open the door to a much deeper correction.
HBAR offers a high R:R opportunity for both aggressive dip buyers and conservative breakout traders — making it one of the setups to watch closely in the coming weeks.
#HBAR #HBARUSDT #Hedera #Crypto #TechnicalAnalysis #PriceAction #SwingTrade #Fibonacci

HBAR Eyes Bitcoin for Price Recovery Amid Market UncertaintyBINANCE:HBARUSDT is currently consolidating, trading at $0.255 while oscillating between $0.271 and $0.244 . The narrow range reflects investor caution, with traders awaiting external market cues. Without a decisive breakout, the altcoin may continue drifting sideways in the immediate term.
If Bitcoin strengthens and resumes its rally, BINANCE:HBARUSDT could break resistance at $0.271. Such a move may open the door for gains toward $0.291, with potential upside extending further if bullish conditions persist.
Alternatively, a Bitcoin downturn could drag BINANCE:HBARUSDT lower, pushing it beneath $0.244 support. In such a scenario, the altcoin risks falling to $0.230, undermining the bullish thesis and reinforcing caution among investors.

HBAR Bull Flag Is Ready to Explode, But Only If One Level FallsYello, Paradisers! Is #HBAR quietly setting up for its biggest breakout of the year? The chart is heating up fast, and the next move will be decisive.
💎Since forming a double bottom around $0.128, HBAR has bounced sharply, showing clear strength. The price action is now shaping into a potential bullish flag pattern, but the bulls are stuck at a critical barrier.
💎The $0.285–$0.30 zone is proving to be a major challenge, as it combines both horizontal resistance and the 61.8% Fibonacci retracement. Since mid-July, not a single daily candle has been able to close convincingly above this level, a clear sign of just how important this wall is.
💎For #HBARUSDT, a strong breakout and close above $0.30 with real volume would open the doors to a major bullish move, targeting the $0.380–$0.410 zone. This range not only marks the next strong resistance but also aligns with HBAR’s 52-week high.
💎On the downside, solid support lies between $0.235–$0.22, a zone that has held firm since mid-July within a converging triangle formation. As long as HBAR stays above this range, the bullish setup remains valid, and the breakout pressure continues to build.
Paradisers, strive for consistency, not quick profits. Treat the market as a businessman, not as a gambler.
MyCryptoParadise
iFeel the success🌴

HBAR’s ABC Setup — Short-Term Pain, Long-Term Gain?HBAR has been consolidating sideways for the past 30 days, with $0.27 acting as a clear resistance — aligning with the golden pocket (GP). Price failed to sustain above the yearly open (yOpen) at $0.26901, despite multiple attempts. Each breakout attempt lacked follow-through → weakness.
Structurally, HBAR appears to be in a corrective phase after completing five Elliott waves, and is now potentially forming an ABC corrective pattern. Price has also lost the monthly open (mOpen) at $0.25099, which should now act as resistance.
🔴 Short Opportunity
Previous ideal entry: $0.27463 (Golden Pocket) — offered an R:R of ~1:7
Next short zone: Between mOpen ($0.25099) and yOpen ($0.26901)
Target: Around $0.21/$0.2 as take-profit (TP)
🟢 Long Opportunity Zone
➡️ Primary zone: $0.21 – $0.19675
🧩 Confluence factors:
FVG (Fair Value Gap) / imbalance fill
SSL (Support/Stop-Loss liquidity) positioned in the zone
Weekly level: $0.20685
0.55 Fib retracement: $0.20657 (aligned with the weekly level)
0.75 Fib speed resistance fan: Supports this zone if price reaches it between 19 – 25 Aug
1.0 trend-based Fib extension: $0.19675 (projected Wave C target of ABC)
Pitchfork lower support line intersecting with the zone
nPOC & key level: $0.2
With all these aligning, this is the most favourable long setup.
Long Trade Setup Example
Entry: $0.21– $0.19675
Stop Loss: Below $0.19
TP1: ~$0.223
Final target: $0.3+ (swing trade potential)
R:R: 1:6+
🔍 Indicators used:
DriftLine — Pivot Open Zones → For identifying key yearly/monthly/weekly/daily opens that act as major S/R reference points
➡️ Available for free. You can find them on my profile under “Scripts” and apply them directly to your charts for extra confluence when planning your trades.
_________________________________
💬 If you found this helpful, drop a like and comment!

HBAR Price Stalls as Outflows Hit 2-Month High—What’s Next?BINANCE:HBARUSDT price is currently at $0.243 , trapped within the range of $0.244 to $0.271. The mixed market cues, including the bearish CMF and the relatively neutral RSI, suggest that HBAR could continue consolidating.
This sideways movement is expected to persist unless there is a major shift in investor sentiment or a market catalyst that could push the altcoin in either direction.
If outflows intensify and BINANCE:HBARUSDT falls below its $0.244 support level , the bearish case could become more likely. In such a scenario, the price may drop further to $0.230, invalidating the current bullish-neutral outlook and signaling a deeper correction for HBAR.
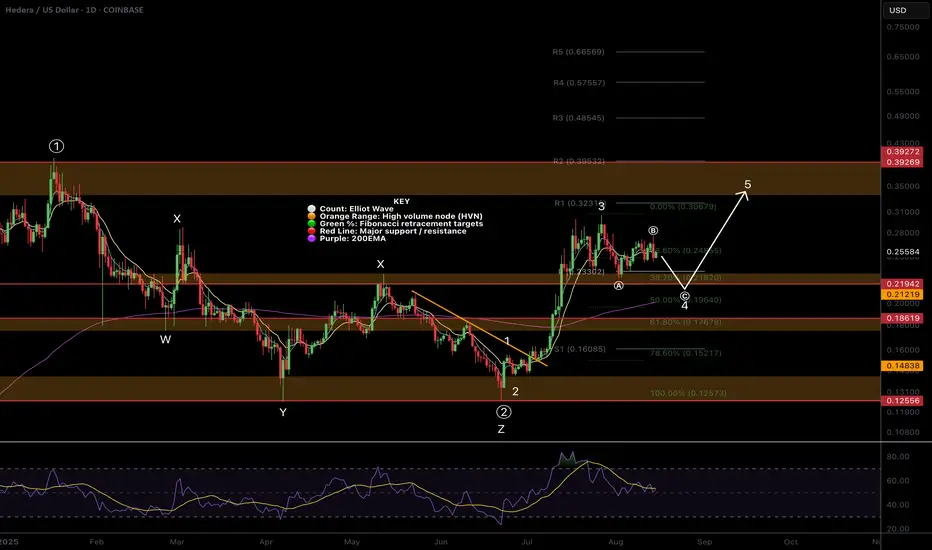
$HBAR Printing an ABC in wave 4?Wave C of an ABC correction in wave 4 appears to be underway in CRYPTOCAP:HBAR
This would see price have a quick drop below the daily pivot testing the major support High Volume Node and rising daily 200EMA as support before continuing up in wave 5. This is also the .382-.5 Fibonacci retracement a typical area for wave 4 to end per Elliot wave rules. Lots of confluence in this area.
RSI is still making its way down from overbought. Investor psychology is still irrationally bullish giving opportunity for professional traders to make some volatility bucks.
Analysis is invalidated if price breaks $0.273 upgrading the count to wave 4 completing at the current wave (a) bottom.
Safe trading