HBAR Sell/Short Signal (1H)The price seems to have reached a strong level that contains a lot of orders and has also shifted to a bearish structure.
Our last valid order block is the red zone | if the price reaches it, it will be a sell/short opportunity.
We have two targets marked on the chart, offering a 1:2 risk-to-reward ratio.
Let’s wait and see what happens next.
For risk management, please don't forget stop loss and capital management
When we reach the first target, save some profit and then change the stop to entry
Comment if you have any questions
Thank You
Hbaranalysis

HBAR/USDT — The Final Defense Zone Before a Major Reversal?HBAR is now standing at one of its most critical levels in the mid-term structure.
After the strong rally in late 2024, price has returned to the major demand zone at $0.141 – $0.12, which previously acted as the launchpad for the last significant bullish move.
The latest candle printed a long lower wick, indicating a possible liquidity sweep — where the market likely hunted stop-losses from retail traders before a potential reversal.
However, without a solid bullish confirmation candle, this could also signal the beginning of a structural breakdown.
---
Pattern and Market Structure:
Technically, HBAR is forming a wide consolidation range with lower highs, showing a period of indecision after a strong uptrend.
The demand block between $0.141 – $0.12 now stands as the last line of defense for buyers to maintain macro structure.
If this zone holds, a strong rebound may follow.
But if it breaks down, the trend could shift into a macro bearish phase.
---
Bullish Scenario:
If price holds above $0.141 – $0.12 and manages to close above $0.1638–$0.1785, it would confirm a potential reversal pattern.
Next bullish targets lie at:
$0.2143 – $0.2540 → first supply zone
$0.2925 – $0.3632 → major resistance range
$0.4014 → top of the macro range
A strong 4D bullish candle closing above $0.1785 would signal that institutional buyers are stepping back in.
---
Bearish Scenario:
If the 4D candle closes below $0.12, it would confirm a structural breakdown from the macro support range.
In this case, HBAR could drop further toward $0.09 – $0.07, and if bearish momentum accelerates, possibly retest the historical low around $0.0416.
Such a move would confirm that smart money has exited the range, opening the door to a deeper bearish phase.
---
Conclusion:
HBAR is currently at its make-or-break level.
The $0.141 – $0.12 zone acts as the final stronghold for buyers to defend the bullish macro structure.
A strong bounce from this zone could trigger a major reversal, but a confirmed breakdown below $0.12 would shift the entire market sentiment bearish.
This is the moment where HBAR decides whether it’s ready to reborn or collapse to deeper lows.
---
#HBAR #HBARUSDT #Hedera #CryptoAnalysis #SmartMoney #LiquiditySweep #ReversalZone #SupplyDemand #PriceAction #AltcoinAnalysis #CryptoReversal

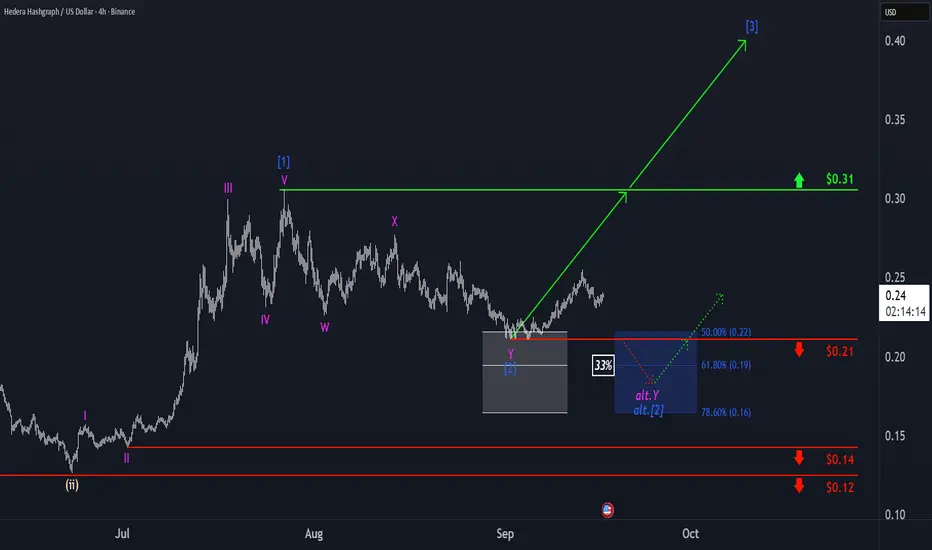
Hedera Hashgraph: Target Hit—Next Rally in SightA reversal began to emerge in the upper third of our grayed out Target Zone, prompting us to mark blue wave as complete. In the now-unfolding, same-colored wave , we anticipate gains well above resistance at $0.31. At the same time, we assign a 33% probability to a deeper low of wave alt. . In this case, however, we’d expect the reversal to happen no later than the blue (alternative) Target Zone ($0.22–$0.16), which would once again present an opportunity to initiate new long positions.
HBARUSDCOINBASE:HBARUSD try to break 0.257$ but we hope up-trend in last reaction to 0.257$ an break this level.
Best support: 0.239 - 0.230
Best resistance: 0.257 - 0.277 - 0.292
Please control risk management⚠️

HBAR/USDT – Gearing Up for a Major Bullish Wave!🚀 Trade Setup Details:
🕯 #HBAR/USDT 🔼 Buy | Long 🔼
⌛️ TimeFrame: 1D
--------------------
🛡 Risk Management (Example):
🛡 Based on $10,000 Balance
🛡 Loss-Limit: 1% (Conservative)
🛡 The Signal Margin: $374.39
--------------------
☄️ En1: 0.19607 (Amount: $37.44)
☄️ En2: 0.17665 (Amount: $131.04)
☄️ En3: 0.16401 (Amount: $168.48)
☄️ En4: 0.15228 (Amount: $37.44)
--------------------
☄️ If All Entries Are Activated, Then:
☄️ Average.En: 0.17047 ($374.39)
--------------------
☑️ TP1: 0.25245 (+48.09%) (RR:1.8)
☑️ TP2: 0.305 (+78.92%) (RR:2.95)
☑️ TP3: 0.38787 (+127.53%) (RR:4.77)
☑️ TP4: 0.5266 (+208.91%) (RR:7.82)
☑️ TP5: 0.73806 (+332.96%) (RR:12.47)
☑️ TP6: Open 🔝
--------------------
❌ SL: 0.12493 (-26.71%) (-$100)
--------------------
💯 Maximum.Lev: 2X
⌛️ Trading Type: Swing Trading
‼️ Signal Risk: 🙂 Low-Risk! 🙂
🔎 Technical Analysis Breakdown:
This technical analysis is based on Price Action, Elliott waves, SMC (Smart Money Concepts), and ICT (Inner Circle Trader) concepts. All entry points, Target Points, and Stop Losses are calculated using professional mathematical formulas. As a result, you can have an optimal trade setup based on great risk management.
📊 Sentiment & Market Context:
Hedera Hashgraph (HBAR) is showing strong bullish potential on the daily timeframe, supported by increasing volume and a solid base formation around key demand zones. With broader altcoin sentiment improving and BTC showing stability, HBAR could be poised for a breakout rally in the coming weeks.
🔍 Fundamental Highlights:
HBAR powers the Hedera network, a next-gen public ledger built on a unique Hashgraph consensus mechanism—faster, more secure, and more scalable than traditional blockchains. With real-world enterprise partnerships (like Google, IBM, and Boeing), Hedera’s ecosystem continues to gain momentum as Web3 adoption expands.
⚠️ Disclaimer:
Trading involves significant risk, and past performance does not guarantee future results. This analysis is for informational purposes only and should not be considered financial advice. Always conduct your research and trade responsibly.
💡 Stay Updated:
Like this technical analysis? Follow me for more in-depth insights, technical setups, and market updates. Let's trade smarter together!

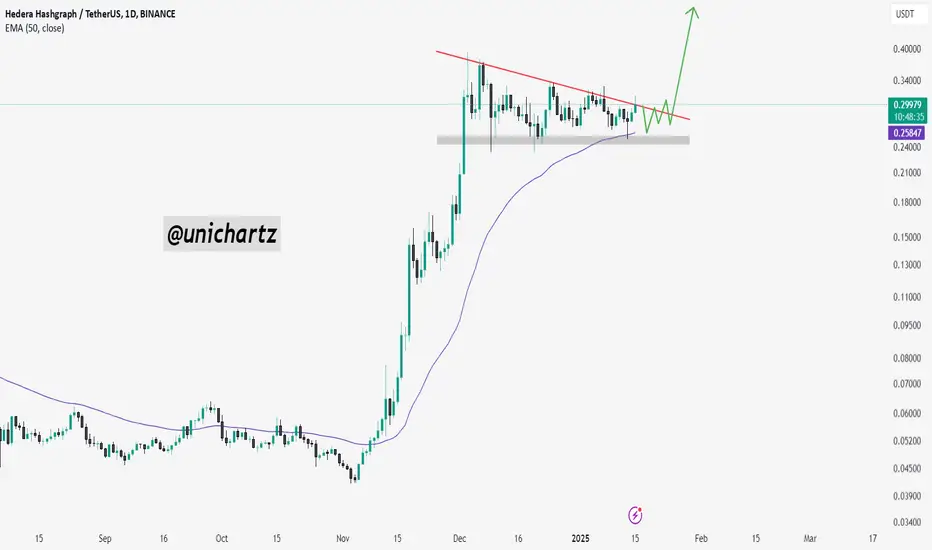
$HBAR Double breakout!!CRYPTOCAP:HBAR has officially broken out of the descending channel and completed a clean inverse head-and-shoulders pattern—one of technical analysis's most reliable bullish reversal signals!
Chart Pattern: Inverse Head & Shoulders
Trend Reversal Confirmed
🔹 Left Shoulder ✅
🔹 Head ✅
🔹 Right Shoulder ✅
🔹 Breakout + Retest Zone Holding Strong!
This bullish confirmation, paired with a reclaim above the 200-day EMA, sets the stage for a potential massive upside move, with the target pointing toward $0.40+.
Don’t ignore technicals — trade with clarity, not emotions.

HBARUSDT – Bull Flag Breakout Confirmed!The recent price action on HBARUSDT is showing a classic bull flag breakout — a powerful continuation pattern often seen in strong uptrends.
Bull Flag Breakdown:
Flagpole:
Prior to consolidation, HBAR saw a massive rally of over 780%, forming a steep vertical move — this sets the stage as the flagpole.
Flag Formation:
Price entered a downward sloping channel with clear lower highs and lower lows. This consolidation formed the flag, which indicates temporary cooling before the next leg up.
Breakout & Retest:
HBAR broke out of the flag’s resistance, followed by a successful retest of the breakout zone and a bounce off the 0.5 Fibonacci level — all signs of strong technical confirmation.
With this breakout, HBAR is likely to follow through with a measured move, aiming for key targets:
TP1 (Futures): 0.24985
TP2 (Futures): 0.28904
TP1 (Spot): 0.57177
TP2 (Spot): 1.23275+
These targets align with historical resistance and projected flagpole extensions.
If you find this analysis helpful, please hit the like button to support my content! Share your thoughts in the comments, and feel free to request any specific chart analysis you’d like to see.
Happy Trading!!

HBARHBAR
March 26, 2025
7:35 AM
From a tech perspective, looks like we’re heading into the final leg ( W5 ) targeting around $0.7795, if we’re measuring it through W3 + W4. Also spotting some bullish divergence showing up on the HTF, which adds to the bias.
A couple of solid confluences here too: on the D1 TF, HBAR just bounced off the 200 MA, which is a pretty key support, and it’s also sitting right inside a daily OB. Looks like buyers are stepping in.
Q: So is it good for buying on spot?
Yeah, HBAR is a solid crypto project. I actually shared my thesis on it — you can check it out on my channel, just scroll up a bit.
Q: Is it good to long on futures?
That really depends on your style. If you're a swing trader, then maybe — but personally, I don't think HBAR is ideal for swing longs or even day trades right now. The price action on LTF is pretty choppy, and it’s not the kind of setup that suits everyone. We all have different risk tolerance levels, so make sure it aligns with yours.

Hedera Hashgraph: Balancing ActHedera Hashgraph’s HBAR continues to hover just above the $0.17 support level, moving within an increasingly narrow sideways range. If the price breaks sustainably below this red line (38% probable), the green corrective wave alt. will establish a new low. Our primary assumption, however, remains that the green wave was already completed with the late February low, at the upper boundary of our now grayed-out Target Zone. If this assumption holds and buying pressure returns soon, HBAR should rally above the $0.39 resistance during the green impulse wave .

Hedera Hashgraph: Target Zone AwaitsFollowing the recent sharp sell-off and the immediate rebound, Hedera Hashgraph’s HBAR has stabilized just above $0.20. Currently, the coin is attempting a small breakout to the upside. If HBAR manages to surpass the $0.39 resistance at this stage, the next impulsive move of the green wave alt. will begin earlier than primarily expected (33% likely). In our primary scenario, however, the price should still drop into our beige long-entry Target Zone between $0.17 and $0.08. There, the low of the green correction wave should be settled before wave can advance beyond $0.39.

HBAR Hedera BREAKOUT Still in Play? LONG Bulls Are Still Hungry!I'm getting a lot of messages and feedback regarding the heads up I posted earlier in the week with the
🟢 HBAR BIG TRIANGLE BREAKOUT POST 🟢
The BIG QUESTION is... "What Next for HBARUSD?"
&
The ANSWERi is SIMPLE..."We monitor VOLUME and RIDE THE WAVE"
👍Have A GREAT WEEKEND.
&
REMEMBER TO FOLLOW 🟢SeekingPips🟢 to stay AHEAD OF THE PACK.👌

HBAR tries to breakout!HBAR / USDT
After massive pump in previous few weeks HBAR is formed a pennant pattern with multiple tries to breakout
watching it closely as a breakout here could send it to 0.39$ - 0.45$ - 0.57$ (ATH)
keep an eye on it

HBAR/USDT Approaches Apex: Bullish Breakout Ahead?HBAR/USDT is currently trading within a bull flag pattern and approaching the apex. A potential bullish breakout may be on the horizon.
The price has faced multiple rejections from the descending trendline but has consistently found strong support at the lower support zone. Keep an eye on the price action for a possible upward move.
DYOR, NFA
HBAR Hedera BIG Triangle BREAKOUT? HBARUSD Looking to EXPLODE!As we comb through a handful of Cryptos this morning HBAR is another one one SeekingPips RADAR.
ℹ️ A simple triangle formation will inevitably lead to a BREAKOUT.
STATISTICS tells us that there is a HIGHER PROBABILITY of a brekout to the UPSIDE as price will favour the TREND DIRECTION prior to the CONSOLIDATION.
As 2025 has barely begun it's not a bad idea to position yourself from now.
SUPER SECRET 🟢SEEKING-PIPS🟢 LESSON IS...
One of our TRADING 101 lessons it's BUY ABOVE the YEARLY OPEN.
It really is a great filter I have used for many years and one of the key filters I teach new traders.
SHHHH DON'T TELL ANYONE ELSE 😉
✅️I would appreciate your follow a BOOST OF THIS POST.
✅️I will continue to share my 20+ years of TRADING WISDOM as long as I have interaction on my posts.
HAVE AN GREAT DAY❕️

Hedera Hashgraph: Sharp DropWithin just a few hours, HBAR dropped sharply by around 20%, plunging deep into our green Target Zone between $0.29 and $0.22, a range we identify as suitable for long entries. This move marked the low of the green corrective wave 4. During the current impulsive wave 5, we expect a swift recovery toward the recent high at $0.39 and potentially beyond. In our short-term alternative scenario, further selling pressure could momentarily push the price below the support at $0.23 (with a 35% probability). But even in the case of such an extended correction, HBAR would remain within an overarching bullish upward structure.

HBARUSDT - great targets aheadmaking 500% after the breakout of the falling wedge pattern
I had already mentioned it before this mythical pump
Check it👇🏻
Hold on HBAR ...previous ATH is important target
Can get 2$ if it clear the red rectangular
Best regards Ceciliones 🎯

My point of view for HBARDear Follower
I got a multi request to analyze HBAR
I see HBAR most likely will hit $2.15 as a final target
I recommend liquidate 50% of your fund at that price then start use a trilling stop under each last new bottom for the rest of the fund
Good luck everyone

#HBAR (SPOT) entry range(0.0470 - 0.0520) T.(0.0970) SL (0.0453)entry range (0.0470 - 0.0520)
Target (0.0970)
SL .4H close below (0.0453)
************************************
#HBAR
#HBARUSDT
#HBARUSD
BINANCE:HBARUSDT
#swingtrade
#shortterminvestment
#ALTCOIN
#Cryptotading
#cryptoinvesting
#investment
##trading
#cryptocurrencytrading
#bitcoininvestments
#Investing_Coins
#Investingcoins
#Crypto_investing
#Cryptoinvesting
**** #Manta ,#OMNI, #DYM, #AI, #IO, #XAI , #ACE #NFP #RAD #WLD #ORDI #BLUR #SUI #Voxel #AEVO #VITE #APE #RDNT #FLUX #NMR #VANRY #HBAR ****
#bitcoin
#BTC
#BTCUSDT

Technical analysis for HBAR (HBAR/USDT) on a 4-hour chart + PRICTechnical Analysis by Blaž Fabjan.
Double Top Formation:
The chart highlights two potential tops, labeled as "TOP 1" and "TOP 2," suggesting a double top pattern. This typically indicates a bearish reversal after the second top, with price potentially dropping before continuing a new upward trend.
The neckline level where the price might break down after forming the second top appears to be in the range of approximately $0.054 or slightly lower.
Price Action and Next Move:
After the second top, the price might experience a pullback to a support level (likely the $0.052 - $0.053 range).
The blue arrow in the chart suggests a bullish continuation after the retracement, with an expected move to the upside targeting a higher resistance level around $0.065.
Momentum Indicators:
VMC Cipher B Divergences:
The divergence indicator signals some mixed momentum. There is both bearish and bullish momentum displayed in the indicator, but the red dots suggest potential downward pressure before any strong bullish continuation.
RSI (Relative Strength Index):
RSI is currently at around 60.37, indicating mild bullish momentum but still below overbought levels (70). If the RSI drops to oversold levels during the retracement, this would present a buying opportunity.
Stochastic RSI:
The Stochastic RSI is showing a recent peak near the overbought zone (72.50), indicating that a retracement might be near as momentum cools down before continuing upward.
Trading Plan:
Short-Term Bearish Scenario:
Enter a short position if the price fails to break above the second top and breaks below the neckline around $0.053-$0.054. Set a target near $0.052, the potential support area. Stop-loss can be set above the recent high at around $0.056.
Bullish Continuation:
Look for a long entry after the expected retracement around the $0.052 area, once bullish momentum starts to pick up again. The ideal entry point would be around $0.0525, confirmed by oversold conditions in RSI or Stochastic RSI.
Target: $0.065, which is the next major resistance level.
Stop-loss: Place stop-loss below $0.050, depending on risk appetite, to limit potential losses.
Indicators to Watch:
Keep a close eye on RSI and Stochastic RSI to confirm when the price is reaching oversold levels.
Watch for any divergence in the momentum indicators that could signal a reversal of the trend earlier than expected.
Risk Management:
Maintain a risk-reward ratio of at least 1:2, aiming for higher rewards on the upside compared to the risk on the downside.
Adjust positions based on support and resistance levels, and be cautious of any news or updates regarding HBAR fundamentals.
This strategy takes into account the possibility of both short-term corrections and longer-term bullish continuation.

HBAR Super BullishHBAR/usdt this setup on 1D TimeFrame is super bullish because of its previous pump.
Must enter after getting tapped into the Demand Zone Marked.
Confluences are simple.
Market Structure Daily Demand Zone and making HH and HL.

HBAR ( Hedera ) tm :1hHello traders.
I hope you doing well.
These areas are based on my personal strategy and I will share it with you.
Open a sell position on the supply area or open a buy position on the demand area.
Your entry point, stop loss, and target point are based on money management and the amount of money in your trading account.
But I promise you that by trading in the areas of my trading strategy, you will definitely make a profit, because these areas, although they seem simple, are my experience of 8 years of learning and trading.
I hope you will achieve maximum continuous profit with me by using supply and demand areas.
Good luck traders.
Mohammad Goodarzi

HBAR decides to melt faces!HBAR is up more than 60% on the day after receiving some good news regarding it's usage by institutions. This is just a taste-test of what's coming for the right cryptos!
Good luck, and always use a stop!

HBAR-Genuine break and 100% rise?BINANCE:HBARUSDT is a coin that I've been closely monitoring this year, awaiting a buy confirmation. As depicted on the chart, after experiencing a more than 90% drop from its peak, the price began consolidating and has now formed a clear resistance in the 0.10 zone. This significant resistance was finally breached yesterday, and if it proves to be genuine, we could anticipate a rise to the next resistance level, which is approximately at 0.2, indicating a potential 100% increase.
Today, the price is undergoing a normal correction, presenting a potential buying opportunity. Considering a stop loss of around 0.085, such a trade would offer a risk-to-reward ratio of 1:4.
