HBAR Sell/Short Signal (1H)The price seems to have reached a strong level that contains a lot of orders and has also shifted to a bearish structure.
Our last valid order block is the red zone | if the price reaches it, it will be a sell/short opportunity.
We have two targets marked on the chart, offering a 1:2 risk-to-reward ratio.
Let’s wait and see what happens next.
For risk management, please don't forget stop loss and capital management
When we reach the first target, save some profit and then change the stop to entry
Comment if you have any questions
Thank You
HBARBTC

HBAR Price Tumbles 25% — Indecisive Traders Could Extend Drop
HBAR has fallen 25% over the last week and trades at $0.144, hovering near the $0.145 level. The steep decline has pushed the token into a vulnerable position where bearish sentiment continues to overshadow attempts at stabilization.
Based on current indicators, HBAR could slip below its $0.139 support level. A drop to $0.133 or even $0.120 is possible if selling accelerates and market conditions worsen. Such a move may trigger panic among investors and deepen the correction.
If HBAR manages to hold the $0.145 support and bounce, the price could attempt a recovery toward $0.154. A breakout above that level may open the path to $0.162 or even $0.175. This scenario would invalidate the bearish outlook and signal renewed buyer interest.

#HBAR/USDT HBAR LONG#HBAR
The price is moving in a descending channel on the 1-hour timeframe and is expected to break out and continue upwards.
We have a trend to stabilize above the 100-period moving average again.
We have a downtrend on the RSI indicator, which supports an upward move if it breaks above it.
We have a key support zone in green that pushed the price higher at 0.18800.
Entry price: 0.1956
First target: 0.1985
Second target: 0.2052
Third target: 0.2115
For risk management, don't forget your stop-loss and money management.
The stop-loss is below the support zone in green.
Upon reaching the first target, take some profit and then change your stop-loss order to an entry order.
For any questions, please comment.
Thank you.

HBARUSDT Forming Falling WedgeHBARUSDT is showing a strong technical setup as it forms a falling wedge pattern, a bullish reversal signal that often precedes a major upward breakout. After a period of price compression, the pair appears to be gaining strength as buyers begin to re-enter the market. This structure suggests that downward momentum is weakening, and the coin could be preparing for a sharp reversal to the upside. A confirmed breakout above the wedge resistance could open the door for a potential rally of 70% to 80% in the coming sessions.
Trading volume for HBARUSDT remains steady and healthy, reinforcing the likelihood of a bullish breakout. This consistency in volume often indicates accumulation by smart investors during the consolidation phase. Once momentum picks up, the combination of increased demand and decreasing supply could drive prices higher rapidly. Traders are keeping a close eye on key resistance levels as the breakout zone approaches.
Investor confidence in Hedera (HBAR) continues to grow due to its strong fundamentals, enterprise partnerships, and expanding ecosystem. The current technical pattern aligns perfectly with this sentiment, suggesting the potential for a new bullish cycle to begin soon. If the breakout is confirmed with strong volume, it could trigger a wave of renewed optimism across the HBAR community and the broader crypto market.
✅ Show your support by hitting the like button and
✅ Leaving a comment below! (What is You opinion about this Coin)
Your feedback and engagement keep me inspired to share more insightful market analysis with you!

HBAR Price Could Miss 17% Jump as Death Cross EmergesHBAR trades at $0.170 at the time of writing, fluctuating within a narrow range between $0.178 and $0.162. The altcoin’s sideways trend highlights the ongoing indecision among investors as they await clearer technical signals.
Given the prevailing bearish indicators, HBAR could either continue consolidating or slip below $0.162. A drop to $0.154 or lower would extend losses and confirm downside pressure.
Conversely, if investors regain confidence and inflows return, HBAR could break past $0.178. A sustained rally from that level could push the token toward $0.200. This would marking a potential 17.6% rise and fully invalidating the current bearish outlook.

HBAR Price Faces Death Cross After 3 Months; May Fail BreakoutHBAR is trading at $0.159 at press time, moving within a descending broadening wedge pattern. While this formation is typically considered bullish, prevailing technical and sentiment indicators suggest potential failure.
If bearish pressure intensifies, HBAR could fall through the downtrend line. This could result in the altcoin slipping below $0.154 and targeting $0.145 in the coming days.
Conversely, if the three-month pattern remains intact, a reversal may propel HBAR above $0.180 and $0.188, eyeing a move to $0.198. This breakout would invalidate the bearish thesis and restore confidence among investors.

HBAR Futures Struggle as $200 Million Recovery Looks BleakHBAR has gained 9% since the crash, currently trading at $0.180 while attempting to secure $0.188 as a support floor. Holding this level is essential for maintaining recovery momentum and preventing another pullback.
The altcoin dropped by 25% during the crash, and a full rebound would require reclaiming $0.219. This move depends on collaboration between spot buyers and Futures traders. Without Futures market support, HBAR risks slipping back to $0.180 or lower.
However, if HBAR price receives renewed backing from investors, the altcoin could breach the $0.198 resistance. This would push the crypto token toward $0.205, signaling a return of bullish strength.

HBAR 2-Month Golden Cross Nears Its End, Price Awaits DeclineHBAR’s price currently trades at $0.215 within a descending wedge pattern. It sits just above support at $0.213 while struggling to break $0.219 resistance. Although wedges often resolve positively, a decisive breakout remains distant, with the key barrier standing near $0.230.
Given current sentiment and technical indicators, HBAR is likely to stay range-bound below $0.230. Even if the price surpasses $0.219, broader resistance and limited momentum could keep the altcoin consolidated.
Should bearish signals strengthen, HBAR risks slipping through support at $0.205. Breaking this level would invalidate the bullish setup entirely, opening the path to $0.198. Such a move could reinforce investor caution and intensify short-term volatility for Hedera.

HBAR 4H Analysis – Key Triggers Ahead💀 Hey , how's it going ? Come over here — Satoshi got something for you !
⏰ We’re analyzing HBAR on the 4-hour timeframe timeframe .
👀 On the 4H timeframe for HBAR , we can observe that this coin is ranging inside a box with very strong support and resistance levels. The last time, it reacted to the midline of this box (50% zone) and has built a trading structure for a potential breakout.
⚙️ The key RSI levels are at 57 and 35. Once the oscillation surpasses these levels, the price of this coin can shift and bring momentum into the market. Keep in mind that these zones often indicate increased volatility in the direction of price movement.
🕯 The volume of this coin has been decreasing over the past few days, and the number of trades has significantly dropped. Many buy and sell orders have been filled, and the coin is currently ranging in this box, deciding its next direction. Notice that with declining volume, we can often identify a new trend forming, since the current trend may be coming to an end.
📊 On the OTHERS.D index 4H timeframe , we can see that it is also moving inside a box, with the top of the box at the 7.9% zone . Breaking this level along with the RSI surpassing 63 could bring strong volume into the market. At the same time,
📊 a breakout on the TOTAL3 index would also inject solid volume into the market. This index is likewise inside a box, and the last time it reacted to its midline, it rebounded upward and is now moving toward the 1.08 resistance.
💰 Looking at the HBAR/BTC pair , we can observe that it has formed a box-like structure, similar to its USDT pair. With a breakout above the midline, more Bitcoin could be liquidated and converted into this coin. HBAR is considered one of the whales’ favorite coins.
🔔 The alert zones for HBAR carry some risk, and the possibility of failure should also be considered. The long alert zone is around 0.25846, which is the midline of this 4H box. The short alert zone is around 0.22784. Breaking this zone could provide a short position, coinciding with a deeper correction for this coin.
❤️ Disclaimer : This analysis is purely based on my personal opinion and I only trade if the stated triggers are activated .

Can 2-Month High Inflows End HBAR Price’s Downtrend?
At the time of writing, Hedera is priced at $0.237, facing resistance at $0.241. The cryptocurrency has been weighed down by a two-month-old downtrend that began after it failed to break above $0.248 earlier this summer.
Given current market inflows and bullish technical indicators, HBAR is likely to bounce back from the $0.230 support. If successful, the price could retest $0.241 and possibly $0.248. Surpassing this level would officially end the ongoing downtrend.
However, if bearish sentiment intensifies, Hedera could lose its footing. A breakdown below $0.230 would expose the cryptocurrency to a fall toward $0.219. Such a move would invalidate the bullish outlook and risk extending the downtrend further.

HBARUSDCOINBASE:HBARUSD try to break 0.257$ but we hope up-trend in last reaction to 0.257$ an break this level.
Best support: 0.239 - 0.230
Best resistance: 0.257 - 0.277 - 0.292
Please control risk management⚠️

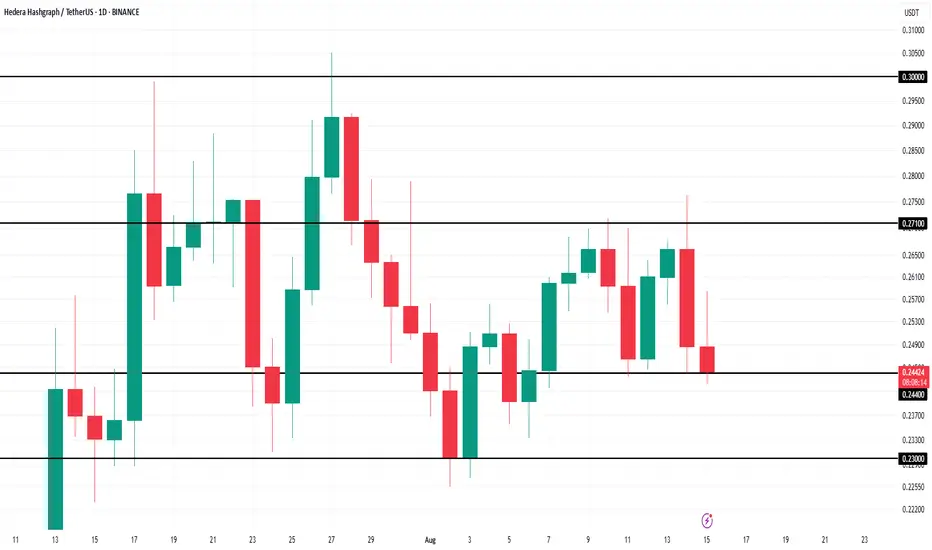
HBAR Eyes Bitcoin for Price Recovery Amid Market UncertaintyBINANCE:HBARUSDT is currently consolidating, trading at $0.255 while oscillating between $0.271 and $0.244 . The narrow range reflects investor caution, with traders awaiting external market cues. Without a decisive breakout, the altcoin may continue drifting sideways in the immediate term.
If Bitcoin strengthens and resumes its rally, BINANCE:HBARUSDT could break resistance at $0.271. Such a move may open the door for gains toward $0.291, with potential upside extending further if bullish conditions persist.
Alternatively, a Bitcoin downturn could drag BINANCE:HBARUSDT lower, pushing it beneath $0.244 support. In such a scenario, the altcoin risks falling to $0.230, undermining the bullish thesis and reinforcing caution among investors.

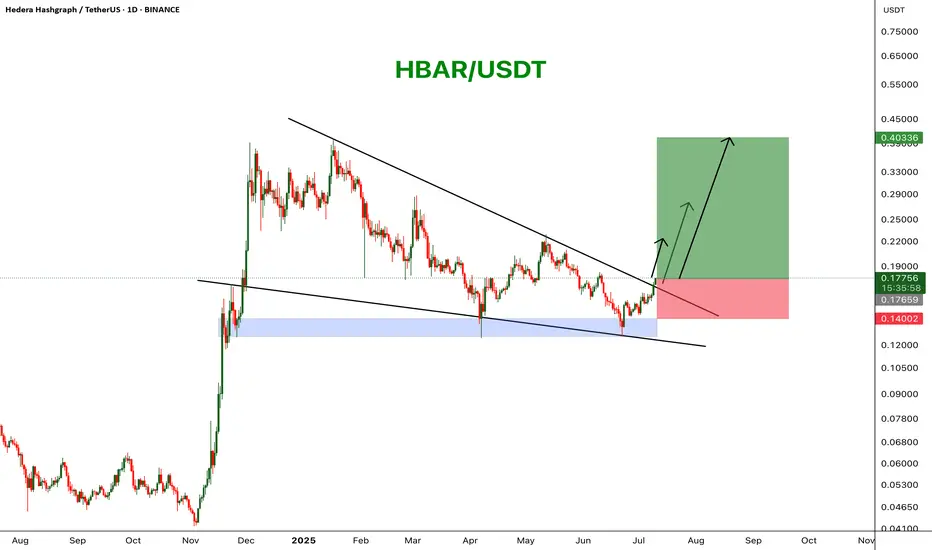
HBAR Bull Flag Is Ready to Explode, But Only If One Level FallsYello, Paradisers! Is #HBAR quietly setting up for its biggest breakout of the year? The chart is heating up fast, and the next move will be decisive.
💎Since forming a double bottom around $0.128, HBAR has bounced sharply, showing clear strength. The price action is now shaping into a potential bullish flag pattern, but the bulls are stuck at a critical barrier.
💎The $0.285–$0.30 zone is proving to be a major challenge, as it combines both horizontal resistance and the 61.8% Fibonacci retracement. Since mid-July, not a single daily candle has been able to close convincingly above this level, a clear sign of just how important this wall is.
💎For #HBARUSDT, a strong breakout and close above $0.30 with real volume would open the doors to a major bullish move, targeting the $0.380–$0.410 zone. This range not only marks the next strong resistance but also aligns with HBAR’s 52-week high.
💎On the downside, solid support lies between $0.235–$0.22, a zone that has held firm since mid-July within a converging triangle formation. As long as HBAR stays above this range, the bullish setup remains valid, and the breakout pressure continues to build.
Paradisers, strive for consistency, not quick profits. Treat the market as a businessman, not as a gambler.
MyCryptoParadise
iFeel the success🌴

HBAR Price Stalls as Outflows Hit 2-Month High—What’s Next?BINANCE:HBARUSDT price is currently at $0.243 , trapped within the range of $0.244 to $0.271. The mixed market cues, including the bearish CMF and the relatively neutral RSI, suggest that HBAR could continue consolidating.
This sideways movement is expected to persist unless there is a major shift in investor sentiment or a market catalyst that could push the altcoin in either direction.
If outflows intensify and BINANCE:HBARUSDT falls below its $0.244 support level , the bearish case could become more likely. In such a scenario, the price may drop further to $0.230, invalidating the current bullish-neutral outlook and signaling a deeper correction for HBAR.
HBARUSDT – Planning Ahead, Not Reacting Late In the event of a potential Q3 correction, I believe HBARUSDT could revisit the green box zones below.
These areas aren’t guaranteed bounce points — but they represent fair value in a market pullback scenario.
🧭 How I’m Preparing
📌 No blind orders
📌 Set alerts at the green zones
📌 When price hits, switch to 1-hour
📌 Wait for upward breakout + rising CDV
If it aligns, I take the trade — one bullet only.
"The smart investor doesn’t fear the correction — they prepare for it."
No rush. No panic. Just discipline.
Let’s stay ready.
— UmutTrades 💙
📌I keep my charts clean and simple because I believe clarity leads to better decisions.
📌My approach is built on years of experience and a solid track record. I don’t claim to know it all but I’m confident in my ability to spot high-probability setups.
📌If you would like to learn how to use the heatmap, cumulative volume delta and volume footprint techniques that I use below to determine very accurate demand regions, you can send me a private message. I help anyone who wants it completely free of charge.
🔑I have a long list of my proven technique below:
🎯 ZENUSDT.P: Patience & Profitability | %230 Reaction from the Sniper Entry
🐶 DOGEUSDT.P: Next Move
🎨 RENDERUSDT.P: Opportunity of the Month
💎 ETHUSDT.P: Where to Retrace
🟢 BNBUSDT.P: Potential Surge
📊 BTC Dominance: Reaction Zone
🌊 WAVESUSDT.P: Demand Zone Potential
🟣 UNIUSDT.P: Long-Term Trade
🔵 XRPUSDT.P: Entry Zones
🔗 LINKUSDT.P: Follow The River
📈 BTCUSDT.P: Two Key Demand Zones
🟩 POLUSDT: Bullish Momentum
🌟 PENDLEUSDT.P: Where Opportunity Meets Precision
🔥 BTCUSDT.P: Liquidation of Highly Leveraged Longs
🌊 SOLUSDT.P: SOL's Dip - Your Opportunity
🐸 1000PEPEUSDT.P: Prime Bounce Zone Unlocked
🚀 ETHUSDT.P: Set to Explode - Don't Miss This Game Changer
🤖 IQUSDT: Smart Plan
⚡️ PONDUSDT: A Trade Not Taken Is Better Than a Losing One
💼 STMXUSDT: 2 Buying Areas
🐢 TURBOUSDT: Buy Zones and Buyer Presence
🌍 ICPUSDT.P: Massive Upside Potential | Check the Trade Update For Seeing Results
🟠 IDEXUSDT: Spot Buy Area | %26 Profit if You Trade with MSB
📌 USUALUSDT: Buyers Are Active + %70 Profit in Total
🌟 FORTHUSDT: Sniper Entry +%26 Reaction
🐳 QKCUSDT: Sniper Entry +%57 Reaction
📊 BTC.D: Retest of Key Area Highly Likely
📊 XNOUSDT %80 Reaction with a Simple Blue Box!
📊 BELUSDT Amazing %120 Reaction!
📊 Simple Red Box, Extraordinary Results
📊 TIAUSDT | Still No Buyers—Maintaining a Bearish Outlook
📊 OGNUSDT | One of Today’s Highest Volume Gainers – +32.44%
📊 TRXUSDT - I Do My Thing Again
📊 FLOKIUSDT - +%100 From Blue Box!
📊 SFP/USDT - Perfect Entry %80 Profit!
📊 AAVEUSDT - WE DID IT AGAIN!
I stopped adding to the list because it's kinda tiring to add 5-10 charts in every move but you can check my profile and see that it goes on..

HBARUSDT Forming Bullish BreakoutHBARUSDT is showing strong signs of a potential bullish trend as it pushes higher with increased momentum. The recent breakout on the daily chart confirms that buyers are stepping in with confidence, supported by a good surge in volume. This uptick in activity is drawing fresh attention from traders and investors who recognize Hedera Hashgraph’s long-term potential in the crypto market. With this breakout move, HBAR could be setting up for a 90% to 100% gain in the coming weeks if market conditions stay supportive.
Hedera’s fundamentals remain solid as it continues to expand partnerships and grow its ecosystem of decentralized applications. Many investors are seeing HBAR as a unique blockchain alternative thanks to its hashgraph consensus mechanism, which promises faster transactions and lower fees compared to traditional blockchains. This unique tech angle has strengthened investor interest, positioning HBAR as a promising long-term play in the altcoin space.
The technical setup on HBARUSDT suggests that further upside may be on the horizon. If the price holds above the breakout level and continues to build higher lows, the next resistance zones could be tested swiftly, potentially driving the pair to new highs. As always, traders should watch for sustained volume and healthy pullbacks, which can offer additional opportunities to join the trend.
✅ Show your support by hitting the like button and
✅ Leaving a comment below! (What is You opinion about this Coin)
Your feedback and engagement keep me inspired to share more insightful market analysis with you!

HBARUSDT Trendline Breakout - Target 150%!HBARUSDT is currently attempting a breakout from a long-standing descending trendline on the daily chart. The price has reclaimed a key demand zone and is now trading above both the 50 and 100 EMA, a bullish technical signal suggesting bullish momentum.
If the breakout sustains, HBAR could target the 0.30–0.55 range in the coming weeks. Holding above the EMAs and trendline retest will be crucial for confirmation.

HBARUSDT Wedge BreakoutHBAR has broken out of a falling wedge pattern on the daily chart, signaling a potential bullish reversal. Price is trading above a key support zone and is pushing through descending resistance with strong momentum. A move toward higher targets seems likely if the breakout holds.
Resistance 1: $0.22
Resistance 2: $0.27
Resistance 3: $0.40
Stop Loss: $0.14
$HBAR Double breakout!!CRYPTOCAP:HBAR has officially broken out of the descending channel and completed a clean inverse head-and-shoulders pattern—one of technical analysis's most reliable bullish reversal signals!
Chart Pattern: Inverse Head & Shoulders
Trend Reversal Confirmed
🔹 Left Shoulder ✅
🔹 Head ✅
🔹 Right Shoulder ✅
🔹 Breakout + Retest Zone Holding Strong!
This bullish confirmation, paired with a reclaim above the 200-day EMA, sets the stage for a potential massive upside move, with the target pointing toward $0.40+.
Don’t ignore technicals — trade with clarity, not emotions.

#HBAR/USDT#HBAR
The price is moving within a descending channel on the 1-hour frame, adhering well to it, and is heading for a strong breakout and retest.
We are seeing a bounce from the lower boundary of the descending channel, which is support at 0.1870.
We have a downtrend on the RSI indicator that is about to be broken and retested, supporting the upward trend.
We are looking for stability above the 100 Moving Average.
Entry price: 0.19000
First target: 0.1935
Second target: 0.1970
Third target: 0.2001

HBARUSDT – Bull Flag Breakout Confirmed!The recent price action on HBARUSDT is showing a classic bull flag breakout — a powerful continuation pattern often seen in strong uptrends.
Bull Flag Breakdown:
Flagpole:
Prior to consolidation, HBAR saw a massive rally of over 780%, forming a steep vertical move — this sets the stage as the flagpole.
Flag Formation:
Price entered a downward sloping channel with clear lower highs and lower lows. This consolidation formed the flag, which indicates temporary cooling before the next leg up.
Breakout & Retest:
HBAR broke out of the flag’s resistance, followed by a successful retest of the breakout zone and a bounce off the 0.5 Fibonacci level — all signs of strong technical confirmation.
With this breakout, HBAR is likely to follow through with a measured move, aiming for key targets:
TP1 (Futures): 0.24985
TP2 (Futures): 0.28904
TP1 (Spot): 0.57177
TP2 (Spot): 1.23275+
These targets align with historical resistance and projected flagpole extensions.
If you find this analysis helpful, please hit the like button to support my content! Share your thoughts in the comments, and feel free to request any specific chart analysis you’d like to see.
Happy Trading!!

HBAR Analysis (12H)After the bearish CH, supply zones have formed on the chart.
Currently, the price is consuming an OB. Each time this OB has been consumed, lower highs have been formed. Additionally, the number of touches on this OB has been high, meaning many orders from this OB have been absorbed.
It is expected that the price will eventually reach the lower demand zone and then react strongly to the upside.
The closure of a daily candle below the invalidation level will invalidate this analysis.
For risk management, please don't forget stop loss and capital management
When we reach the first target, save some profit and then change the stop to entry
Comment if you have any questions
Thank You

HBAR Holding Key Support—Is a Sharp Rebound Coming?Yello, Paradisers! #HBAR has been one of the hottest altcoins in late 2024 and early 2025, but now, a deeper correction is unfolding. Could we see more downside, or is there still an upside push left before the next drop? Let’s break it down.
💎Right now, #HBARUSDT is forming an ABC corrective pattern, which suggests further downside in the coming weeks. However, before sellers take full control, Wave B upside is brewing, meaning a short-term bounce could be on the way.
💎So far, HBAR has twice held the strong support zone at $0.180 - $0.165—a critical area that previously acted as resistance. The initial reaction was strong, but bulls are now retesting this zone. Another bounce from here is expected, potentially setting up a short-term rally.
💎For this corrective push to materialize, bulls need to break above the descending resistance at $0.210. If that happens, we could see a quick rally towards $0.240 - $0.260, mainly driven by short-covering. However, this range is heavy resistance, making it difficult for bulls to push much higher.
💎If momentum stays strong, HBAR could extend its rally to the key resistance at $0.295 - $0.310, where a strong Fibonacci retracement is positioned. This is a strong resistance, and a level that marks completion of the Wave B, eventually leading to the next lower impulse.
Paradisers, the market remains choppy, and patience is key. Let the setup develop and avoid chasing weak moves—trade smart!
MyCryptoParadise
iFeel the success🌴
