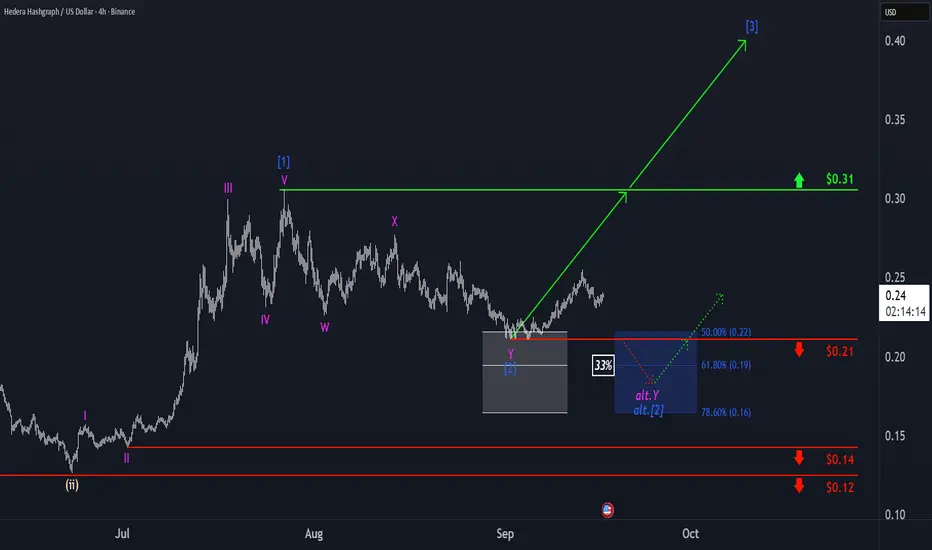
Hedera Hashgraph: Target Hit—Next Rally in SightA reversal began to emerge in the upper third of our grayed out Target Zone, prompting us to mark blue wave as complete. In the now-unfolding, same-colored wave , we anticipate gains well above resistance at $0.31. At the same time, we assign a 33% probability to a deeper low of wave alt. . In this case, however, we’d expect the reversal to happen no later than the blue (alternative) Target Zone ($0.22–$0.16), which would once again present an opportunity to initiate new long positions.
Hbarcoin
HBAR/USDT – Gearing Up for a Major Bullish Wave!🚀 Trade Setup Details:
🕯 #HBAR/USDT 🔼 Buy | Long 🔼
⌛️ TimeFrame: 1D
--------------------
🛡 Risk Management (Example):
🛡 Based on $10,000 Balance
🛡 Loss-Limit: 1% (Conservative)
🛡 The Signal Margin: $374.39
--------------------
☄️ En1: 0.19607 (Amount: $37.44)
☄️ En2: 0.17665 (Amount: $131.04)
☄️ En3: 0.16401 (Amount: $168.48)
☄️ En4: 0.15228 (Amount: $37.44)
--------------------
☄️ If All Entries Are Activated, Then:
☄️ Average.En: 0.17047 ($374.39)
--------------------
☑️ TP1: 0.25245 (+48.09%) (RR:1.8)
☑️ TP2: 0.305 (+78.92%) (RR:2.95)
☑️ TP3: 0.38787 (+127.53%) (RR:4.77)
☑️ TP4: 0.5266 (+208.91%) (RR:7.82)
☑️ TP5: 0.73806 (+332.96%) (RR:12.47)
☑️ TP6: Open 🔝
--------------------
❌ SL: 0.12493 (-26.71%) (-$100)
--------------------
💯 Maximum.Lev: 2X
⌛️ Trading Type: Swing Trading
‼️ Signal Risk: 🙂 Low-Risk! 🙂
🔎 Technical Analysis Breakdown:
This technical analysis is based on Price Action, Elliott waves, SMC (Smart Money Concepts), and ICT (Inner Circle Trader) concepts. All entry points, Target Points, and Stop Losses are calculated using professional mathematical formulas. As a result, you can have an optimal trade setup based on great risk management.
📊 Sentiment & Market Context:
Hedera Hashgraph (HBAR) is showing strong bullish potential on the daily timeframe, supported by increasing volume and a solid base formation around key demand zones. With broader altcoin sentiment improving and BTC showing stability, HBAR could be poised for a breakout rally in the coming weeks.
🔍 Fundamental Highlights:
HBAR powers the Hedera network, a next-gen public ledger built on a unique Hashgraph consensus mechanism—faster, more secure, and more scalable than traditional blockchains. With real-world enterprise partnerships (like Google, IBM, and Boeing), Hedera’s ecosystem continues to gain momentum as Web3 adoption expands.
⚠️ Disclaimer:
Trading involves significant risk, and past performance does not guarantee future results. This analysis is for informational purposes only and should not be considered financial advice. Always conduct your research and trade responsibly.
💡 Stay Updated:
Like this technical analysis? Follow me for more in-depth insights, technical setups, and market updates. Let's trade smarter together!

Hedera Hashgraph: Balancing ActHedera Hashgraph’s HBAR continues to hover just above the $0.17 support level, moving within an increasingly narrow sideways range. If the price breaks sustainably below this red line (38% probable), the green corrective wave alt. will establish a new low. Our primary assumption, however, remains that the green wave was already completed with the late February low, at the upper boundary of our now grayed-out Target Zone. If this assumption holds and buying pressure returns soon, HBAR should rally above the $0.39 resistance during the green impulse wave .

Hedera Hashgraph: Target Zone AwaitsFollowing the recent sharp sell-off and the immediate rebound, Hedera Hashgraph’s HBAR has stabilized just above $0.20. Currently, the coin is attempting a small breakout to the upside. If HBAR manages to surpass the $0.39 resistance at this stage, the next impulsive move of the green wave alt. will begin earlier than primarily expected (33% likely). In our primary scenario, however, the price should still drop into our beige long-entry Target Zone between $0.17 and $0.08. There, the low of the green correction wave should be settled before wave can advance beyond $0.39.

Hedera Hashgraph: Sharp DropWithin just a few hours, HBAR dropped sharply by around 20%, plunging deep into our green Target Zone between $0.29 and $0.22, a range we identify as suitable for long entries. This move marked the low of the green corrective wave 4. During the current impulsive wave 5, we expect a swift recovery toward the recent high at $0.39 and potentially beyond. In our short-term alternative scenario, further selling pressure could momentarily push the price below the support at $0.23 (with a 35% probability). But even in the case of such an extended correction, HBAR would remain within an overarching bullish upward structure.

Hbar Building For Breakout Finally Hbar Building Up For Massive Breakout Formed Falling Wedge In 3 days tf Incase Of Successful Breakout Expecting 250%+ bullish Rally

Hbar Preparing for Solid Gains Formed descending Broadening wedge While Formed Bullish Pennant Below Major trendline expecting Massive Breakout from Both And If both got cleared Expecting 200 to 240% bullish wave

Hbar Looking Good for Midterm Formed Descending Broadening Wedge In 3day Timeframe Expecting massive Breakout
Incase Of Breakout expecting 200 to 220% Bullish Move Keep Eyes On For Breakout For entry

HbarusdtFormed Massive wedge In daily Timeframe Incase Of Breakout expecting 150 to 170% bulish Move
Keep In Mind Entry Would Be Only valid After Breakout Without Breakout Hbarcoin will Remain Bearish
Safe Sl Area Would Be Below Wedge

Hbar On Route Of Massive Recovery Major Trendline Has already Broken
Testing Horizontal Resistance
Moving Averages 50Ma & 200Ma Crossover About To Happen
Once Daily Candle Closed Above Horizontal Resistance Next Possible Target Would Be Between 0.16 to 0.20

Finally Breaking Another Bulish Pattern Forming Bulish Pennant In h4 Timeframe
Incase Of Breakout Expecting 25 to 30% bulish move Keep Eyes On for Breakout

cup handle pattern In hbarIn hbar marking cup handle patter in 1d time frame
wait for breakout
wait for the right time for buyers
I m bullish in hbar

hbar facing resistance hbar looking super bullish buying time
And This time hbar facing resistance at the price of 0.28$
wait for resistance breakout then buy more
I hope this week hbar break the all-time high

hbar why growing slowly hbar facing more resistance
see the idea and you can understand what I m say
but hbar bullish so buy more

hbar boom hbar super bullish in the weekly time frame
macd bullish
and
stoch rsi
bullish
buy time take entry in hbar
see the idea and you can understand it easily

hbarusdt price in rangehbar inside base condiction And when hbar break the resistance than when can see a big pump in hbarust
support : 0.208$
resistance : 0.27$

hbar facing the resistance hbar facing the strong resistance
wait for breakout
hbar strong support on = 0.15$
If you want to buy hbar then buy in support
In hbar volume increase

HBARUSD BREAKOUT SOON HBAR holders wait for breakout I think hbar gives breakout soon
this time don't sell in loss
all patterns look like a bullish
don't buy trade
If you want to buy then wait for breakout

hbar falling down so how we can buy at the deep
when price come low support buy 20% trade
and price going more down then wait for price come in strong support then buy 30% again and
price going to touch resistance then sell your trade
And price breakout the resistance then wait for retest and buy more
note :- hbar in downtrend and no anyone know when price revers so trade carefully and my opinion hbar uptrend coming soon

hbar making divergent hbar break trend line with divergent support
hbar break the downtrend
all guy wait for trend line breakout

HBAR BREAKOUT CONFIRMHBAR today clearly show breakout complete so this time to buy more hbar coin
i'm going to long hbar

HBAR TESTING SUPPORTHBARUSDT testing suppport and pump soon
price bullish in 1D CHART
but lets see
Don't panic
Set stop loss 0.17$

HBAR About To Join The Alt Party!It's that time again for Hashgraph to start climbing the CMC ranks with a move to $0.69
If you are planning on grabbing more Hbars; doing so before Sunday night may not be a bad idea, as I expect price to move up in a big way next week. It has broken out on the daily and is currently consolidating along with building strength for a price explosion. Should be a fun week for you Hbarbarians out there.
Remember this is only my formed analysis outlook. This is not an endorsement or recommendation to buy or sell.
