HBAR/USDT Testing a Demand Zone: Rebound or Further Breakdown?HBAR/USDT on the Weekly (1W) timeframe remains in a medium-to-long-term bearish structure. After failing to hold the strong resistance around 0.12 USDT, price formed a sequence of lower highs and lower lows, confirming that sellers are still in control.
Price is currently moving toward a historical demand zone, highlighted by the yellow box between 0.054 – 0.042 USDT, an area that previously acted as a strong bounce level and long-term accumulation base.
---
Key Levels
Major Resistance:
0.125 USDT (previous support turned resistance)
0.17 – 0.20 USDT (previous lower high zone)
Major Support / Demand Zone:
0.054 – 0.042 USDT (weekly demand & historical base)
Extreme Low:
0.012 USDT (all-time low / worst-case scenario)
---
Pattern & Market Structure
Primary Trend: Bearish (Lower High – Lower Low)
Market Phase: Distribution → Breakdown → Failed pullback → Continuation
Key Pattern Explanation:
The breakdown below 0.12 USDT confirms a bearish continuation
Previous rallies were corrective moves, not trend reversals
Historical Context:
Price is potentially revisiting the 2022–2023 base range, represented by the highlighted demand zone.
Historically, the 0.054 – 0.042 area is where institutional buyers previously stepped in aggressively, making price reaction at this zone extremely important.
---
Bullish Scenario
The bullish scenario becomes valid only if price:
1. Reaches the 0.054 – 0.042 demand zone
2. Forms strong weekly rejection (long lower wicks or bullish engulfing)
3. Shows increasing accumulation volume
Bullish Targets (Step-by-Step):
0.075 USDT (minor resistance retest)
0.098 – 0.10 USDT
0.125 USDT (major resistance & trend decision level)
As long as price remains below 0.125, any upside move should be considered a relief rally, not a confirmed bullish trend.
---
Bearish Scenario
The bearish continuation scenario remains valid if:
Price breaks and closes weekly below 0.042
The demand zone fails to hold selling pressure
Bearish Targets:
0.030 USDT (intermediate support)
0.020 USDT
0.012 USDT (cycle low / capitulation zone)
The projected decline from the 0.125 area toward the demand zone reflects a potential downside of -66% to -68%, in line with the chart projection.
---
Conclusion
HBAR is currently at a major decision point.
The 0.054 – 0.042 USDT zone represents the last major weekly demand.
Strong reaction here → potential medium-term reversal
Clean breakdown → high risk of further capitulation
Traders and investors are advised to wait for clear weekly price action confirmation, rather than entering prematurely without validation.
#HBAR #HBARUSDT #HederaHashgraph
#CryptoAnalysis #WeeklyChart #SupplyAndDemand
#BearishTrend #PotentialReversal #AltcoinAnalysis #MarketStructure
Hbarlong

HBAR simple chart for 2026Check out this long-term BINANCE:HBARUSDT chart. Idea is pretty simple! I track this chart since 2021 and if we cut all noise we can find the best zone for spot accumulation (marked box zone)
Key supports at 0.10 current level or even better retest 0.08 again!
Levels for fixation step by step Yearly open 2025.
Fibonacci extensions levels and 1.618 by mid-2026 around 0.65 cents would be enough for this cycle! But i understand majority waiting over 1$ price! But most likely it will not happen! What's your HBAR target? DYOR!

#HBAR/USDT HBAR LONG#HBAR
The price is moving in a descending channel on the 1-hour timeframe and is expected to break out and continue upwards.
We have a trend to stabilize above the 100-period moving average again.
We have a downtrend on the RSI indicator, which supports an upward move if it breaks above it.
We have a key support zone in green that pushed the price higher at 0.18800.
Entry price: 0.1956
First target: 0.1985
Second target: 0.2052
Third target: 0.2115
For risk management, don't forget your stop-loss and money management.
The stop-loss is below the support zone in green.
Upon reaching the first target, take some profit and then change your stop-loss order to an entry order.
For any questions, please comment.
Thank you.

HBAR/USDT — The Final Defense Zone Before a Major Reversal?HBAR is now standing at one of its most critical levels in the mid-term structure.
After the strong rally in late 2024, price has returned to the major demand zone at $0.141 – $0.12, which previously acted as the launchpad for the last significant bullish move.
The latest candle printed a long lower wick, indicating a possible liquidity sweep — where the market likely hunted stop-losses from retail traders before a potential reversal.
However, without a solid bullish confirmation candle, this could also signal the beginning of a structural breakdown.
---
Pattern and Market Structure:
Technically, HBAR is forming a wide consolidation range with lower highs, showing a period of indecision after a strong uptrend.
The demand block between $0.141 – $0.12 now stands as the last line of defense for buyers to maintain macro structure.
If this zone holds, a strong rebound may follow.
But if it breaks down, the trend could shift into a macro bearish phase.
---
Bullish Scenario:
If price holds above $0.141 – $0.12 and manages to close above $0.1638–$0.1785, it would confirm a potential reversal pattern.
Next bullish targets lie at:
$0.2143 – $0.2540 → first supply zone
$0.2925 – $0.3632 → major resistance range
$0.4014 → top of the macro range
A strong 4D bullish candle closing above $0.1785 would signal that institutional buyers are stepping back in.
---
Bearish Scenario:
If the 4D candle closes below $0.12, it would confirm a structural breakdown from the macro support range.
In this case, HBAR could drop further toward $0.09 – $0.07, and if bearish momentum accelerates, possibly retest the historical low around $0.0416.
Such a move would confirm that smart money has exited the range, opening the door to a deeper bearish phase.
---
Conclusion:
HBAR is currently at its make-or-break level.
The $0.141 – $0.12 zone acts as the final stronghold for buyers to defend the bullish macro structure.
A strong bounce from this zone could trigger a major reversal, but a confirmed breakdown below $0.12 would shift the entire market sentiment bearish.
This is the moment where HBAR decides whether it’s ready to reborn or collapse to deeper lows.
---
#HBAR #HBARUSDT #Hedera #CryptoAnalysis #SmartMoney #LiquiditySweep #ReversalZone #SupplyDemand #PriceAction #AltcoinAnalysis #CryptoReversal

HBAR Price Faces Death Cross After 3 Months; May Fail BreakoutHBAR is trading at $0.159 at press time, moving within a descending broadening wedge pattern. While this formation is typically considered bullish, prevailing technical and sentiment indicators suggest potential failure.
If bearish pressure intensifies, HBAR could fall through the downtrend line. This could result in the altcoin slipping below $0.154 and targeting $0.145 in the coming days.
Conversely, if the three-month pattern remains intact, a reversal may propel HBAR above $0.180 and $0.188, eyeing a move to $0.198. This breakout would invalidate the bearish thesis and restore confidence among investors.

HBAR 2-Month Golden Cross Nears Its End, Price Awaits DeclineHBAR’s price currently trades at $0.215 within a descending wedge pattern. It sits just above support at $0.213 while struggling to break $0.219 resistance. Although wedges often resolve positively, a decisive breakout remains distant, with the key barrier standing near $0.230.
Given current sentiment and technical indicators, HBAR is likely to stay range-bound below $0.230. Even if the price surpasses $0.219, broader resistance and limited momentum could keep the altcoin consolidated.
Should bearish signals strengthen, HBAR risks slipping through support at $0.205. Breaking this level would invalidate the bullish setup entirely, opening the path to $0.198. Such a move could reinforce investor caution and intensify short-term volatility for Hedera.

HBARUSDCOINBASE:HBARUSD try to break 0.257$ but we hope up-trend in last reaction to 0.257$ an break this level.
Best support: 0.239 - 0.230
Best resistance: 0.257 - 0.277 - 0.292
Please control risk management⚠️

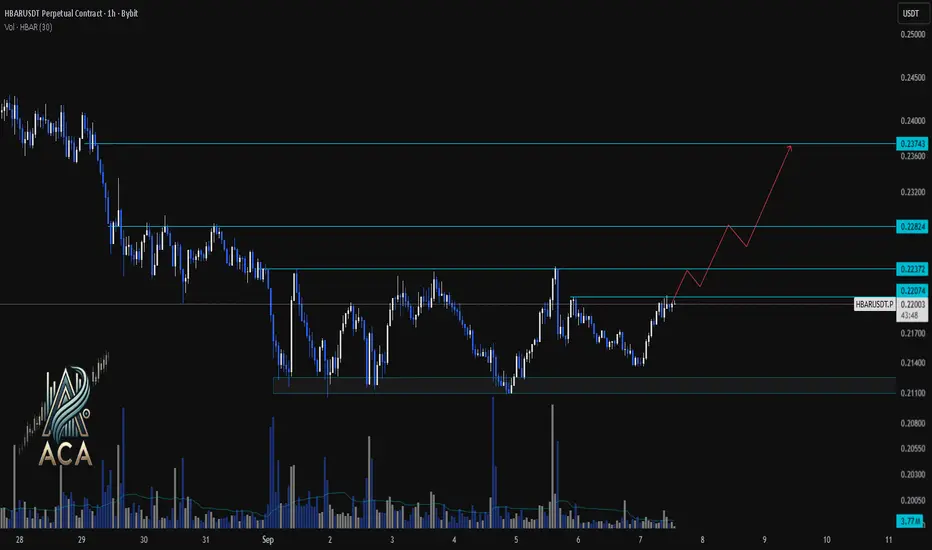
HBARUSDT 1H Chart Analysis | Bullish Structure in PlayHBARUSDT 1H Chart Analysis | Bullish Structure in Play
🔍 Let’s break down the recent price action for the HBAR/USDT perpetual contract and outline the roadmap for potential bullish continuation.
⏳ 1-Hour Overview
The 1-hour chart shows HBAR recovering from a strong demand zone near $0.21100, pushing upward with notable momentum. Price action is now challenging immediate resistance at $0.22372, with higher levels at $0.22824 and $0.23743 presenting the next bullish targets.
🔺 Long Setup:
A decisive close and hold above $0.22372 could fuel further upside, targeting the $0.22824 resistance next. Sustained bullish volume and higher lows may pave the way for an extension up to $0.23743, aligning with the drawn projection path.
📊 Key Highlights:
- Strong defense of the $0.21100 support region led to a sharp rebound.
- Immediate resistance stands at $0.22372, with the bullish path mapped toward $0.22824 and $0.23743.
- Volume spikes on upward candles indicate increasing buyer interest and potential for trend follow-through.
🚨 Conclusion:
HBARUSDT is building a bullish structure above local support, with momentum favoring continued upside if $0.22372 flips into support. Watching volume and reaction at key resistance areas remains crucial for confirming the next leg higher.
HBAR/USDT – Gearing Up for a Major Bullish Wave!🚀 Trade Setup Details:
🕯 #HBAR/USDT 🔼 Buy | Long 🔼
⌛️ TimeFrame: 1D
--------------------
🛡 Risk Management (Example):
🛡 Based on $10,000 Balance
🛡 Loss-Limit: 1% (Conservative)
🛡 The Signal Margin: $374.39
--------------------
☄️ En1: 0.19607 (Amount: $37.44)
☄️ En2: 0.17665 (Amount: $131.04)
☄️ En3: 0.16401 (Amount: $168.48)
☄️ En4: 0.15228 (Amount: $37.44)
--------------------
☄️ If All Entries Are Activated, Then:
☄️ Average.En: 0.17047 ($374.39)
--------------------
☑️ TP1: 0.25245 (+48.09%) (RR:1.8)
☑️ TP2: 0.305 (+78.92%) (RR:2.95)
☑️ TP3: 0.38787 (+127.53%) (RR:4.77)
☑️ TP4: 0.5266 (+208.91%) (RR:7.82)
☑️ TP5: 0.73806 (+332.96%) (RR:12.47)
☑️ TP6: Open 🔝
--------------------
❌ SL: 0.12493 (-26.71%) (-$100)
--------------------
💯 Maximum.Lev: 2X
⌛️ Trading Type: Swing Trading
‼️ Signal Risk: 🙂 Low-Risk! 🙂
🔎 Technical Analysis Breakdown:
This technical analysis is based on Price Action, Elliott waves, SMC (Smart Money Concepts), and ICT (Inner Circle Trader) concepts. All entry points, Target Points, and Stop Losses are calculated using professional mathematical formulas. As a result, you can have an optimal trade setup based on great risk management.
📊 Sentiment & Market Context:
Hedera Hashgraph (HBAR) is showing strong bullish potential on the daily timeframe, supported by increasing volume and a solid base formation around key demand zones. With broader altcoin sentiment improving and BTC showing stability, HBAR could be poised for a breakout rally in the coming weeks.
🔍 Fundamental Highlights:
HBAR powers the Hedera network, a next-gen public ledger built on a unique Hashgraph consensus mechanism—faster, more secure, and more scalable than traditional blockchains. With real-world enterprise partnerships (like Google, IBM, and Boeing), Hedera’s ecosystem continues to gain momentum as Web3 adoption expands.
⚠️ Disclaimer:
Trading involves significant risk, and past performance does not guarantee future results. This analysis is for informational purposes only and should not be considered financial advice. Always conduct your research and trade responsibly.
💡 Stay Updated:
Like this technical analysis? Follow me for more in-depth insights, technical setups, and market updates. Let's trade smarter together!

HBARUSDT — Retest of Demand Zone After Breakout?HBAR/USDT is currently in a crucial retest phase after a strong breakout from its key accumulation zone around 0.199–0.217 (yellow box, Fib 0.5–0.618 area). The recent rally toward 0.29–0.30 highlighted strong buying momentum, but price is now consolidating near 0.243, suggesting a healthy pullback before the next potential move.
This structure often signals a bullish retest after breakout — but if key support levels are lost, it could trigger a deeper correction.
---
🔍 Structure & Pattern
Previous phase: HBAR traded sideways for months within a large range.
Recent move: Clean breakout above the accumulation zone.
Current phase: Retesting the demand zone.
Pattern in play: Bullish Retest / Flag Consolidation on the daily timeframe.
Bullish continuation trigger: Daily close above 0.29197 with volume confirmation.
Bearish invalidation: Daily close below 0.19928 (Fib 0.618).
---
📌 Key Technical Levels (1D)
Support (Demand Zone):
0.21707 (Fib 0.5) → first line of defense.
0.19928 (Fib 0.618) → strongest support; bullish invalidation if broken.
Resistance Levels:
0.26511 → minor resistance.
0.29197 → major resistance / breakout trigger.
0.33037 → TP1.
0.37526 → TP2.
0.40139 → local high & ultimate mid-term target.
Downside targets (if breakdown):
0.160–0.140 → prior consolidation zone.
0.093–0.087 → historical low.
---
🚀 Bullish Scenarios
1. Conservative (Breakout Buyer):
Entry: Daily close above 0.29197
Stop: Below 0.26511
Targets: 0.33037 / 0.37526
Potential reward: +35% to +54% from current levels
2. Aggressive (Buy the Dip):
Entry: 0.217–0.199 demand zone
Stop: Below 0.199 (bullish invalidation)
Targets: 0.265 / 0.292 / 0.330
Attractive R:R potential (>1:3) if demand holds
---
⚠️ Bearish Scenarios
1. Breakdown of 0.199:
Daily close below 0.199 → structure invalidated.
Downside targets: 0.16 → 0.14, and possibly 0.087 (historical low).
2. Rejection at Resistance:
Failure to break 0.292 + formation of a lower-high = possible range or distribution phase.
Price could revisit 0.217 demand zone again.
---
📈 Strategy & Risk Management
Aggressive traders: Buy dips at 0.217–0.199 with tight stops.
Conservative traders: Wait for confirmation above 0.292 before entering.
Risk management: Limit exposure to 1–2% per trade.
Extra confirmation: Watch for volume spikes or bullish candlestick reversals (hammer, engulfing) in demand zones.
---
✅ Conclusion
HBAR is in a critical demand retest. As long as 0.217–0.199 holds, the bias remains bullish, with mid-term targets at 0.33–0.37. A daily close below 0.199, however, would shift momentum bearish and open the door to a much deeper correction.
HBAR offers a high R:R opportunity for both aggressive dip buyers and conservative breakout traders — making it one of the setups to watch closely in the coming weeks.
#HBAR #HBARUSDT #Hedera #Crypto #TechnicalAnalysis #PriceAction #SwingTrade #Fibonacci

HBAR Bull Flag Is Ready to Explode, But Only If One Level FallsYello, Paradisers! Is #HBAR quietly setting up for its biggest breakout of the year? The chart is heating up fast, and the next move will be decisive.
💎Since forming a double bottom around $0.128, HBAR has bounced sharply, showing clear strength. The price action is now shaping into a potential bullish flag pattern, but the bulls are stuck at a critical barrier.
💎The $0.285–$0.30 zone is proving to be a major challenge, as it combines both horizontal resistance and the 61.8% Fibonacci retracement. Since mid-July, not a single daily candle has been able to close convincingly above this level, a clear sign of just how important this wall is.
💎For #HBARUSDT, a strong breakout and close above $0.30 with real volume would open the doors to a major bullish move, targeting the $0.380–$0.410 zone. This range not only marks the next strong resistance but also aligns with HBAR’s 52-week high.
💎On the downside, solid support lies between $0.235–$0.22, a zone that has held firm since mid-July within a converging triangle formation. As long as HBAR stays above this range, the bullish setup remains valid, and the breakout pressure continues to build.
Paradisers, strive for consistency, not quick profits. Treat the market as a businessman, not as a gambler.
MyCryptoParadise
iFeel the success🌴

HBAR Price Drop To $0.20 Likely; $53 Million Liquidation AheadBINANCE:HBARUSDT price currently sits at $0.235, encountering resistance at $0.241. Despite its recent rally, the broader market conditions are pulling it down, and the next major support level is at $0.220 . If the altcoin fails to hold above this level, it could slide towards $0.200.
Looking at the liquidation map, there is a real possibility of significant losses for $BINANCE:HBARUSDTtraders. The map shows that if the price drops to $0.20 or lower, approximately $53 million worth of long positions would be liquidated . This would create a wave of selling pressure and potentially drive the price down further.
In the event of a surge in bearish sentiment or increased selling pressure, BINANCE:HBARUSDT could fall below $0.220 , hitting the psychological support level at $0.200. A drop below this critical level would likely trigger the $53 million worth of liquidations, further exacerbating the decline.
However, if BINANCE:HBARUSDT manages to hold above $0.220 and successfully breaches the $0.241 resistance, there could be an opportunity for a rally. A successful bounce off $0.220 could push HBAR towards $0.267 , providing some relief to traders and reinforcing its bullish outlook.
HBARUSDT Forming Bullish BreakoutHBARUSDT is showing strong signs of a potential bullish trend as it pushes higher with increased momentum. The recent breakout on the daily chart confirms that buyers are stepping in with confidence, supported by a good surge in volume. This uptick in activity is drawing fresh attention from traders and investors who recognize Hedera Hashgraph’s long-term potential in the crypto market. With this breakout move, HBAR could be setting up for a 90% to 100% gain in the coming weeks if market conditions stay supportive.
Hedera’s fundamentals remain solid as it continues to expand partnerships and grow its ecosystem of decentralized applications. Many investors are seeing HBAR as a unique blockchain alternative thanks to its hashgraph consensus mechanism, which promises faster transactions and lower fees compared to traditional blockchains. This unique tech angle has strengthened investor interest, positioning HBAR as a promising long-term play in the altcoin space.
The technical setup on HBARUSDT suggests that further upside may be on the horizon. If the price holds above the breakout level and continues to build higher lows, the next resistance zones could be tested swiftly, potentially driving the pair to new highs. As always, traders should watch for sustained volume and healthy pullbacks, which can offer additional opportunities to join the trend.
✅ Show your support by hitting the like button and
✅ Leaving a comment below! (What is You opinion about this Coin)
Your feedback and engagement keep me inspired to share more insightful market analysis with you!

HBARUSDT 4H Chart Analysis |Volume & Fibonacci Reaction in FocusHBARUSDT 4H Chart Analysis | Volume & Fibonacci Reaction in Focus
🔍 Let’s break down the latest HBAR/USDT setup, highlighting a clear technical reaction and a new opportunity on the horizon.
⏳ 4-Hour Overview
HBAR has completed a strong impulsive leg after breaking above the RR2 of the key reversal trendline, supported by notable volume confirmation. This impressive surge was then followed by a corrective leg—a healthy sign for bulls, especially for those who missed the initial breakout.
📉 Corrective Phase & Fibonacci Support
- The current corrective leg is characterized by decreasing volume, suggesting profit-taking rather than heavy selling pressure.
- Notably, price has reacted firmly at the 0.236 Fibonacci retracement level, aligning with classic pullback zones for continuation setups.
- This volume pattern shows traders are waiting for the next major move rather than exiting positions.
🔺 Bullish Continuation Setup
- A strong candle close above the $0.255 level on either the 1H or 4H timeframe will serve as a clear bullish confirmation.
- Such a breakout may pave the way for another impulsive leg upward, with the first upside target identified near $0.30—roughly 19% higher from the recent candle close.
📊 Key Highlights:
- The prior trend reversal was validated by surge in volume and momentum.
- Volume decline during the correction favors further upside rather than distribution.
- Price is respecting key Fibonacci levels, hinting at trend continuity.
- A confirmed close above $0.255 unlocks the next target at $0.30, marking a potential 19% move.
🚨 Conclusion:
HBAR is showing textbook trend continuation signals. For those sidelined after the initial move, the current consolidation offers a safer re-entry point, with actionable confirmation above $0.255. Stay alert for a strong candle close and keep the $0.30 target in view as bullish momentum builds.

HBARUSDT Wedge BreakoutHBAR has broken out of a falling wedge pattern on the daily chart, signaling a potential bullish reversal. Price is trading above a key support zone and is pushing through descending resistance with strong momentum. A move toward higher targets seems likely if the breakout holds.
Resistance 1: $0.22
Resistance 2: $0.27
Resistance 3: $0.40
Stop Loss: $0.14
$HBAR Double breakout!!CRYPTOCAP:HBAR has officially broken out of the descending channel and completed a clean inverse head-and-shoulders pattern—one of technical analysis's most reliable bullish reversal signals!
Chart Pattern: Inverse Head & Shoulders
Trend Reversal Confirmed
🔹 Left Shoulder ✅
🔹 Head ✅
🔹 Right Shoulder ✅
🔹 Breakout + Retest Zone Holding Strong!
This bullish confirmation, paired with a reclaim above the 200-day EMA, sets the stage for a potential massive upside move, with the target pointing toward $0.40+.
Don’t ignore technicals — trade with clarity, not emotions.

#HBAR/USDT#HBAR
The price is moving within a descending channel on the 1-hour frame, adhering well to it, and is heading for a strong breakout and retest.
We are seeing a bounce from the lower boundary of the descending channel, which is support at 0.1870.
We have a downtrend on the RSI indicator that is about to be broken and retested, supporting the upward trend.
We are looking for stability above the 100 Moving Average.
Entry price: 0.19000
First target: 0.1935
Second target: 0.1970
Third target: 0.2001

HBARUSDT – Bull Flag Breakout Confirmed!The recent price action on HBARUSDT is showing a classic bull flag breakout — a powerful continuation pattern often seen in strong uptrends.
Bull Flag Breakdown:
Flagpole:
Prior to consolidation, HBAR saw a massive rally of over 780%, forming a steep vertical move — this sets the stage as the flagpole.
Flag Formation:
Price entered a downward sloping channel with clear lower highs and lower lows. This consolidation formed the flag, which indicates temporary cooling before the next leg up.
Breakout & Retest:
HBAR broke out of the flag’s resistance, followed by a successful retest of the breakout zone and a bounce off the 0.5 Fibonacci level — all signs of strong technical confirmation.
With this breakout, HBAR is likely to follow through with a measured move, aiming for key targets:
TP1 (Futures): 0.24985
TP2 (Futures): 0.28904
TP1 (Spot): 0.57177
TP2 (Spot): 1.23275+
These targets align with historical resistance and projected flagpole extensions.
If you find this analysis helpful, please hit the like button to support my content! Share your thoughts in the comments, and feel free to request any specific chart analysis you’d like to see.
Happy Trading!!

HBARUSDT 4DHBAR ~ 4D Analysis
#HBAR The next goal is very clear, this will re -test this support. buy gradually from here with a short -term target of at least 15%+

HBARUSDT Bull FlagHBARUSDT is currently forming a promising bull flag pattern on the daily chart.
Bullish Scenario:
If you're not in the trade yet, you can consider entering now for a potential long-term position, or wait for a confirmed breakout followed by a retest for added confirmation.
Bearish Scenario:
If the price breaks down from the bull flag, the next major support lies around the 800 SMA on the 8H, 12H, and daily timeframes.
!!! REMINDER !!!
Always pay attention to the signals when you're in a profitable trade. Secure your gains and consider re-entering on the next pullback.
Be Patient - Don't Panic - Trade Emotionless

HBAR ETF FILING WITH NASDAQ: SPOT LONG HBAR!For people who follow me for a while, know that I'm bullish on HBAR as it's simply the most secure, fastest, cheapest and most energy efficient Layer 1 in the crypto space.
The HBAR ETF has been in the air since december leading to roughly a 8x in price for HBAR. Now, we have an ammended filed (a few changes after comments from the SEC) and a listing proposal for the Nasdaq. So it's about to get real!
DO NOT USE LEVERAGE, YOU WILL GET REKT, JUST BUT ON SPOT - NFA
According to Bloomberg ETF analyst Eric Balchunas the HBAR and Litecoin ETF's will be listed this year. With the ammended filing, HBAR is now in pole position to be the first altcoin ETF after BTC & ETH. Tie that up with massive institutional backing HBAR has from the likes of Google, Tata, IBM, Dell and many more, you can expect some fireworks.
This is the part of the cycle where winners will be chosen, and I believe HBAR is one of them!
First target is $0.30, then $0.40, if $0.40 is broken, we can run to $1 or more...

#HBAR/USDT Ready to go up#HBAR
The price is moving in a descending channel on the 1-hour frame and is adhering to it well and is heading to break it strongly upwards
We have a bounce from the lower limit of the descending channel, this support is at a price of 0.29200
We have a downtrend on the RSI indicator that is about to be broken, which supports the rise
We have a trend to stabilize above the moving average 100
Entry price 0.3160
First target 0.3372
Second target 0.36075
Third target 0.38900
