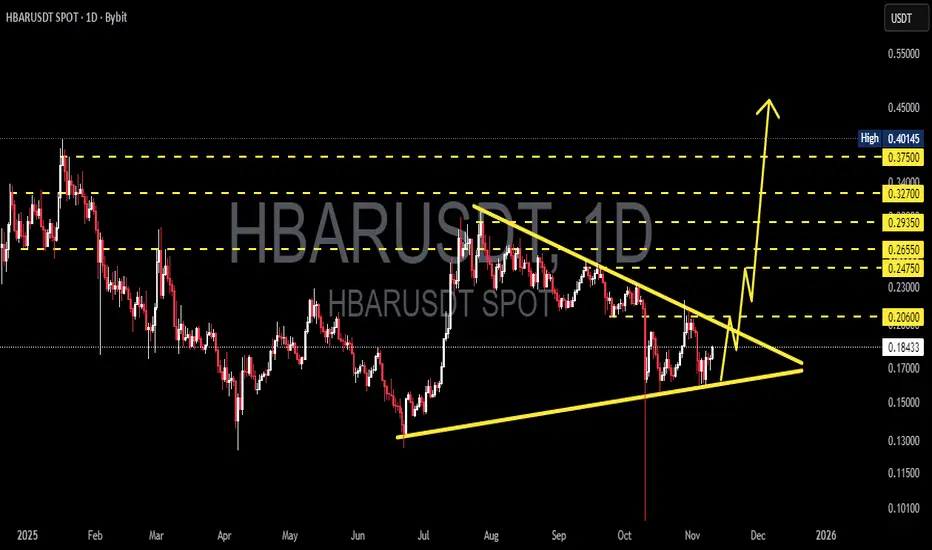
HBAR/USDT — Massive Move Loading! Symmetrical Triangle Breakout?HBAR is currently sitting at the edge of a Symmetrical Triangle formation that has been developing since July 2025 — a phase where price compression hints at massive volatility ahead.
Over the past few months, HBAR has been printing higher lows and lower highs, showing a tight battle between buyers and sellers. The key level to watch is $0.2060 — a decisive breakout above this level could determine the next major trend direction.
---
🔵 Bullish Scenario
If price breaks and closes above $0.2060 with rising volume, it would signal a bullish breakout.
Potential upside targets are set at:
➡️ $0.2475 – $0.2655 – $0.2935 – $0.3270 – $0.3750.
A sustained breakout could push HBAR toward the major resistance zone around $0.38–$0.40.
---
🔴 Bearish Scenario
If sellers regain control and price breaks below the ascending trendline (around $0.17),
a potential slide toward $0.15 – $0.13 – and $0.10 could unfold.
This would mark a strong bearish continuation following the long consolidation phase.
---
⚙️ Pattern & Momentum
Pattern: Symmetrical Triangle (neutral — waiting for direction).
Momentum: Price compression signals a potential volatility explosion.
Volume: Still decreasing, suggesting energy is being stored before the next move.
Once volume spikes alongside a breakout, the direction will become clear.
---
💡 Conclusion
HBAR is approaching a make-or-break zone — truly The Calm Before the Storm.
This triangle pattern represents the final compression before a decisive move.
Patient traders waiting for confirmation could find the best risk-reward setup here.
> “When the market breathes in (consolidates), it always breathes out explosively.”
---
📈 Key Levels
Major Resistances: 0.2060 – 0.2475 – 0.2655 – 0.2935 – 0.3270 – 0.3750
Critical Supports: 0.17 – 0.15 – 0.13 – 0.10
---
#HBAR #HBARUSDT #CryptoAnalysis #SymmetricalTriangle #BreakoutAlert #HBARBreakout #AltcoinAnalysis #CryptoChart #TechnicalAnalysis #CryptoTA #BullishScenario #BearishScenario #TrianglePattern #VolatilityIncoming
Hbarusdc
HBAR/USDT — The Final Defense Zone Before a Major Reversal?HBAR is now standing at one of its most critical levels in the mid-term structure.
After the strong rally in late 2024, price has returned to the major demand zone at $0.141 – $0.12, which previously acted as the launchpad for the last significant bullish move.
The latest candle printed a long lower wick, indicating a possible liquidity sweep — where the market likely hunted stop-losses from retail traders before a potential reversal.
However, without a solid bullish confirmation candle, this could also signal the beginning of a structural breakdown.
---
Pattern and Market Structure:
Technically, HBAR is forming a wide consolidation range with lower highs, showing a period of indecision after a strong uptrend.
The demand block between $0.141 – $0.12 now stands as the last line of defense for buyers to maintain macro structure.
If this zone holds, a strong rebound may follow.
But if it breaks down, the trend could shift into a macro bearish phase.
---
Bullish Scenario:
If price holds above $0.141 – $0.12 and manages to close above $0.1638–$0.1785, it would confirm a potential reversal pattern.
Next bullish targets lie at:
$0.2143 – $0.2540 → first supply zone
$0.2925 – $0.3632 → major resistance range
$0.4014 → top of the macro range
A strong 4D bullish candle closing above $0.1785 would signal that institutional buyers are stepping back in.
---
Bearish Scenario:
If the 4D candle closes below $0.12, it would confirm a structural breakdown from the macro support range.
In this case, HBAR could drop further toward $0.09 – $0.07, and if bearish momentum accelerates, possibly retest the historical low around $0.0416.
Such a move would confirm that smart money has exited the range, opening the door to a deeper bearish phase.
---
Conclusion:
HBAR is currently at its make-or-break level.
The $0.141 – $0.12 zone acts as the final stronghold for buyers to defend the bullish macro structure.
A strong bounce from this zone could trigger a major reversal, but a confirmed breakdown below $0.12 would shift the entire market sentiment bearish.
This is the moment where HBAR decides whether it’s ready to reborn or collapse to deeper lows.
---
#HBAR #HBARUSDT #Hedera #CryptoAnalysis #SmartMoney #LiquiditySweep #ReversalZone #SupplyDemand #PriceAction #AltcoinAnalysis #CryptoReversal

HBARUSDT — Retest of Demand Zone After Breakout?HBAR/USDT is currently in a crucial retest phase after a strong breakout from its key accumulation zone around 0.199–0.217 (yellow box, Fib 0.5–0.618 area). The recent rally toward 0.29–0.30 highlighted strong buying momentum, but price is now consolidating near 0.243, suggesting a healthy pullback before the next potential move.
This structure often signals a bullish retest after breakout — but if key support levels are lost, it could trigger a deeper correction.
---
🔍 Structure & Pattern
Previous phase: HBAR traded sideways for months within a large range.
Recent move: Clean breakout above the accumulation zone.
Current phase: Retesting the demand zone.
Pattern in play: Bullish Retest / Flag Consolidation on the daily timeframe.
Bullish continuation trigger: Daily close above 0.29197 with volume confirmation.
Bearish invalidation: Daily close below 0.19928 (Fib 0.618).
---
📌 Key Technical Levels (1D)
Support (Demand Zone):
0.21707 (Fib 0.5) → first line of defense.
0.19928 (Fib 0.618) → strongest support; bullish invalidation if broken.
Resistance Levels:
0.26511 → minor resistance.
0.29197 → major resistance / breakout trigger.
0.33037 → TP1.
0.37526 → TP2.
0.40139 → local high & ultimate mid-term target.
Downside targets (if breakdown):
0.160–0.140 → prior consolidation zone.
0.093–0.087 → historical low.
---
🚀 Bullish Scenarios
1. Conservative (Breakout Buyer):
Entry: Daily close above 0.29197
Stop: Below 0.26511
Targets: 0.33037 / 0.37526
Potential reward: +35% to +54% from current levels
2. Aggressive (Buy the Dip):
Entry: 0.217–0.199 demand zone
Stop: Below 0.199 (bullish invalidation)
Targets: 0.265 / 0.292 / 0.330
Attractive R:R potential (>1:3) if demand holds
---
⚠️ Bearish Scenarios
1. Breakdown of 0.199:
Daily close below 0.199 → structure invalidated.
Downside targets: 0.16 → 0.14, and possibly 0.087 (historical low).
2. Rejection at Resistance:
Failure to break 0.292 + formation of a lower-high = possible range or distribution phase.
Price could revisit 0.217 demand zone again.
---
📈 Strategy & Risk Management
Aggressive traders: Buy dips at 0.217–0.199 with tight stops.
Conservative traders: Wait for confirmation above 0.292 before entering.
Risk management: Limit exposure to 1–2% per trade.
Extra confirmation: Watch for volume spikes or bullish candlestick reversals (hammer, engulfing) in demand zones.
---
✅ Conclusion
HBAR is in a critical demand retest. As long as 0.217–0.199 holds, the bias remains bullish, with mid-term targets at 0.33–0.37. A daily close below 0.199, however, would shift momentum bearish and open the door to a much deeper correction.
HBAR offers a high R:R opportunity for both aggressive dip buyers and conservative breakout traders — making it one of the setups to watch closely in the coming weeks.
#HBAR #HBARUSDT #Hedera #Crypto #TechnicalAnalysis #PriceAction #SwingTrade #Fibonacci

HBARUSDT Trendline Breakout - Target 150%!HBARUSDT is currently attempting a breakout from a long-standing descending trendline on the daily chart. The price has reclaimed a key demand zone and is now trading above both the 50 and 100 EMA, a bullish technical signal suggesting bullish momentum.
If the breakout sustains, HBAR could target the 0.30–0.55 range in the coming weeks. Holding above the EMAs and trendline retest will be crucial for confirmation.

HBARUSDT 4D AnalysisHBAR ~ 4D Analysis
#HBAR This is the closest support for now. Buy if you still have faith in this coin with a short term target of at least 15%+ from here.

HBAR is one of the most important cryptos to own long term.Hedera's technology is leaps and bounds ahead of nearly every other crypto in the space, both in terms of current capabilities and future potential. If you own crypto, you'd be crazy, in my opinion, not to hold HBAR.
Good luck, and always use a stop-loss!

HBAR's future is so bright, it has to wear shades!HBAR is a favorite among many crypto investors, and, in my opinion, has potential that many cryptos don’t have, as its technology is top-notch and also has the backing of BlackRock, which, as you know, has a pile of cash that could stretch from Earth to Mars.
Currently displaying a pattern similar to that of XRP, in a broadening wedge pattern and currently on the 5th wave of its internal wave count, HBAR could see some serious price appreciation over the coming months—assuming the buyers step back into the market for what has historically been called 'alt-coin season.'
This is definitely one to keep your eyes on.
Good luck, and always use a stop loss!

#HBAR/USDT Ready to go up#HBAR
The price is moving in a descending channel on the 1-hour frame and is adhering to it well and is heading to break it strongly upwards
We have a bounce from the lower limit of the descending channel, this support is at a price of 0.29200
We have a downtrend on the RSI indicator that is about to be broken, which supports the rise
We have a trend to stabilize above the moving average 100
Entry price 0.3160
First target 0.3372
Second target 0.36075
Third target 0.38900

HBAR is currently trading at equilibrium.Using my "grafting" trading technique, HBAR is currently trading exactly at the point of equilibrium. This could be either bullish or bearish, depending on the pattern, but it appears that HBAR could potentially drop down to #4 on the wave count, sweeping the lows before making a significant move to the upside.
Nothing in trading is guaranteed, but this pattern plays out in the same fashion frequently.
Good luck, and always use a stop loss!

If the current pattern plays out, HBAR could see 50% gains...HBAR is showing a very interesting pattern on the daily chart, and if it plays out properly, the price could appreciate by 50% in short order. With the right entry, this could become your best leveraged trade of the year.
Good luck, and always use a stop-loss!

HBAR looks to be forming a nice Cup & Handle pattern!HBAR has been on an absolute tear as of late, but it appears that the momentum is slowing. If it does, it is likely to pull back deeper into the wedge pattern and is also likely to form a 'handle' pattern to accompany the cup it has now formed. This would be a great opportunity to short as the handle forms and go long once it has bottomed and the price action breaks out, finishing the pattern.
Good luck, and always use a stop loss!

HBAR BREAKOUT APPEARS IMMINENT! A major breakout appears to be imminent for HBAR! If you’ve seen the most recent HBAR chart I posted, you'll notice that HBAR is now at the very bottom of the handle in a 31-month Cup & Handle formation on the weekly and daily charts. Additionally, HBAR has formed and broken out of a very promising inverted head and shoulders pattern on the 1-hour, 2-hour, 3-hour, and 4-hour charts, and is currently retesting the neckline as I write this article. It is also near the bottom of the wedge pattern and very close to the previously established low range on the chart.
I believe we are about to see a significant breakout in the next few days, which could lead to a period of notable price appreciation in the short term. With the Cup & Handle pattern I’ve identified, this trend could continue over the next year as well.
Good luck, and always use a stop loss!

HBAR is forming a MASSIVE 31 MONTH Cup & Handle!For the past 31 months, HBAR has been forming a massive Cup & Handle formation on the daily and weekly charts. The Fibonacci retracement levels indicate that we could see a 6x move in the next 8 to 12 months. There are quite a few cryptocurrencies displaying Cup & Handle patterns on longer-term timeframes, which is a very positive sign that we are about to see a market-wide bull run during that period.
Good luck, and always use a stop loss!

A great buying opportunity for HBAR.The recent 'crushing of all hope' in the crypto markets has presented a very good buying opportunity. Is it the bottom? Who knows, but I'll take half priced assets all day long!
Good luck!

The time is drawing near for HBAR.After the amazing rally that we saw a few months ago, the price of HBAR has been decreasing steadily with the broader crypto market, allowing retail investors to stockpile the asset.
Enjoy the ride!

HBAR decides to melt faces!HBAR is up more than 60% on the day after receiving some good news regarding it's usage by institutions. This is just a taste-test of what's coming for the right cryptos!
Good luck, and always use a stop!

Another look at the current HBAR chart.There's a lot of room for HBAR to increase in price. If the trend continues, we could see a dramatic increase in the price of HBAR over the next six months to a year.
Good luck, and always use a stop-loss!

HBAR'S biggest percentage gain so far, is YET TO COME!Since I predicted the coming cup & handle pattern well before anyone else on Jan 2nd, HBAR has broken out of the cup's handle and ran for more than a 100% gain. The price peaked, dropped, and retested the rim-line; now it's going to make the biggest gain of the entire pattern.
Buckle your seatbelts!
Good luck, and always use a stop-loss!

HBAR 1H BULLISH WAVEHBAR is swinging in range for past two weeks and it is ready to make some move from here, stop loss should be just below the daily close and targets should be 15-20%.

HBAR long-term Cup & Handle pattern on the daily chart.This is an expanded version of the previous HBAR cup & handle chart I posted. This one includes a date moniker, and an expanded u-shape to help judge the overall time frame involved, assuming the chart pattern plays out.

HBAR will DOUBLE in the next 6 to 8 weeks!HBAR has been forming a very clear cup & handle formation for the past 10 months (since February 2023), and is now starting to work on creating the handle. HBAR has nearly doubled since mid October and over the next six to eight weeks WILL DOUBLE AGAIN!
Pick your spots, pack your bags and buckle your seatbelts!
The journey to the moon first starts with an ignition!

HBAR taking off ?HBAR analysis
Multi-year trend line has been backtested.
12 EMA + Vegas chart indicator not showing buy yet (indicators lag)
Daily count shown. Notice trend line (log) has been broken and backtested.
8 hr count is tricky - I suspect HBAR is bullish and starting a diagonal. If I'm wrong, well then that sucks. 😆
1 hr count - in corrective mode right now. I show some ideas.

HBAR is going to do very well over the next few months.HBAR is looking really good on the technicals. HBAR will do really well for those who are patient and can hold a position for multiple years to a decade.
