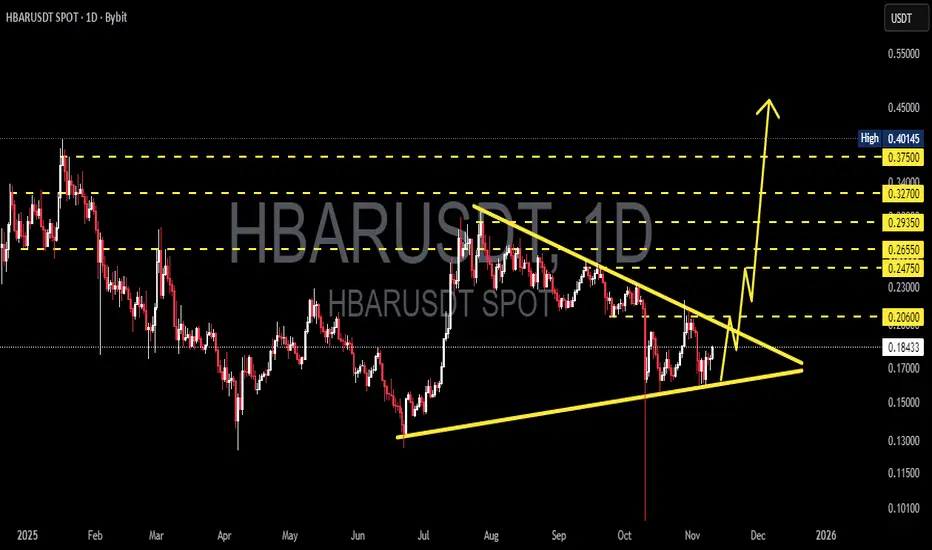
HBAR/USDT — Massive Move Loading! Symmetrical Triangle Breakout?HBAR is currently sitting at the edge of a Symmetrical Triangle formation that has been developing since July 2025 — a phase where price compression hints at massive volatility ahead.
Over the past few months, HBAR has been printing higher lows and lower highs, showing a tight battle between buyers and sellers. The key level to watch is $0.2060 — a decisive breakout above this level could determine the next major trend direction.
---
🔵 Bullish Scenario
If price breaks and closes above $0.2060 with rising volume, it would signal a bullish breakout.
Potential upside targets are set at:
➡️ $0.2475 – $0.2655 – $0.2935 – $0.3270 – $0.3750.
A sustained breakout could push HBAR toward the major resistance zone around $0.38–$0.40.
---
🔴 Bearish Scenario
If sellers regain control and price breaks below the ascending trendline (around $0.17),
a potential slide toward $0.15 – $0.13 – and $0.10 could unfold.
This would mark a strong bearish continuation following the long consolidation phase.
---
⚙️ Pattern & Momentum
Pattern: Symmetrical Triangle (neutral — waiting for direction).
Momentum: Price compression signals a potential volatility explosion.
Volume: Still decreasing, suggesting energy is being stored before the next move.
Once volume spikes alongside a breakout, the direction will become clear.
---
💡 Conclusion
HBAR is approaching a make-or-break zone — truly The Calm Before the Storm.
This triangle pattern represents the final compression before a decisive move.
Patient traders waiting for confirmation could find the best risk-reward setup here.
> “When the market breathes in (consolidates), it always breathes out explosively.”
---
📈 Key Levels
Major Resistances: 0.2060 – 0.2475 – 0.2655 – 0.2935 – 0.3270 – 0.3750
Critical Supports: 0.17 – 0.15 – 0.13 – 0.10
---
#HBAR #HBARUSDT #CryptoAnalysis #SymmetricalTriangle #BreakoutAlert #HBARBreakout #AltcoinAnalysis #CryptoChart #TechnicalAnalysis #CryptoTA #BullishScenario #BearishScenario #TrianglePattern #VolatilityIncoming
Hbarusdtanalysis
HBAR/USDT — The Final Defense Zone Before a Major Reversal?HBAR is now standing at one of its most critical levels in the mid-term structure.
After the strong rally in late 2024, price has returned to the major demand zone at $0.141 – $0.12, which previously acted as the launchpad for the last significant bullish move.
The latest candle printed a long lower wick, indicating a possible liquidity sweep — where the market likely hunted stop-losses from retail traders before a potential reversal.
However, without a solid bullish confirmation candle, this could also signal the beginning of a structural breakdown.
---
Pattern and Market Structure:
Technically, HBAR is forming a wide consolidation range with lower highs, showing a period of indecision after a strong uptrend.
The demand block between $0.141 – $0.12 now stands as the last line of defense for buyers to maintain macro structure.
If this zone holds, a strong rebound may follow.
But if it breaks down, the trend could shift into a macro bearish phase.
---
Bullish Scenario:
If price holds above $0.141 – $0.12 and manages to close above $0.1638–$0.1785, it would confirm a potential reversal pattern.
Next bullish targets lie at:
$0.2143 – $0.2540 → first supply zone
$0.2925 – $0.3632 → major resistance range
$0.4014 → top of the macro range
A strong 4D bullish candle closing above $0.1785 would signal that institutional buyers are stepping back in.
---
Bearish Scenario:
If the 4D candle closes below $0.12, it would confirm a structural breakdown from the macro support range.
In this case, HBAR could drop further toward $0.09 – $0.07, and if bearish momentum accelerates, possibly retest the historical low around $0.0416.
Such a move would confirm that smart money has exited the range, opening the door to a deeper bearish phase.
---
Conclusion:
HBAR is currently at its make-or-break level.
The $0.141 – $0.12 zone acts as the final stronghold for buyers to defend the bullish macro structure.
A strong bounce from this zone could trigger a major reversal, but a confirmed breakdown below $0.12 would shift the entire market sentiment bearish.
This is the moment where HBAR decides whether it’s ready to reborn or collapse to deeper lows.
---
#HBAR #HBARUSDT #Hedera #CryptoAnalysis #SmartMoney #LiquiditySweep #ReversalZone #SupplyDemand #PriceAction #AltcoinAnalysis #CryptoReversal

HBARUSDCOINBASE:HBARUSD try to break 0.257$ but we hope up-trend in last reaction to 0.257$ an break this level.
Best support: 0.239 - 0.230
Best resistance: 0.257 - 0.277 - 0.292
Please control risk management⚠️

What To Expect From HBAR Price In September 2025?At the time of writing, BINANCE:HBARUSDT trades at $0.218, down 9% over the past month. The persistent outflows suggest continued weakness, leaving the altcoin vulnerable to further decline. Should selling continue, HBAR could slip to $0.205, extending its drawdown and reinforcing bearish momentum in the short term.
Historically, September has been a poor month for BINANCE:HBARUSDT . On average, the token has declined 10% during this period, with a median drop of 5%. Based on this pattern, the probability of another drawdown remains elevated, aligning with current technical signals that highlight weakening support levels.
If inflow returns and investor sentiment improves, BINANCE:HBARUSDT could bounce back to reclaim the $0.230 support. Holding this level would be crucial for triggering recovery. A complete reversal would require the token to climb toward $0.271 or higher, signaling renewed strength after months of bearish market activity.

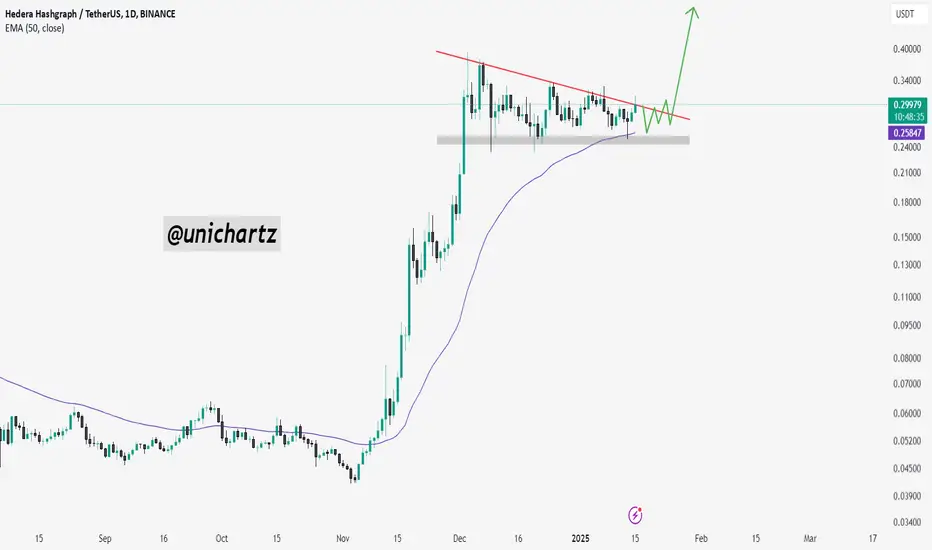
HBARUSDT — Retest of Demand Zone After Breakout?HBAR/USDT is currently in a crucial retest phase after a strong breakout from its key accumulation zone around 0.199–0.217 (yellow box, Fib 0.5–0.618 area). The recent rally toward 0.29–0.30 highlighted strong buying momentum, but price is now consolidating near 0.243, suggesting a healthy pullback before the next potential move.
This structure often signals a bullish retest after breakout — but if key support levels are lost, it could trigger a deeper correction.
---
🔍 Structure & Pattern
Previous phase: HBAR traded sideways for months within a large range.
Recent move: Clean breakout above the accumulation zone.
Current phase: Retesting the demand zone.
Pattern in play: Bullish Retest / Flag Consolidation on the daily timeframe.
Bullish continuation trigger: Daily close above 0.29197 with volume confirmation.
Bearish invalidation: Daily close below 0.19928 (Fib 0.618).
---
📌 Key Technical Levels (1D)
Support (Demand Zone):
0.21707 (Fib 0.5) → first line of defense.
0.19928 (Fib 0.618) → strongest support; bullish invalidation if broken.
Resistance Levels:
0.26511 → minor resistance.
0.29197 → major resistance / breakout trigger.
0.33037 → TP1.
0.37526 → TP2.
0.40139 → local high & ultimate mid-term target.
Downside targets (if breakdown):
0.160–0.140 → prior consolidation zone.
0.093–0.087 → historical low.
---
🚀 Bullish Scenarios
1. Conservative (Breakout Buyer):
Entry: Daily close above 0.29197
Stop: Below 0.26511
Targets: 0.33037 / 0.37526
Potential reward: +35% to +54% from current levels
2. Aggressive (Buy the Dip):
Entry: 0.217–0.199 demand zone
Stop: Below 0.199 (bullish invalidation)
Targets: 0.265 / 0.292 / 0.330
Attractive R:R potential (>1:3) if demand holds
---
⚠️ Bearish Scenarios
1. Breakdown of 0.199:
Daily close below 0.199 → structure invalidated.
Downside targets: 0.16 → 0.14, and possibly 0.087 (historical low).
2. Rejection at Resistance:
Failure to break 0.292 + formation of a lower-high = possible range or distribution phase.
Price could revisit 0.217 demand zone again.
---
📈 Strategy & Risk Management
Aggressive traders: Buy dips at 0.217–0.199 with tight stops.
Conservative traders: Wait for confirmation above 0.292 before entering.
Risk management: Limit exposure to 1–2% per trade.
Extra confirmation: Watch for volume spikes or bullish candlestick reversals (hammer, engulfing) in demand zones.
---
✅ Conclusion
HBAR is in a critical demand retest. As long as 0.217–0.199 holds, the bias remains bullish, with mid-term targets at 0.33–0.37. A daily close below 0.199, however, would shift momentum bearish and open the door to a much deeper correction.
HBAR offers a high R:R opportunity for both aggressive dip buyers and conservative breakout traders — making it one of the setups to watch closely in the coming weeks.
#HBAR #HBARUSDT #Hedera #Crypto #TechnicalAnalysis #PriceAction #SwingTrade #Fibonacci

HBAR Eyes Bitcoin for Price Recovery Amid Market UncertaintyBINANCE:HBARUSDT is currently consolidating, trading at $0.255 while oscillating between $0.271 and $0.244 . The narrow range reflects investor caution, with traders awaiting external market cues. Without a decisive breakout, the altcoin may continue drifting sideways in the immediate term.
If Bitcoin strengthens and resumes its rally, BINANCE:HBARUSDT could break resistance at $0.271. Such a move may open the door for gains toward $0.291, with potential upside extending further if bullish conditions persist.
Alternatively, a Bitcoin downturn could drag BINANCE:HBARUSDT lower, pushing it beneath $0.244 support. In such a scenario, the altcoin risks falling to $0.230, undermining the bullish thesis and reinforcing caution among investors.

HBARUSDT 4D AnalysisHBAR ~ 4D Analysis
#HBAR This is the closest support for now. Buy if you still have faith in this coin with a short term target of at least 15%+ from here.

$HBAR Double breakout!!CRYPTOCAP:HBAR has officially broken out of the descending channel and completed a clean inverse head-and-shoulders pattern—one of technical analysis's most reliable bullish reversal signals!
Chart Pattern: Inverse Head & Shoulders
Trend Reversal Confirmed
🔹 Left Shoulder ✅
🔹 Head ✅
🔹 Right Shoulder ✅
🔹 Breakout + Retest Zone Holding Strong!
This bullish confirmation, paired with a reclaim above the 200-day EMA, sets the stage for a potential massive upside move, with the target pointing toward $0.40+.
Don’t ignore technicals — trade with clarity, not emotions.

HBARUSDT – Bull Flag Breakout Confirmed!The recent price action on HBARUSDT is showing a classic bull flag breakout — a powerful continuation pattern often seen in strong uptrends.
Bull Flag Breakdown:
Flagpole:
Prior to consolidation, HBAR saw a massive rally of over 780%, forming a steep vertical move — this sets the stage as the flagpole.
Flag Formation:
Price entered a downward sloping channel with clear lower highs and lower lows. This consolidation formed the flag, which indicates temporary cooling before the next leg up.
Breakout & Retest:
HBAR broke out of the flag’s resistance, followed by a successful retest of the breakout zone and a bounce off the 0.5 Fibonacci level — all signs of strong technical confirmation.
With this breakout, HBAR is likely to follow through with a measured move, aiming for key targets:
TP1 (Futures): 0.24985
TP2 (Futures): 0.28904
TP1 (Spot): 0.57177
TP2 (Spot): 1.23275+
These targets align with historical resistance and projected flagpole extensions.
If you find this analysis helpful, please hit the like button to support my content! Share your thoughts in the comments, and feel free to request any specific chart analysis you’d like to see.
Happy Trading!!

$HBAR Near Key Resistance: Will the Bull Flag Explode?CRYPTOCAP:HBAR is trading within a bull flag on the 2-day chart, holding just below a key resistance zone that was previously support. The 100 EMA is also acting as a dynamic barrier here.
A breakout above $0.188 with strong volume could trigger the next bullish leg.
But if resistance holds, a short-term pullback might follow.
DYOR, NFA

HBARUSDT 4DHBAR ~ 4D Analysis
#HBAR The next goal is very clear, this will re -test this support. buy gradually from here with a short -term target of at least 15%+

HBAR Hanging by a Thread! A Breakdown Could Be Brutal!Yello, Paradisers! Is #HBAR about to crumble under selling pressure? The charts are flashing red flags, and bulls are barely holding on! Let’s break it down.
💎#HBARUSDT is clinging to a crucial support zone between $0.1900 – $0.1785—a level that has held strong since December 2024. However, with repeated tests, this support is starting to weaken, signaling potential trouble ahead. Sellers are building pressure, and if bulls fail to defend the $0.1750 level, HBAR could face a sharp drop toward $0.1500, where a short-term short-squeeze might offer some temporary relief.
💎However, if selling momentum persists, the decline could extend further, dragging HBAR down to the $0.1300 – $0.1175 zone, where higher time-frame supports are present. This area is more likely to trigger strong short-covering and attract fresh buying interest, potentially setting the stage for a recovery.
💎On the upside, bulls are trapped under heavy resistance at $0.24, with a critical barrier at $0.26 – $0.275. Until this level is broken with conviction, HBAR remains vulnerable to further downside.
Paradisers, as always, patience and precision are key in this market. This isn’t a time for reckless trades—let the levels guide you, trade strategically, and stay disciplined.
MyCryptoParadise
iFeel the success🌴

HBAR Holding Key Support—Is a Sharp Rebound Coming?Yello, Paradisers! #HBAR has been one of the hottest altcoins in late 2024 and early 2025, but now, a deeper correction is unfolding. Could we see more downside, or is there still an upside push left before the next drop? Let’s break it down.
💎Right now, #HBARUSDT is forming an ABC corrective pattern, which suggests further downside in the coming weeks. However, before sellers take full control, Wave B upside is brewing, meaning a short-term bounce could be on the way.
💎So far, HBAR has twice held the strong support zone at $0.180 - $0.165—a critical area that previously acted as resistance. The initial reaction was strong, but bulls are now retesting this zone. Another bounce from here is expected, potentially setting up a short-term rally.
💎For this corrective push to materialize, bulls need to break above the descending resistance at $0.210. If that happens, we could see a quick rally towards $0.240 - $0.260, mainly driven by short-covering. However, this range is heavy resistance, making it difficult for bulls to push much higher.
💎If momentum stays strong, HBAR could extend its rally to the key resistance at $0.295 - $0.310, where a strong Fibonacci retracement is positioned. This is a strong resistance, and a level that marks completion of the Wave B, eventually leading to the next lower impulse.
Paradisers, the market remains choppy, and patience is key. Let the setup develop and avoid chasing weak moves—trade smart!
MyCryptoParadise
iFeel the success🌴

#HBARUSDT remains under seller pressure—expecting further declin📉 SHORT BYBIT:HBARUSDT.P from $0.21913
🛡 Stop Loss: $0.22070
⏱ 1H Timeframe
✅ Overview:
➡️ BYBIT:HBARUSDT.P continues trading in a downtrend, staying below the key level of $0.21913, which could act as a short entry point.
➡️ POC (Point of Control) is positioned above the current price, indicating strong liquidity and selling pressure.
➡️ The price failed to hold above $0.22070, reinforcing the bearish scenario.
➡️ If local lows are broken, further downside movement is expected.
⚡ Plan:
➡️ Enter short below $0.21913, confirming the bearish momentum.
➡️ Risk management via Stop-Loss at $0.22070, placed above the nearest resistance.
🎯 TP Targets:
💎 TP1: $0.21792
🔥 TP2: $0.21594
🚀 BYBIT:HBARUSDT.P remains under seller pressure—expecting further decline!
📢 BYBIT:HBARUSDT.P is showing weakness in the market. If the price breaks below $0.21913, increased selling momentum may lead to $0.21792 – $0.21594. However, if the price rebounds above $0.22070, a short-term recovery could occur.

HBARUSD - Weekly forecast, Technical Analysis & Trading IdeasMidterm forecast:
While the price is below the resistance 0.40089, beginning of downtrend is expected.
We make sure when the support at 0.22979 breaks.
If the resistance at 0.40089 is broken, the short-term forecast -beginning of downtrend- will be invalid.
Technical analysis:
A peak is formed in daily chart at 0.40140 on 01/17/2025, so more losses to support(s) 0.29204, 0.26950, 0.24919 and minimum to Major Support (0.22979) is expected.
Take Profits:
0.29204
0.34000
0.37397
0.47800
0.57563
__________________________________________
❤️ If you find this helpful and want more FREE forecasts in TradingView,
. . . . . Please show your support back,
. . . . . . . . Hit the 👍 BOOST button,
. . . . . . . . . . . Drop some feedback below in the comment!
🙏 Your Support is appreciated!
Let us know how you see this opportunity and forecast.
Have a successful week,
ForecastCity Support Team
0.57563

HBAR/USDT Approaches Apex: Bullish Breakout Ahead?HBAR/USDT is currently trading within a bull flag pattern and approaching the apex. A potential bullish breakout may be on the horizon.
The price has faced multiple rejections from the descending trendline but has consistently found strong support at the lower support zone. Keep an eye on the price action for a possible upward move.
DYOR, NFA
HBAR / USDT : Retest in progress, pump imminent HBAR/USDT: Retest in Progress, Pump Imminent 🚀
HBAR/USDT has successfully broken out of its key resistance zone and is now retesting the breakout level 🔄. This retest phase is crucial and could confirm the start of a strong bullish trend 📈. With momentum building up, a significant pump might be on the horizon.
Key insights:
1. Breakout confirmed: HBAR/USDT has cleared a critical resistance level, indicating strong buyer interest 💥. The ongoing retest could establish this level as a new support zone, paving the way for a bullish rally 🚀.
2. Volume support: Watch for increased trading volume during the retest and the next upward move to confirm sustained bullish strength 🔥.
3. Bullish momentum: Indicators like RSI and MACD are showing positive trends, signaling potential upward continuation ⚡.
Steps to validate the pump:
Monitor the retest: Ensure that the price holds above the breakout level on the 4H or daily timeframe ✅.
Look for bullish candlestick patterns, such as engulfing candles, as confirmation of a successful retest 📍.
Volume confirmation: A surge in volume after the retest can indicate strong buying pressure 📊.
Be cautious of a failed retest or a fakeout, as these could lead to short-term pullbacks ⚠️.
Risk management strategies:
Place a stop-loss below the retest zone to protect against unexpected reversals 🔒.
Adjust position sizes to match your risk tolerance and trading plan 🎯.
Set realistic profit targets and monitor for signs of weakening momentum as the price rises 🔍.
HBAR/USDT is gearing up for a potentially explosive move, but patience and discipline are key. Stay vigilant and wait for confirmation before taking action 📊.
Disclaimer: This analysis is for educational purposes only and not financial advice. Always DYOR before making investment decisions.

HBAR/USDT Long Setup: Bullish Breakout in Sight!$HBAR/USDT Trade Setup (Long Position):
Entry Point:
Enter near the current market price (CMP) of 0.3116 USDT.
Stop-Loss (SL):
Set the stop-loss at 0.2600 USDT to manage downside risk.
Take-Profit (TP) Targets:
TP1: 0.3500 USDT (short-term resistance).
TP2: 0.4000 USDT (next major resistance).
Use 3x leverage to manage risk effectively.
DYOR, NFA

HBAR LONG SET UPTitle: BUY HBAR
Asset: Crypto
Symbol: HBAR/USD
Time Frame: 4hr
Platform: Coinbase
Entry Price 1: $0.28500
Entry Price 2: $0.23500
Stop Loss: $0.18500
Take Profit 1: $0.33500
Take Profit 2: $0.38500
Take Profit 3: $0.43500
Take Profit 4: $0.48500
Status: ACTIVE

HBAR / USDT: Breaking out from Trendline resistance HBAR/USDT: Breaking Out from Trendline Resistance – Bullish Rally Ahead?
HBAR/USDT is making waves 📈 as it breaks through a critical trendline resistance zone 📊. This breakout signals the potential for a strong bullish trend to unfold 🚀. With momentum building, traders should keep a close eye 👀 on this pair for further confirmation and opportunities.
Key insights:
1. Trendline resistance breached: HBAR/USDT has successfully broken a long-standing trendline that previously acted as a barrier. This breakout could pave the way for a significant upward move.
2. Volume surge: A noticeable increase in trading volume accompanies the breakout, indicating strong buyer interest 🔥.
3. Bullish signals: Momentum indicators like RSI and MACD are turning positive ⚡, supporting a continued bullish trend.
Steps to confirm the breakout:
Look for a clear 4H or daily candle closing above the trendline 📍.
Monitor trading volume; a surge confirms strong buying activity 📊.
Watch for a potential retest of the broken trendline, now acting as support, to solidify the breakout ✅.
Stay cautious of fake breakouts, characterized by sharp reversals or wicks above the trendline ⚠️.
Risk management strategies:
Implement stop-loss orders to protect your position and manage risk 🔒.
Size your position wisely, ensuring it aligns with your overall trading strategy 🎯.
This analysis is for educational purposes only and not financial advice. Always conduct your own research (DYOR) 🔍 before making investment decisions.

HBARUSDT - great targets aheadmaking 500% after the breakout of the falling wedge pattern
I had already mentioned it before this mythical pump
Check it👇🏻
Hold on HBAR ...previous ATH is important target
Can get 2$ if it clear the red rectangular
Best regards Ceciliones 🎯

My point of view for HBARDear Follower
I got a multi request to analyze HBAR
I see HBAR most likely will hit $2.15 as a final target
I recommend liquidate 50% of your fund at that price then start use a trilling stop under each last new bottom for the rest of the fund
Good luck everyone

HBARUSDTHBAR ~ 1W
#HBAR Price again retested this key support. If you have Conviction on this Token, This is the right time to start accumulation.
