HDFCBANK : Approaching Key Breakout ZoneOverview: HDFC Bank Ltd. is showing a series of breakout attempts, suggesting a build-up of buying pressure. The stock has repeatedly tested a resistance zone, indicating a potential for a breakout if this level is breached with strong momentum.
Key Levels and Zones:
Resistance Zone (Multiple Breakout Attempts):
The stock has faced resistance around the ₹1,750 - ₹1,760 level on multiple occasions, marking this area as a critical breakout point.
A sustained breakout above this level, particularly on a weekly basis, would signal bullish strength and could lead to a strong upward move.
First Resistance for Retest (₹1,881):
Once the breakout is confirmed, the stock may face initial resistance around ₹1,881, where some consolidation or a retest of the breakout could occur.
Second Resistance for Consolidation (₹1,992):
If the stock sustains above ₹1,881, the next significant resistance level is around ₹1,992. Consolidation at this level could provide additional momentum for further upside.
Target Zone (₹2,231):
Upon clearing the earlier resistance levels, the stock has potential to reach the target zone at ₹2,231, representing a new high and a possible long-term target for investors.
Technical Indicators:
The stock is trading near its 200-week moving average, suggesting it is above a strong long-term support level.
The formation of higher lows indicates an uptrend, adding to the bullish sentiment.
Hdfcbanklongtermview

Hdfcbank moments for intraday, option future trading 02/Dec/2024Hdfcbank moments for intraday, option future trading 02/Dec/2024
follow us for more updates information.
message us for any stocks related information
WELCOME TO ARROWINDEX
We're dedicated to providing you the best of Finance stock market , with a focus on dependability and Investment. We're working to turn our passion for Finance stock market into a booming online.We analyze Live Market and try to Provide learning information Content. All the Live Market views and charts .We hope you enjoy our Finance stock market as much as we enjoy offering them to you.Support and offering
Effective online education modules for all segments of traders
Customized portfolio tracker Online research & trading guidance
Entry and Exit support for:-
Intraday trading,Swing trading,Scalping,Position trading
Future & Delivery trading
Technical analysis
Fundamentals analysis
Fii & Dii data and reports

Hdfcbank moments for intraday and option trading 26/Nov/2024Hdfcbank moments for intraday and option trading 26/Nov/2024
HDFC Bank share price climbed above Rs 1,800 to hit a fresh all-time high on 25 November, as trading volumes saw an extraordinary surge with the MSCI November rebalancing coming into effect. More than 21.5 crore HDFC Bank shares were traded across NSE and BSE — nearly 8.6 times its 20-day moving average volume of 2.5 crore shares. The bulk of the trading activity occurred in the final half-hour of the session, with 19 crore shares sold after 3:00 pm.
The share price of HDFC Bank climbed above Rs 1,800 during the trading session, hitting an all-time high of Rs 1,803.55. It settled at Rs 1,785.6, up 2.3 percent from the previous close.

HDFC BANKHDFC BANK has decisively surpassed the 1600 resistance level. Consider taking a long position upon retesting the 1600 price level.

HDFCBANK--Drop Base Drop??This stock is now at resistance zone.
price previously a strong fall is noticed from top side @ATH Levels,
price is now in consolidation at support levels...
This is the place again we have to look for continuation or reversal again to test the bottom side demand at 1240 zone of support.
keep an eye on these levels.

HDFCBANK--This stock is now in consolidation.
we have a chance of manipulation below support levels...
keep look for buy side from this demand zone...
if price breaks the demand will look for short side continuation...OR Reversal again by bear trap.

HDFCBANK--Drop base Drop?? I am sharing the important levels of Support and Resistance. These levels plays a crucial role in trading decisions, as they act as reliable markers of price movements.
------>>Support levels are price points where an asset tends to find buying interest, preventing it from falling further.
---->Resistance levels, on the other hand, are points where selling pressure typically prevents the asset from rising higher.
Take a look at these levels and trade accordingly. Recognizing and respecting these support and resistance levels can help traders make informed decisions and manage risk effectively. They serve as key reference points for technical analysis and are vital tools in successful trading strategies.
Trade safe...Thank you guys for your support

Great buying opportunity in HDFC BANKPrice is undergoing expanded flat correction.
Good to accumulate around 1200-1300 levels for a target of around 2600 in medium to long term.
Price is heading towards pre covid levels while the revenue & net profit have almost doubled.
Do your own due diligence before taking any action.
Peace!!

HDFC BANK will double till 2027HDFC bank is presently at good levels and the whole market has moved up, but banking sector has not given good returns from the last 3 years. Profit of HDFC bank in 2019 was 22446 crore. The profit didn't decline in 2020 and in 2023 the profit was 46149 crore. The profit doubled but stock price did not This trend will be broken, and the banking sector will give massive returns to cover up the last 3-year performance and will continue with the future growth. HDFC bank will not see 1600 levels in the future under normal circumstances. Can also consider investing in Bankbees. Hope you learned something new. Happy learning, Happy investing.

HDFC BANK SELLHi, According to my analysis of HDFC Bank stock, there is a high probability of a downturn. The price bounced from a very strong area, which is the resistance at 1720. Two very negative candles were formed, as shown in the analysis. We also notice that the stock is trying to break the flat pattern. Finally, good luck to everyone .Note: If you like this analysis, please give your opinion on it. in the comments. I will be happy to share ideas. Like and click to get free content. Thank you

HDFC bank target 2175 Strategy- Cup with handle pattern
CMP- 1688.75
Target- 2175
Approx Gain -30%
Largest bank of Bharat with high net profits and in a consolidation state from past 2 years. Best buy both for short term and long term.

HDFC 19th April (Head and Shoulder Pattern)HDFC Head and shoulders pattern if it breaks 1654 then it can go all the way till 1580.

HAS HDFC BANK GIVEN BREAK OUT/TARGETS FOR NEXT FEW MONTHS ?????Dear traders, I have identified chart levels based on my analysis, major support, and resistance levels. Please note that I am not a SEBI registered member. Information shared here for educational purpose. Please don’t trust me or anyone for trading/investment purpose. Focus on learning how to fish, trust your own skills and please do consult your financial advisor before trading.
HAS HDFC BANK GIVEN CLEAN BREAK OUT ON WEEKLY CHART/BIGGER TIMEFRAME ?????
WHAT ARE THE POSSIBLE TARGETS OF HDFC BANK FOR NEXT FEW MONTHS ?????
FRIENDS, WHAT DO YOU THINK ?????
LET'S WORK & WIN TOGETHER. MANY THANKS 🙏🙏

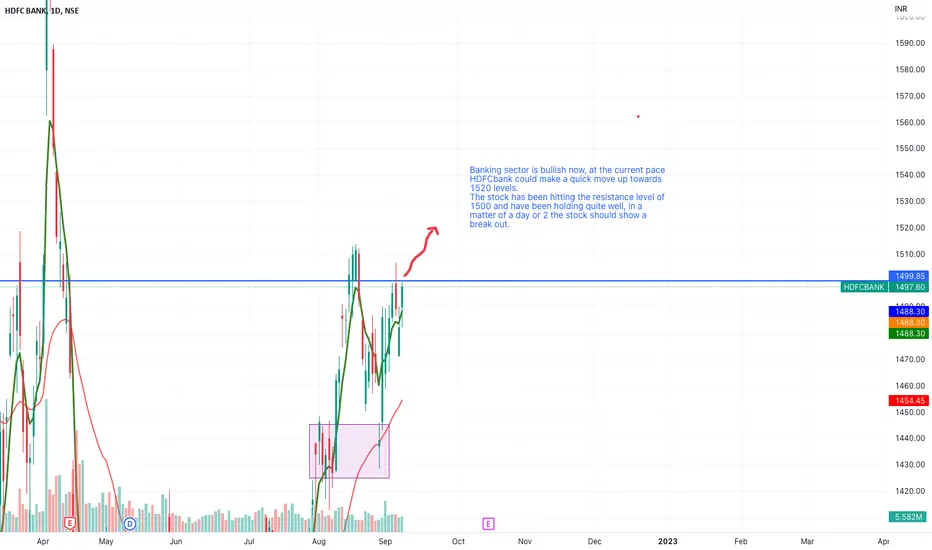
HDFCBANK Trade setup Idea for 09 September, 2022Banking sector is bullish now, at the current pace HDFCbank could make a quick move up towards 1520 levels.
The stock has been hitting the resistance level of 1500 and have been holding quite well, in a matter of a day or 2 the stock should show a break out.
HDFCBANK trade setup Idea for 30 August, 2022HDFC has a good support at 1430 levels. This is also the level for 200 day EMA. The stock is expected to move till 1466 as target with stop loss at 1429.
Risk to reward of 1:2.25

HDFC BANK- Inside day candle learning -POSITIONALPOSITIONAL
Buy above 1405 Target 1450++ Stop loss 1380
Sell below 1383 to 1380 Target 1350 Stop loss 1407
I will Prefer buy trade if activated as risk reward is good
Money management is equally important like technical analysis.
Inside candle learning
Only for educational purpose

HDFC Bank Under pressureHDFC Bank Under pressure
if Break out below 1370 expect more fall
H&S pattern break down

Buy HDFC BANKBuy and hold hdfc bank above 1530.
Target is 1570.
Breaking above 1575 will give H&S pattern breakout will take it up to previous all time high.

Hdfc Bank trading setupHDFC Bank
1570-75 Resistance area
This area is multiple time tasted and today the stock is closed 13 points lower from it's high.
Breaking above 1575 will take it up to 1600.

HDFC trend analysis for November monthHDFC bank and AXIS bank are struggling to move higher from February's high where the SBIN and ICICI made 20-30% higher from February high.
As there is no recent events and could expect the stock move sideways for next two months.
Range - 1370 ~ 1620
Support - 1350-1400
Resistance - 1550-1630

HDFC BANK Analysis 04/03/2021as we can see there is a bearish divergence of Price with MACD and it got its confirmation as the price has fallen and tested the immediate Support Area, and MACD and signal lines has crossed in MACD indicator which is the sign of trend reversal and price correction.
the trend is range bounding in a ascending parallels channel and currently touching the top bond
we may have an other impulsive wave to the 1 TP and alternatively retrace down to the 2 TP.

HDFC Shows Buy OpportunityRISK DISCLOSURE:
Technical analysis of FOREX and INDIAN MARKETS. We are not SEBI REGISTERED ANALYSTS The views expressed here are for our record purposes only. Please consult your personal financial advisor before investing. We are in no way responsible for your profits/losses what so ever.

HDFCBANK Long Term OutlookHDFC Bank is currently trading at support zone and the trend is turning to bearish.
From the 200 Weekly MA HDFCBANK made a pullback, from this level few days or weeks of range bound distribution phase can be seen, RSI is below 30 and price is below the Ichimoku Cloud and it is turning to bearish, Alligator is bearish.
If one or two weekly candle closes below the 200 Weekly MA we will see then the price will go to near 550-650 zone in long term.
