HBAR almost at altCoin golden pocketCRYPTOCAP:HBAR hit my short term downside target $0.1 and is heading to the altCoin golden pocket 0.786 Fibonacci retracement, a high probability wave 2 bottoming area for low cap , volatile assets. Vol-70.
This is also a major High Volume Node, $0.7
Weekly RSI is getting oversold but with no divergence.
I think we are going to see bottoms soon enough. Dumping on a low liquidity Saturday is a suspicious move that could trigger a capitulation event.
Safe trading
Hedera

Hedera showing signs of structure but it could be a BOSHBAR is sitting at a key decision level.
Price remains in a bearish structure with clear lower highs and lower lows. The current zone is a major support shelf that has previously acted as demand.
• Break & close below this level → confirms a bearish BOS and opens the door for continuation lower
• Hold above support → allows for a short-term relief bounce, but remains corrective unless structure is reclaimed
Overhead supply is heavy, and recent volume suggests active selling, not passive drift.
This is a wait-for-confirmation area, not a chase.
Let structure decide.

HBAR, Bears in control, strong rejectionCRYPTOCAP:HBAR
🎯Price caught a strong bid on bullish divergence, but was rejected just as hard. Price is below the daily pivot and 200EMA, which is bearish, showing the downtrend is intact. The next downside target is the S1 pivot at $0.0893.
📈 Hidden bearish divergence played out at a High Volume Node. Bullish divergence is now forming, but unconfirmed.
👉Analysis is invalidated below the swing low, keeping wave 2 alive. We are very close to this level.
Safe trading

Following HBAR: Parallel S/R ChartI've been following HBAR since early 2020 when it dipped below 1 cent briefly and then took off.
This chart is simply to show key areas of support and resistance it has been testing that are on a parallel vs the traditional horizontal S/R.
At this point, if it loses the 12 cent area around the yellow line, I'd expect a test somewhere near 4.5 cents. If that test fails to break through into the green or gets quickly bought up, it may be the last low we see in a while.
On the other hand, if the Bitcoin market drops hard affecting all crypto look to see if we see yet another move into the green box.

HBAR Short-term analysis | Trading and expectationsCRYPTOCAP:HBAR
🎯Price caught a strong bid on bullish divergence, flipping the local structure bullish. However, bearish divergence has emerged at High Volume Node resistance. Price is above the daily pivot, which is bullish, but has a long way to go to reach the daily 200EMA.
📈 Price must get above $0.148 to negate the bearish divergence.
👉Analysis is invalidated below the swing low, keeping wave 2 alive.
Safe trading

HBAR Macro analysis | The bigger picture | Long-term holdersCRYPTOCAP:HBAR
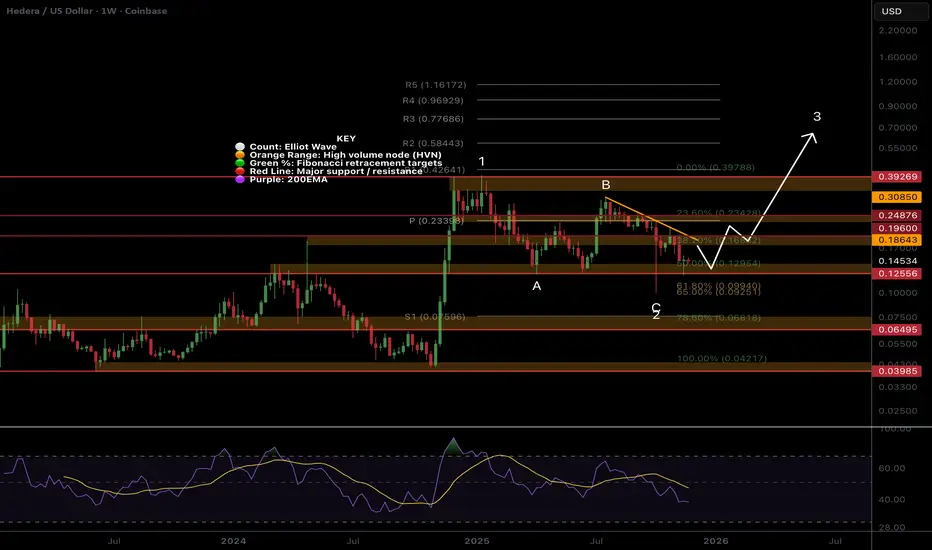
🎯 Price has printed a textbook ABC for wave 2, now the weekly bullish divergence in the RSI. The bottom may be in with last week’s bullish engulfing candle at the Fibonacci golden pocket, the most likely termination for wave 2. Wave 3 has an expected target of the R3 weekly pivot $0.77.
📈 Price is below the weekly pivot, and there is still no 200EMA so there is still a chance for further downside with a target of the alt-coin golden pocket, 0.786 Fibonacci retracement, S1 pivot and High Volume Node support, $0.75.
👉 Bullish analysis is invalidated below $0.95, keeping wave 2 alive.
Safe trading

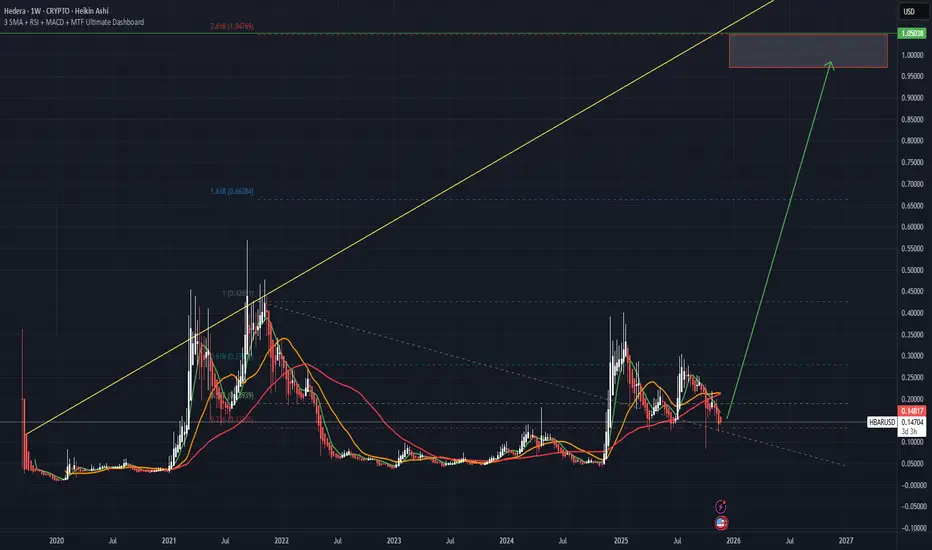
HBARUSD lost its 1W MA200 also. Collapse imminent.Hedera (HBARUSD) is about to close its 1W candle below the 1W MA200 (orange trend-line) for the first time since November 11 2024. This is a huge development as this has been its long-term Support, which even though it broke on 3 separate occasions in 2025, it ever closed a week below it and always recovered with a strong rally.
If this time it fails, then the Bear Cycle will be confirmed 100% (pretty much is) and will move on into its 2nd Phase, in a similar way as the 2021/22 Bear Cycle did. As you can see, both Cycles are almost identical, with virtually indistinguishable 1W RSI Falling Wedge patterns (both starting after a 88.50 Resistance rejection).
They are both parts of a multi-year Triangle pattern, which in 2022 bottomed on its Higher Lows trend-line on the 0.9 Fibonacci retracement level (also just above the 2.0 Fib extension measured from the second High). This time both Fibs are almost on the same level, which gives us a minimum Target for this Bear Cycle at 0.0530.
---
** Please LIKE 👍, FOLLOW ✅, SHARE 🙌 and COMMENT ✍ if you enjoy this idea! Also share your ideas and charts in the comments section below! This is best way to keep it relevant, support us, keep the content here free and allow the idea to reach as many people as possible. **
---
💸💸💸💸💸💸
👇 👇 👇 👇 👇 👇

HBAR Preparing for a Larger MoveHBAR continues to move within a descending channel on the higher time frame, with price now reacting near the lower third of the structure. The current positioning suggests that the next directional move will likely be decided within this zone.
Key points from the chart
Descending Channel Structure
• Price has respected both channel boundaries since early October.
• Each touch of the lower boundary has produced a short term rebound.
• Recent candles show slowing bearish momentum near the same zone.
Local Support Zone
• HBAR is testing a demand area that previously acted as a launch point.
• Reaction from this zone determines whether the market forms a new higher low.
Potential Bullish Scenario
• If HBAR maintains support, price may begin moving toward the middle band of the descending channel.
• A confirmed break above the internal trendline could open the path toward the next resistance levels near 0.152 and 0.204.
Potential Bearish Scenario
• A breakdown from the support region exposes the lower channel boundary.
• Failure to hold this structure may extend the decline toward deeper levels around 0.110 and possibly 0.079.
What to watch
• Strength or weakness around the current support zone.
• Reaction to the internal trendline.
• Volume confirmation on any breakout attempts.
Market stance
Neutral until the channel boundary or the resistance line is decisively broken.

TradeCityPro | HBAR at Critical Support, Bears in Control👋 Welcome to TradeCityPro!
In this analysis, I want to review HBAR, one of the RWA-focused projects, currently ranked 21st on CoinMarketCap with a market cap of $5.71 billion.
🗓 Daily Timeframe
On the daily timeframe, this coin is sitting on a very important support zone.
✔️ There is also a curved descending trendline visible on HBAR, which started forming from the 0.2915 top.
🎲 Every time the price has touched this trendline, bearish momentum has increased.
🎯 Right now, the price is inside this support area, and considering the strong selling pressure in the market, the probability of this zone breaking is high.
💥 The RSI oscillator has also taken a bearish direction after the rejection from 0.2915, spending most of the time below the 50 level, which indicates bearish momentum dominating the market.
💧 If RSI enters the oversold zone, this bearish momentum will intensify even further, increasing the likelihood of a breakdown of support.A break of 0.13055 would be a very strong short trigger.
📊 For long positions, after the descending trendline breaks, we can enter using the 0.15111 trigger.
⚡️ Signs like increasing volume and RSI stabilizing above 50 will act as strong confirmations for a bullish reversal.
📝 Final Thoughts
Stay calm, trade wisely, and let's capture the market's best opportunities!
This analysis reflects our opinions and is not financial advice.
Share your thoughts in the comments, and don’t forget to share this analysis with your friends! ❤️

HBARUSD - HEDERA entering bull seasonHi,
I do like US coins lately because there are institutions involved and a lot of capital.
Hedera already working with giants as BlackRock and Fidelity.
This is not a trading advice.
Thanks
Gex
Is #HBAR Finally Ready to See a Massive Rebound or Not? Yello, Paradisers! Is this breakout from the falling wedge the beginning of a real trend reversal on #HBARUSDT, or not? Let’s break down #Hedera setup:
💎#HBAR is currently trading around $0.145, and after weeks of downtrend within a clearly defined falling wedge, we finally saw a breakout above descending resistance. This is the first bullish signal, but it’s not yet confirmed.
💎For real confirmation, we need to see the 50EMA hold as support in the coming candles. If that happens, the probability of a sustained bullish move increases dramatically.
💎On the upside, the immediate target is the Moderate Resistance at $0.177. A break above that zone, ideally on strong volume, would open the path for a larger move toward the Strong Resistance level at $0.209, and that’s where bulls will likely take significant profits.
💎However, if #HBARUSD fails to hold above the support zone near $0.134, and especially if price dips back into the wedge structure, we’ll likely revisit the Strong Demand Zone at $0.110. Below that, the entire bullish setup gets invalidated, and we’ll expect a retest of the recent lows, with increased downside pressure from short setups forming below.
Strive for consistency, wait for clear confirmations, and remember that discipline always beats chasing quick profits.
MyCryptoParadise
iFeel the success🌴

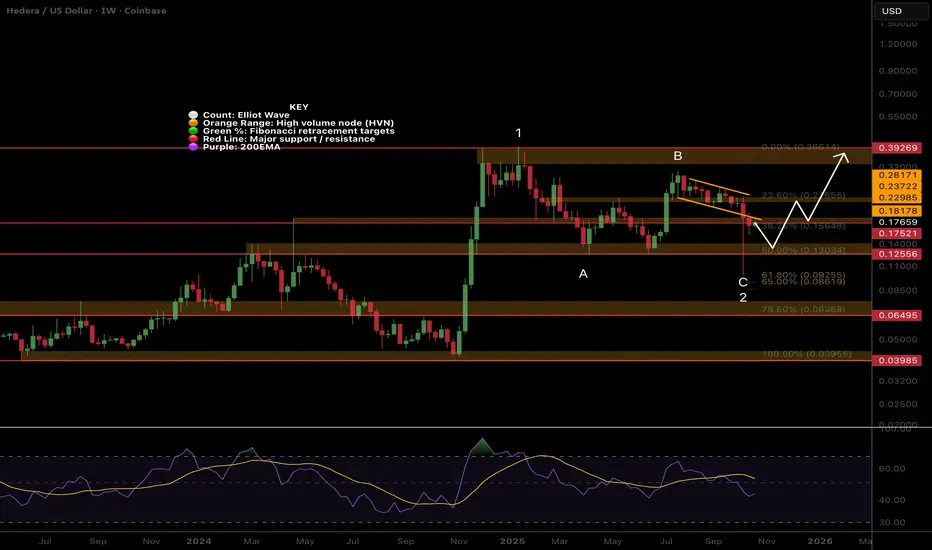
HBAR still holding strongCRYPTOCAP:HBAR Price has printed a textbook ABC for wave 2, but as long as we are below the descending trend-line, the probability is lower still. The wick has now been revisited, which is expected behaviour.
Price is below the weekly pivot. The next downside target is the S1 pivot at $0.075, which is also the alt-coin golden pocket, 0.786 Fibonacci retracement and High Volume Node support.
🎯 Terminal target for the business cycle could see prices as high as $0.8
📈 Weekly RSI is bearish with no divergence
👉 Analysis is invalidated if we close below wave 2, keeping wave 2 alive.
Safe trading
Hedera ( $HBARUSD)Targets Breakout as Adoption AcceleratesHedera trades near $0.143 after bouncing from the recent $0.129 support. The market now focuses on the push toward $0.160, a level that capped multiple rallies. This move happens inside a structure defined by a long-term descending trendline formed after the July 2025 peak at $0.30. Traders want to see whether new adoption triggers enough momentum to break that structure and create a fresh trend.
Global Partnership Program Strengthens Fundamentals
The Hedera Council launched a new global partnership program focused on attracting enterprise, institutional, and regulatory players. The initiative aims to expand Hedera’s real-world footprint and deepen network activity across financial and industrial sectors. More than 10,000 developers already show interest in building on Hedera, and the program includes over $1 million in ecosystem grants for teams working on tokenization, CBDCs, payment systems, and compliance-driven solutions.
This foundation supports Hedera’s long-term growth narrative. Early collaboration with banks and government entities suggests rising confidence in the network. Enterprise partners want stable, regulation-friendly technology, and the Council believes these partnerships position Hedera for a bigger cycle.
Institutional Momentum: ETFs, Futures, and Policy Pilots
Institutional demand continues to rise. Coinbase Derivatives will launch 24/7 HBAR futures on December 5, boosting volume and visibility. Fourteen ETF filings are already in progress, and new IRS rules now allow staking inside ETFs, giving HBAR-focused funds a yield advantage. Canary Capital holds over 421 million HBAR, about 0.84% of total supply, signaling long-term conviction. Hedera’s involvement in Australia’s CBDC pilot and Wyoming’s state-backed stablecoin further strengthens fundamentals.
Technical Outlook: Battle at $0.160
HBAR faces resistance at $0.160, with support at $0.129 and $0.081. A clean break above $0.160 opens the path toward $0.21. Rejection risks a slide back toward $0.129. A breakout above the descending trendline may target $0.30 again.

HBAR still in the channel!Price is back in the descending range after dropping below during the flash crash, which can be viewed as an anomaly.
Wave 2 appears complete at the golden pocket Fibonacci retracement. Price was rejected at the daily 200EMA and channel upper boundary and has lost the daily pivot and High Volume Node, suggesting further downside is to come.
📈 Daily RSI bounced from oversold alongside price with no divergence.
👉 Continued downside has a target of $0.07 at the next High Volume Node support and alt-coin golden pocket 0.786
Safe trading

HBAR Price Tumbles 25% — Indecisive Traders Could Extend Drop
HBAR has fallen 25% over the last week and trades at $0.144, hovering near the $0.145 level. The steep decline has pushed the token into a vulnerable position where bearish sentiment continues to overshadow attempts at stabilization.
Based on current indicators, HBAR could slip below its $0.139 support level. A drop to $0.133 or even $0.120 is possible if selling accelerates and market conditions worsen. Such a move may trigger panic among investors and deepen the correction.
If HBAR manages to hold the $0.145 support and bounce, the price could attempt a recovery toward $0.154. A breakout above that level may open the path to $0.162 or even $0.175. This scenario would invalidate the bearish outlook and signal renewed buyer interest.

HBAR back in the channel!CRYPTOCAP:HBAR Price is back in the descending range after dropping below during the flash crash, which can be viewed as an anomaly.
Wave 2 appears complete at the golden pocket Fibonacci retracement. Price was rejected at the daily 200EMA and channel upper boundary and has lost the daily pivot and High Volume Node, suggesting further downside is to come.
📈 Daily RSI reached oversold and has printed hidden bullish divergence, which is bullish
👉 Continued downside has a target of the $0.13 High Volume Node
Safe trading

HBAR Heavy resistance aheadCRYPTOCAP:HBAR is about to hit resistance - daily 200EMA and S1 pivot, but has re-entered the channel after a deep swing below with daily RSI hitting oversold.
I am expecting price to climb the wall of worry generated by all the fear from the Friday flash crash + macro-economic environment and 'cycle top' narrative that is all driving market FEAR
WaveC of 2 completed at the golden pocket Fibonacci retracement.
Safe trading

HBAR Price Could Miss 17% Jump as Death Cross EmergesHBAR trades at $0.170 at the time of writing, fluctuating within a narrow range between $0.178 and $0.162. The altcoin’s sideways trend highlights the ongoing indecision among investors as they await clearer technical signals.
Given the prevailing bearish indicators, HBAR could either continue consolidating or slip below $0.162. A drop to $0.154 or lower would extend losses and confirm downside pressure.
Conversely, if investors regain confidence and inflows return, HBAR could break past $0.178. A sustained rally from that level could push the token toward $0.200. This would marking a potential 17.6% rise and fully invalidating the current bearish outlook.

HBAR Wave 2 complete, but more downside firstCRYPTOCAP:HBAR wave 2 looks complete at the golden pocket and High Volume Node support after printing an ABC down. A deeper visit into the wick left behind is likely before we continue up in wave 3. Testing the 0.5 Fib and High Volume Node is where I am looking for a long.
Weekly RSI has bullish divergence, a good sign, but plenty of room to fall until oversold. Price is currently at major resistance of the channel lower boundary and High Volume Node.
A strong upside move has a target of the all time High Volume Node. Targets of $1+ are still on the cards.
Safe trading
HBAR Price Faces Death Cross After 3 Months; May Fail BreakoutHBAR is trading at $0.159 at press time, moving within a descending broadening wedge pattern. While this formation is typically considered bullish, prevailing technical and sentiment indicators suggest potential failure.
If bearish pressure intensifies, HBAR could fall through the downtrend line. This could result in the altcoin slipping below $0.154 and targeting $0.145 in the coming days.
Conversely, if the three-month pattern remains intact, a reversal may propel HBAR above $0.180 and $0.188, eyeing a move to $0.198. This breakout would invalidate the bearish thesis and restore confidence among investors.

HBAR Correction may be complete!CRYPTOCAP:HBAR huge sell off during the black swan event tapped the .618 Fibonacci golden pocket, tyhe target i was sharing for a while on my macro charts! This should mark the bottom of a wave 2 pull back with no opportunity for anyone to enter at those prices.
Price sits above High Volume Node support and 0.382 Fibonacci retracement. A break above the descending trend line would mark a bullish market structure and take the fearful by surprise!
RSI hit oversold but with no bullish divergence. Losing support bring up the 0.5 Fib and High Volume Node at $0.135 as the next target.
Safe trading

HBAR Futures Struggle as $200 Million Recovery Looks BleakHBAR has gained 9% since the crash, currently trading at $0.180 while attempting to secure $0.188 as a support floor. Holding this level is essential for maintaining recovery momentum and preventing another pullback.
The altcoin dropped by 25% during the crash, and a full rebound would require reclaiming $0.219. This move depends on collaboration between spot buyers and Futures traders. Without Futures market support, HBAR risks slipping back to $0.180 or lower.
However, if HBAR price receives renewed backing from investors, the altcoin could breach the $0.198 resistance. This would push the crypto token toward $0.205, signaling a return of bullish strength.

Is #HBAR About to Break Down Hard? Don’t Get Trapped by BearsYello Paradisers! Are you prepared for what might be the next major shakeout on #HBARUSDT? Let’s break down the current setup of #Hedera:
💎#HBAR has been moving within a descending channel since mid-July, consistently being rejected by the descending resistance trendline. Each bounce has been weaker than the last, and we're now approaching the lower edge of this structure with selling pressure intensifying.
💎As of now, HBAR is trading around $0.224, and the next few daily candles will be critical. If you're not managing your risk carefully here, the upcoming volatility could eat your capital alive. The 50 EMA is currently acting as a dynamic resistance, pushing the #HBARUSD lower each time it attempts a bounce. As long as the price remains below this level, the bearish pressure will likely continue.
💎A clean breakdown below the descending support of this channel would be a high-probability bearish confirmation. If we get a breakdown + retest rejection, #HBAR could accelerate toward the Moderate Support zone at $0.166. Then eventually, reach the Strong Demand Zone near $0.127, where we expect more serious buy interest to step in.
💎The bearish setup is invalidated on a confirmed breakout above the resistance zone at $0.255–$0.278. Only if price reclaims and holds above this range will we consider shifting back to a bullish bias. Until then, every bounce is likely to be sold into.
Trade smart, Paradisers. This setup will reward only the disciplined.
MyCryptoParadise
iFeel the success🌴
