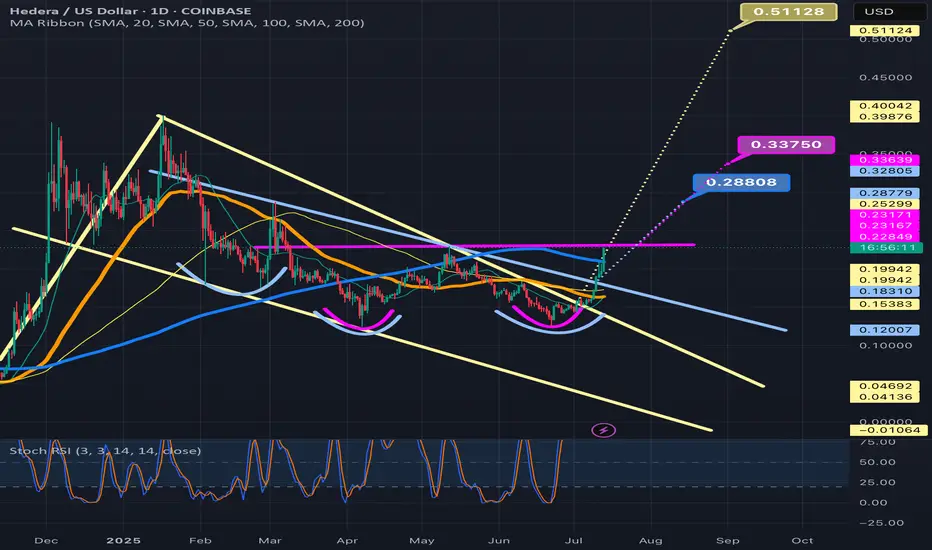
Following HBAR: Parallel S/R ChartI've been following HBAR since early 2020 when it dipped below 1 cent briefly and then took off.
This chart is simply to show key areas of support and resistance it has been testing that are on a parallel vs the traditional horizontal S/R.
At this point, if it loses the 12 cent area around the yellow line, I'd expect a test somewhere near 4.5 cents. If that test fails to break through into the green or gets quickly bought up, it may be the last low we see in a while.
On the other hand, if the Bitcoin market drops hard affecting all crypto look to see if we see yet another move into the green box.
Hederahashgraph

HBAR simple chart for 2026Check out this long-term BINANCE:HBARUSDT chart. Idea is pretty simple! I track this chart since 2021 and if we cut all noise we can find the best zone for spot accumulation (marked box zone)
Key supports at 0.10 current level or even better retest 0.08 again!
Levels for fixation step by step Yearly open 2025.
Fibonacci extensions levels and 1.618 by mid-2026 around 0.65 cents would be enough for this cycle! But i understand majority waiting over 1$ price! But most likely it will not happen! What's your HBAR target? DYOR!

HBAR Price Tumbles 25% — Indecisive Traders Could Extend Drop
HBAR has fallen 25% over the last week and trades at $0.144, hovering near the $0.145 level. The steep decline has pushed the token into a vulnerable position where bearish sentiment continues to overshadow attempts at stabilization.
Based on current indicators, HBAR could slip below its $0.139 support level. A drop to $0.133 or even $0.120 is possible if selling accelerates and market conditions worsen. Such a move may trigger panic among investors and deepen the correction.
If HBAR manages to hold the $0.145 support and bounce, the price could attempt a recovery toward $0.154. A breakout above that level may open the path to $0.162 or even $0.175. This scenario would invalidate the bearish outlook and signal renewed buyer interest.

HBAR Price Could Miss 17% Jump as Death Cross EmergesHBAR trades at $0.170 at the time of writing, fluctuating within a narrow range between $0.178 and $0.162. The altcoin’s sideways trend highlights the ongoing indecision among investors as they await clearer technical signals.
Given the prevailing bearish indicators, HBAR could either continue consolidating or slip below $0.162. A drop to $0.154 or lower would extend losses and confirm downside pressure.
Conversely, if investors regain confidence and inflows return, HBAR could break past $0.178. A sustained rally from that level could push the token toward $0.200. This would marking a potential 17.6% rise and fully invalidating the current bearish outlook.

HBAR LONG Targeting Weeks High Send ITTT - Formed a nice buy entry on the OTE looking for upside removal before going lower - managing risk responsibly

HBAR Price Faces Death Cross After 3 Months; May Fail BreakoutHBAR is trading at $0.159 at press time, moving within a descending broadening wedge pattern. While this formation is typically considered bullish, prevailing technical and sentiment indicators suggest potential failure.
If bearish pressure intensifies, HBAR could fall through the downtrend line. This could result in the altcoin slipping below $0.154 and targeting $0.145 in the coming days.
Conversely, if the three-month pattern remains intact, a reversal may propel HBAR above $0.180 and $0.188, eyeing a move to $0.198. This breakout would invalidate the bearish thesis and restore confidence among investors.

HBAR Futures Struggle as $200 Million Recovery Looks BleakHBAR has gained 9% since the crash, currently trading at $0.180 while attempting to secure $0.188 as a support floor. Holding this level is essential for maintaining recovery momentum and preventing another pullback.
The altcoin dropped by 25% during the crash, and a full rebound would require reclaiming $0.219. This move depends on collaboration between spot buyers and Futures traders. Without Futures market support, HBAR risks slipping back to $0.180 or lower.
However, if HBAR price receives renewed backing from investors, the altcoin could breach the $0.198 resistance. This would push the crypto token toward $0.205, signaling a return of bullish strength.

HBAR Price Breakout From 3-Month Pattern Threatened By HoldersHBAR is trading at $0.224, sitting just below the crucial $0.230 resistance level — the breakout point from its descending wedge pattern that has persisted for three months. A decisive move above this level could trigger renewed bullish momentum.
Historically, HBAR has struggled to break free from this setup, and a failed attempt could push prices lower. If rejection occurs, the token might slip toward $0.219 or $0.213, with further downside potential to $0.205.
Conversely, if broader market strength outweighs investor skepticism, HBAR could breach $0.230 and confirm a breakout. This move could propel the price toward $0.242, invalidating the bearish outlook and marking the start of a new bullish phase.

HBAR 2-Month Golden Cross Nears Its End, Price Awaits DeclineHBAR’s price currently trades at $0.215 within a descending wedge pattern. It sits just above support at $0.213 while struggling to break $0.219 resistance. Although wedges often resolve positively, a decisive breakout remains distant, with the key barrier standing near $0.230.
Given current sentiment and technical indicators, HBAR is likely to stay range-bound below $0.230. Even if the price surpasses $0.219, broader resistance and limited momentum could keep the altcoin consolidated.
Should bearish signals strengthen, HBAR risks slipping through support at $0.205. Breaking this level would invalidate the bullish setup entirely, opening the path to $0.198. Such a move could reinforce investor caution and intensify short-term volatility for Hedera.

HBAR 4H Analysis – Key Triggers Ahead💀 Hey , how's it going ? Come over here — Satoshi got something for you !
⏰ We’re analyzing HBAR on the 4-hour timeframe timeframe .
👀 On the 4H timeframe for HBAR , we can observe that this coin is ranging inside a box with very strong support and resistance levels. The last time, it reacted to the midline of this box (50% zone) and has built a trading structure for a potential breakout.
⚙️ The key RSI levels are at 57 and 35. Once the oscillation surpasses these levels, the price of this coin can shift and bring momentum into the market. Keep in mind that these zones often indicate increased volatility in the direction of price movement.
🕯 The volume of this coin has been decreasing over the past few days, and the number of trades has significantly dropped. Many buy and sell orders have been filled, and the coin is currently ranging in this box, deciding its next direction. Notice that with declining volume, we can often identify a new trend forming, since the current trend may be coming to an end.
📊 On the OTHERS.D index 4H timeframe , we can see that it is also moving inside a box, with the top of the box at the 7.9% zone . Breaking this level along with the RSI surpassing 63 could bring strong volume into the market. At the same time,
📊 a breakout on the TOTAL3 index would also inject solid volume into the market. This index is likewise inside a box, and the last time it reacted to its midline, it rebounded upward and is now moving toward the 1.08 resistance.
💰 Looking at the HBAR/BTC pair , we can observe that it has formed a box-like structure, similar to its USDT pair. With a breakout above the midline, more Bitcoin could be liquidated and converted into this coin. HBAR is considered one of the whales’ favorite coins.
🔔 The alert zones for HBAR carry some risk, and the possibility of failure should also be considered. The long alert zone is around 0.25846, which is the midline of this 4H box. The short alert zone is around 0.22784. Breaking this zone could provide a short position, coinciding with a deeper correction for this coin.
❤️ Disclaimer : This analysis is purely based on my personal opinion and I only trade if the stated triggers are activated .

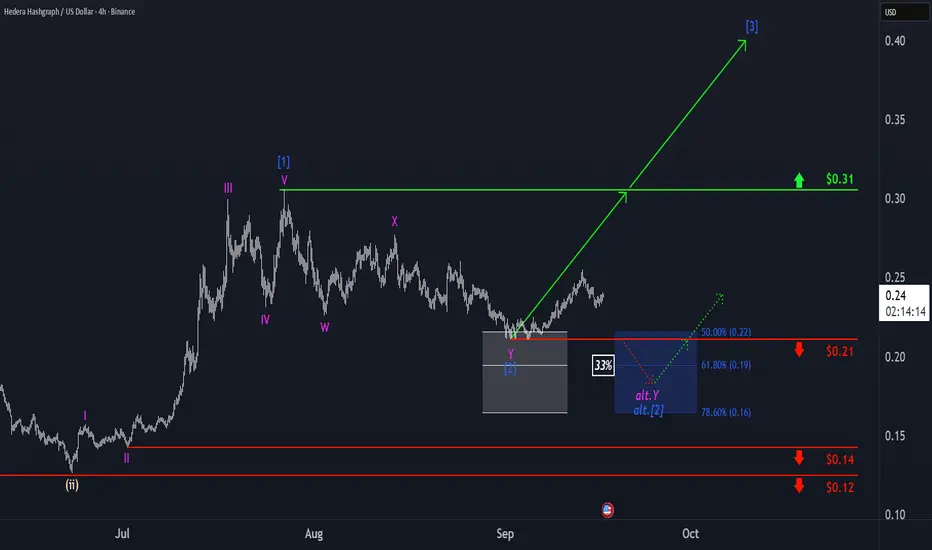
Hedera Hashgraph: Target Hit—Next Rally in SightA reversal began to emerge in the upper third of our grayed out Target Zone, prompting us to mark blue wave as complete. In the now-unfolding, same-colored wave , we anticipate gains well above resistance at $0.31. At the same time, we assign a 33% probability to a deeper low of wave alt. . In this case, however, we’d expect the reversal to happen no later than the blue (alternative) Target Zone ($0.22–$0.16), which would once again present an opportunity to initiate new long positions.
Can 2-Month High Inflows End HBAR Price’s Downtrend?
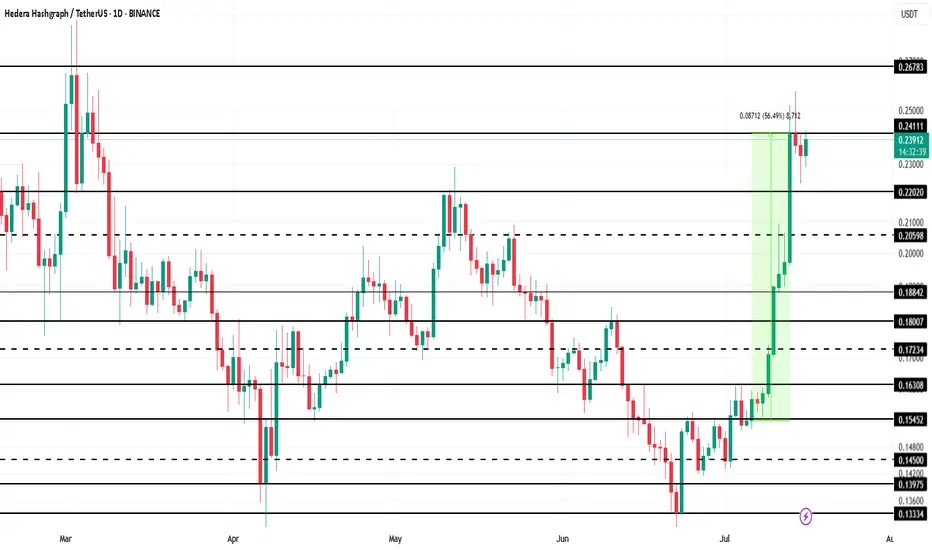
At the time of writing, Hedera is priced at $0.237, facing resistance at $0.241. The cryptocurrency has been weighed down by a two-month-old downtrend that began after it failed to break above $0.248 earlier this summer.
Given current market inflows and bullish technical indicators, HBAR is likely to bounce back from the $0.230 support. If successful, the price could retest $0.241 and possibly $0.248. Surpassing this level would officially end the ongoing downtrend.
However, if bearish sentiment intensifies, Hedera could lose its footing. A breakdown below $0.230 would expose the cryptocurrency to a fall toward $0.219. Such a move would invalidate the bullish outlook and risk extending the downtrend further.

HBAR Price Ready for $0.23 Breakout? Hedera 4H Chart Targets ExpHedera HBAR is approaching a key decision point on the 4-hour chart. In this update, I outline the critical support and resistance levels that will determine whether bulls can push toward $0.23 and beyond. My bias mid-term remains for upside, but price must reclaim levels step by step before momentum can fully shift.
We also look at how Bitcoin’s resistance battle at $112,190 connects to HBAR’s outlook. If BTC sustains recovery, HBAR has room to extend toward $0.24–$0.25. If not, downside levels at $0.20 and $0.19 become the key defense lines. Watch this analysis to see what to expect next.

What To Expect From HBAR Price In September 2025?At the time of writing, BINANCE:HBARUSDT trades at $0.218, down 9% over the past month. The persistent outflows suggest continued weakness, leaving the altcoin vulnerable to further decline. Should selling continue, HBAR could slip to $0.205, extending its drawdown and reinforcing bearish momentum in the short term.
Historically, September has been a poor month for BINANCE:HBARUSDT . On average, the token has declined 10% during this period, with a median drop of 5%. Based on this pattern, the probability of another drawdown remains elevated, aligning with current technical signals that highlight weakening support levels.
If inflow returns and investor sentiment improves, BINANCE:HBARUSDT could bounce back to reclaim the $0.230 support. Holding this level would be crucial for triggering recovery. A complete reversal would require the token to climb toward $0.271 or higher, signaling renewed strength after months of bearish market activity.

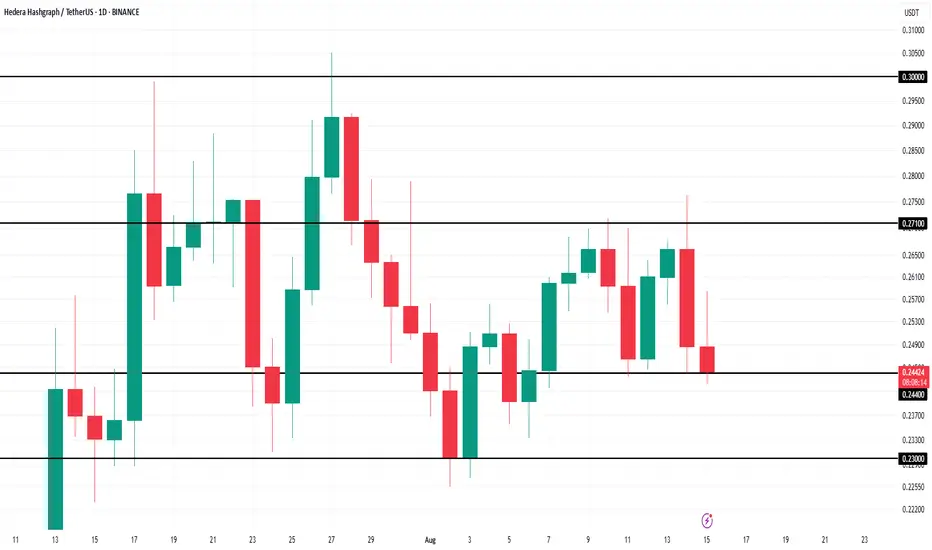
HBAR Eyes Bitcoin for Price Recovery Amid Market UncertaintyBINANCE:HBARUSDT is currently consolidating, trading at $0.255 while oscillating between $0.271 and $0.244 . The narrow range reflects investor caution, with traders awaiting external market cues. Without a decisive breakout, the altcoin may continue drifting sideways in the immediate term.
If Bitcoin strengthens and resumes its rally, BINANCE:HBARUSDT could break resistance at $0.271. Such a move may open the door for gains toward $0.291, with potential upside extending further if bullish conditions persist.
Alternatively, a Bitcoin downturn could drag BINANCE:HBARUSDT lower, pushing it beneath $0.244 support. In such a scenario, the altcoin risks falling to $0.230, undermining the bullish thesis and reinforcing caution among investors.

HBAR’s ABC Setup — Short-Term Pain, Long-Term Gain?HBAR has been consolidating sideways for the past 30 days, with $0.27 acting as a clear resistance — aligning with the golden pocket (GP). Price failed to sustain above the yearly open (yOpen) at $0.26901, despite multiple attempts. Each breakout attempt lacked follow-through → weakness.
Structurally, HBAR appears to be in a corrective phase after completing five Elliott waves, and is now potentially forming an ABC corrective pattern. Price has also lost the monthly open (mOpen) at $0.25099, which should now act as resistance.
🔴 Short Opportunity
Previous ideal entry: $0.27463 (Golden Pocket) — offered an R:R of ~1:7
Next short zone: Between mOpen ($0.25099) and yOpen ($0.26901)
Target: Around $0.21/$0.2 as take-profit (TP)
🟢 Long Opportunity Zone
➡️ Primary zone: $0.21 – $0.19675
🧩 Confluence factors:
FVG (Fair Value Gap) / imbalance fill
SSL (Support/Stop-Loss liquidity) positioned in the zone
Weekly level: $0.20685
0.55 Fib retracement: $0.20657 (aligned with the weekly level)
0.75 Fib speed resistance fan: Supports this zone if price reaches it between 19 – 25 Aug
1.0 trend-based Fib extension: $0.19675 (projected Wave C target of ABC)
Pitchfork lower support line intersecting with the zone
nPOC & key level: $0.2
With all these aligning, this is the most favourable long setup.
Long Trade Setup Example
Entry: $0.21– $0.19675
Stop Loss: Below $0.19
TP1: ~$0.223
Final target: $0.3+ (swing trade potential)
R:R: 1:6+
🔍 Indicators used:
DriftLine — Pivot Open Zones → For identifying key yearly/monthly/weekly/daily opens that act as major S/R reference points
➡️ Available for free. You can find them on my profile under “Scripts” and apply them directly to your charts for extra confluence when planning your trades.
_________________________________
💬 If you found this helpful, drop a like and comment!

HBAR Price Stalls as Outflows Hit 2-Month High—What’s Next?BINANCE:HBARUSDT price is currently at $0.243 , trapped within the range of $0.244 to $0.271. The mixed market cues, including the bearish CMF and the relatively neutral RSI, suggest that HBAR could continue consolidating.
This sideways movement is expected to persist unless there is a major shift in investor sentiment or a market catalyst that could push the altcoin in either direction.
If outflows intensify and BINANCE:HBARUSDT falls below its $0.244 support level , the bearish case could become more likely. In such a scenario, the price may drop further to $0.230, invalidating the current bullish-neutral outlook and signaling a deeper correction for HBAR.
HBAR Game Plan: Short the Bounce, Long the Liquidity GrabHBAR has been moving strongly and is currently offering both short and long trade opportunities based on a clean potential ABC corrective pattern, key fib levels, volume profile, and anchored VWAP. Let’s break down the setup.
🧩 Technical Breakdown
Higher Timeframe Confluence:
0.618 fib retracement from the macro move
1.618 trend-based fib extension
1.272 VWAP band resistance
Point of Control (POC) from the visible range profile
This is marked as a major take profit/short opportunity zone.
For extra confluence, the negative fib extension golden pocket (-0.618 to -0.666) also aligns right at this resistance zone
Current Structure:
We’re potentially completing wave B of an ABC corrective move
Price has retraced into a high-probability short zone
🔴 Short Setup
Entry Zone:
Between the 0.702 and 0.786 fib retracement levels
Why Here?
0.702–0.786 fib retracement → short zone for reversals
Potential wave B top → setting up for a C leg down
Target (TP):
Around $0.25–$0.24, near the expected wave C completion
🟢 Long Setup
Entry Zone:
~$0.25–$0.24 area.
Why Here?
This zone is a strong confluence area:
➡️ 0.786 fib retracement
➡️ 1.0 trend-based fib extension of ABC
➡️ Anchored VWAP from the entire trend, offering dynamic support
➡️ Liquidity pool
➡️ Previous weekly Open
Plan:
Wait for price to complete wave C into this zone, then look for bullish reaction signs to enter long.
💡 Educational Insight
Why the 0.702–0.786 short zone?
These fib levels are often overlooked but are key “hidden” zones where wave B tops out before C waves.
Why anchored VWAP?
Anchored VWAP gives you dynamic institutional support/resistance, especially when aligned with fibs and liquidity.
Why wait for confirmation?
Blindly longing or shorting levels can trap you. Wait for SFPs, wick rejections, or lower timeframe structure flips to boost trade probability.
Final Thoughts
HBAR is in a highly interesting zone, offering both:
A short setup into the C wave,
And a long setup at the C wave completion, backed by multiple confluence factors.
Let the levels come to you and wait for confirmation!
_________________________________
💬 If you found this helpful, drop a like and comment!
Want breakdowns of other charts? Leave your requests below.

Hedera Update · Keep Holding · No Selling, YetHedera (HBAR) looks awesome. The action and chart right now is one of the best in the market. I love the fact that the candles are moving straight up. This can be equated to how FUN Token (FUN) has been performing in the past month. What one does, the rest follows.
The most interesting signal comes from MA200. Trading is happening above this level and that's all we need to know. When HBARUSDT broke above it, any bullish potential and bullish signals become fully confirmed. It is not a question of "if" anymore but instead a done deal. Growth is expected to happen for a period ranging between 3-6 months once this signal shows up.
This means you can see a strong retrace in a month and still, you remain calm and hold because you know higher prices are still possible. This means that if you see a correction after three months, you can take profits of course but still know that the top is not in. It will take a while before the entire bullish process is complete.
The top is not only calculated based on time duration but also on price levels and marketwide action. Depending on how the rest of the market is doing; looking at Bitcoin and at what price the pair in question is trading can help us confirm if the top is in. For now you just keep on holding.
Each chart/project/pair needs to be considered individually. If your technical analysis ability is lacking, you can always contact me and I will publish an update for you. If you publish news articles, videos, trade-signals or even TA, you can come to me for confirmation, ideas or just inspiration and I will take care of the rest. Once you have your update you can decide what actions to take. It is still early in this game.
The initial portion of the bull market is long gone. Here it started in November 2024, you can see it as the "market bottom." We are on the second portion now in 2025. The year started with a correction and the correction ended in April-June with a very strong higher low. Projects like this one reveal super-strength compared to the rest of the market, it happens with the top 100.
If you consider some of the smaller projects I've been sharing, you see double-bottoms compared to 2024, 2023 and even 2022 and even new all-time lows. Here the low in 2025 is far away from November 2024 and this is good news. That is why I say that each chart/pair needs to be considered individually because conditions are not the same for each project. The market has now thousands of good projects and tens of thousands of trading pairs. It is impossible to say how one will move based on the other because they are just too many and too far away.
The bigger picture and the general bias, yes, bullish all across. Exact resistance and support levels, where to sell, where to buy; should I continue to hold? This is what needs to be considered individually.
Your support is appreciated.
If you enjoyed, please follow.
Namaste.

Hbar breaking upwar from fallingwedge/pennantAlso in a smaller double bottom setup here. *not financial advice*

HBAR Price Drop To $0.20 Likely; $53 Million Liquidation AheadBINANCE:HBARUSDT price currently sits at $0.235, encountering resistance at $0.241. Despite its recent rally, the broader market conditions are pulling it down, and the next major support level is at $0.220 . If the altcoin fails to hold above this level, it could slide towards $0.200.
Looking at the liquidation map, there is a real possibility of significant losses for $BINANCE:HBARUSDTtraders. The map shows that if the price drops to $0.20 or lower, approximately $53 million worth of long positions would be liquidated . This would create a wave of selling pressure and potentially drive the price down further.
In the event of a surge in bearish sentiment or increased selling pressure, BINANCE:HBARUSDT could fall below $0.220 , hitting the psychological support level at $0.200. A drop below this critical level would likely trigger the $53 million worth of liquidations, further exacerbating the decline.
However, if BINANCE:HBARUSDT manages to hold above $0.220 and successfully breaches the $0.241 resistance, there could be an opportunity for a rally. A successful bounce off $0.220 could push HBAR towards $0.267 , providing some relief to traders and reinforcing its bullish outlook.
I have been waiting to get my signal on HBAR and finally got it!Trading Fam,
I know my crypto portfolio is getting destroyed as I prepare for a future altcoin run towards the latter half of this year. And it sucks. Bitcoin hodl'ers definitely look like the true champions at this point outpacing us altcoin traders by a huge margin. However, I've been through this before. Multiple times. And I know that when they run, altcoins will more than make up for our losses and pay massive dividends. We simply have to remain patient and stick to our strategy which is to continue to look for those great entries into some of our larger cap altcoins. So, that is what I'll do until one of two things occurs: A) either my portfolio dies completely or B) I am able to prove that altcoin traders can eventually beat the Bitcoin hodl'ers. It will be option "B". That's my final answer.
You get to watch all this unfold. And fortunately for you, I am the guinea pig. If you want to join me in these trades, you have that option. If you want to sit by and watch this entertainment, which admittedly hasn't been pretty as of late, you can do that too. But, in my heart of hearts, I believe our strategy will eventually pay off.
With that said, I've long been waiting for my indicator to give me the signal on this outstanding altcoin, HBAR. I mean, it's been months. The last time it flashed green for me we went from 12 cents to 24 cents. Unfortunately, my cash reserves were locked up in other trades. Today is different.
I've entered this trade at around 15 cents. My first target will be 17 cents. My final target will be 23 cents giving us more than 50% profit if achieved.
On the technical side, you can see that we have entered a beautiful area of large liquidity. This is where buyers typically step in. My bet is that they will do so again to break us to the upside of that descending trendline taking us at least to our VRVP point of control on this chart (yellow line).
I know that it is not easy trading alts in this volatile political/geopolitical global environment we have somehow sadly inherited. But I have to remain optimistic that the collective good in man will eventually prevail over the corrupt and mostly misanthropic characters we call "leaders". Once these tides begin to shift and show, massive energy will propel us onward and upward into the future. I believe cryptocurrency will help in this shift. What we will then witness will be like nothing we've seen before. This remains my hope as I continue to tread these perilous trading waters.
✌️ Stew

A linear Chart version of the current HBAR bull patternsIt just dawned on me that I had my chart on logarithmic for the previous 2 posts I amde about HBARUSD. As usual, the chart patterns on the log chart tend to have much higher breakout targets than the version of the chart patterns that appear on the linear chart. As soon as I realized this I went back in and adjusted the patterns to their linear chart erosions. The inverse head and shoulders remained mostly the same but the bullflag/desceding channel has now morphed into a falling wedge/bullish pennant. As you can see the breakout target for all 3 patterns is a much lower price than what the price targets were on the logarithmic chart. That’s not to say that the logarithmic targets are invalid, I think what will most likely occur Ike usually is both chart’s targets will be validated, it will likely just take much longer for the logarithmic chart’s targets to be reached as is how things usually pan out. *not financial advice*