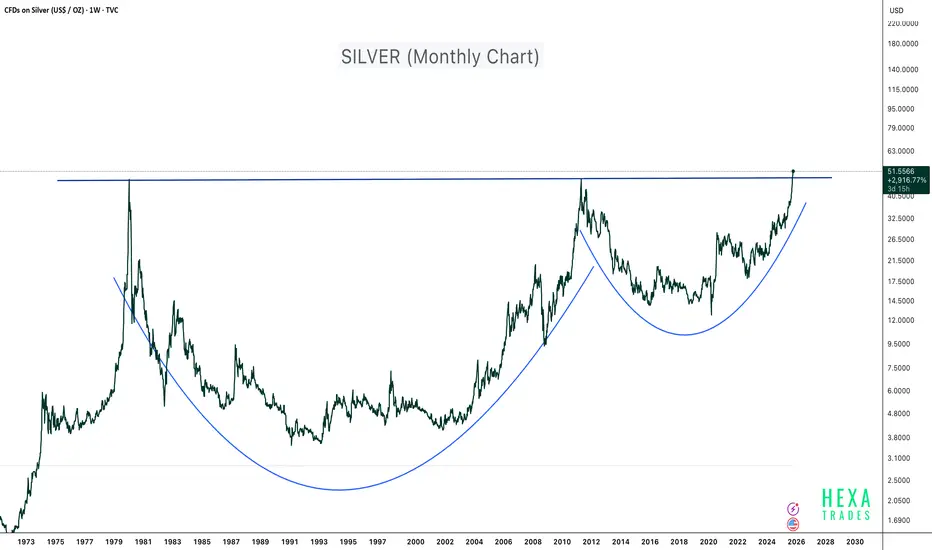
Silver - 45 Years of Breakout!Silver has just completed one of the largest and longest cup and handle patterns in financial history, spanning more than four decades. The metal has officially broken above the 1980 and 2011 highs, signaling a potential supercycle breakout on the monthly timeframe.
This type of long-term technical structure typically marks the beginning of a massive secular bull run, often driven by macroeconomic shifts such as inflation cycles, fiat currency debasement, and rising demand for hard assets.
Technical Highlights:
- Pattern: 45-year Cup and Handle formation
- Breakout Zone: Above $50 confirmed (Weekly chart)
- Structure: Deep base formation showing multiple accumulation phases (1981–2001 and 2012–2023)
Macro Perspective:
Silver is benefiting from:
- Increased industrial demand (especially in solar, EV, and electronics sectors)
- Inflationary monetary policies and growing global money supply
- Renewed investor interest in tangible and real assets
This breakout could mark the start of a multi-year bull run for silver. Long-term investors may view this as an opportunity to accumulate and hold for 10–15 years, aligning with the magnitude and duration of the pattern.
If the price experiences short-term pullbacks in the coming months, use DCA (Dollar-Cost Averaging) to build long-term exposure.
Conclusion:
After 45 years of consolidation, silver is finally breaking free. The chart points toward a historic structural breakout, potentially setting the stage for the next precious metals supercycle.
Cheers
Hexa
Disclaimer:
This analysis is for educational purposes only and does not constitute financial advice. Always conduct your own research and manage risk responsibly.
Hexatrades
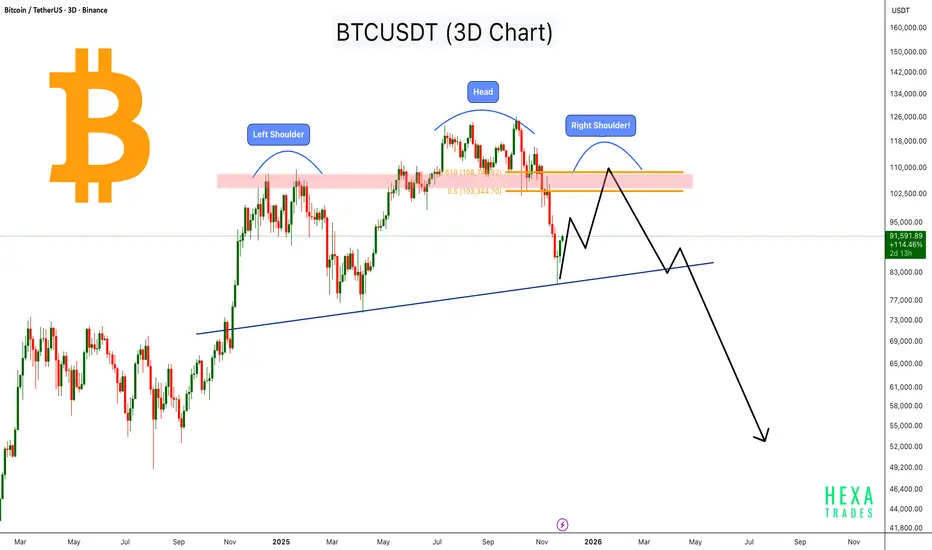
BTC Forming a Massive Head & Shoulders - Macro Reversal Ahead?Bitcoin is forming a large Head & Shoulders pattern on the 3-day chart, with the left shoulder and head already completed, and the right shoulder now developing within the major resistance zone around the 0.5–0.618 retracement (103,000–108,000).
Price recently bounced from the long-term ascending trendline, but the overall structure still suggests a potential macro reversal unless Bitcoin breaks above the resistance zone with strong momentum.
If the right shoulder completes and price rejects from the supply zone, BTC could retest the trendline again. A breakdown of this trendline may open the door for a deeper correction toward the lower demand zones.
This is a medium-term pattern and may take 1–3 months to validate fully.
Key Points:
- Left Shoulder, Head, and Right Shoulder zone highlighted
- Major resistance at $103,000–$108,000
- Price bouncing from long-term ascending trendline
- Breakdown below the trendline may trigger a strong downside move
- Right shoulder formation may take a few more weeks
Cheers
Hexa
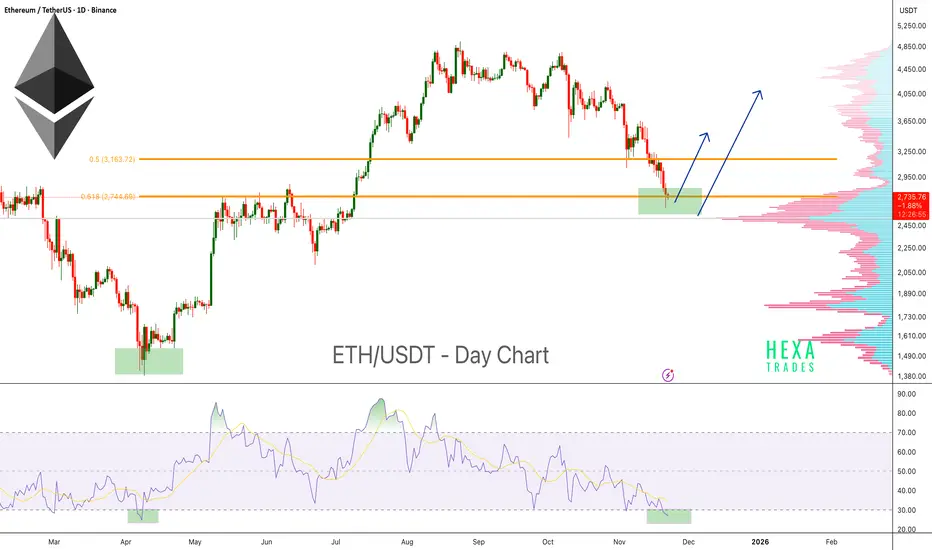
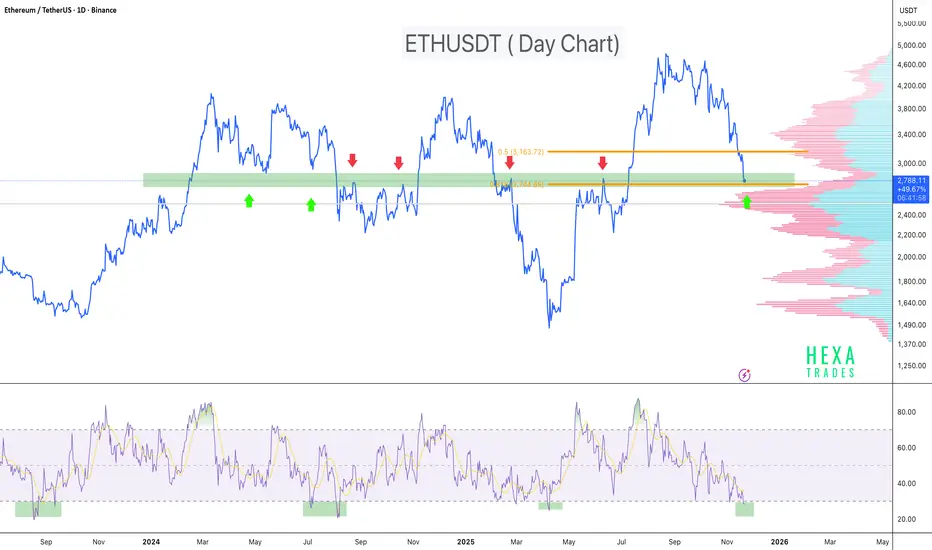
Ethereum Approaching Reversal Zone!Ethereum is currently trading at a major support zone, an area where price has historically shown strong reactions and multiple bounces. This demand zone has acted as a key reversal region several times, and ETH is once again testing it.
Price is also sitting near the 0.618 Fibonacci retracement (Golden Zone), which is commonly used to identify potential reversal points during market corrections.
The Volume Profile shows a high-volume node exactly at the current support area, indicating strong interest and previous accumulation. This increases the probability that this zone will act as a strong support.
On the momentum side, the RSI has entered oversold territory once again. Historically, whenever ETH’s daily RSI dipped below 30, it marked strong bottom areas followed by significant bounces.
Key Highlights
- ETH retesting a major historical support zone.
- Trading inside the 0.618 Fibonacci Golden Zone.
- Daily RSI oversold (<30) — historically a strong bounce region.
- Volume Profile high-volume node aligns with support, increasing the strength of the zone.
- Potential for a short-term reversal if the support continues to hold.
Cheers
Hexa
BTC Monthly MACD Turns Bearish - Major Correction Ahead?Bitcoin has printed a bearish MACD crossover on the monthly timeframe, a signal that has historically aligned with the start of major market corrections. This pattern appeared during the 2018 top, again near the 2022 macro peak, and the chart now shows a similar bearish crossover forming once more.
Each previous monthly MACD bearish crossover occurred after a prolonged rally and was followed by a multi-month downtrend. The current crossover resembles those same market conditions, suggesting that BTC may be entering a deeper corrective phase if history repeats.
Key Highlights
- Monthly MACD bearish crossover, historically signals macro trend reversals.
-Similar crossovers occurred before the 2018 and 2022 bear markets.
-Strong rejection candle near major resistance aligns with previous cycle tops.
- Momentum weakening after an extended rally suggests potential for further downside.
- Monthly timeframe signals carry high weight and can drive long-term market direction.
Cheers
Hexa

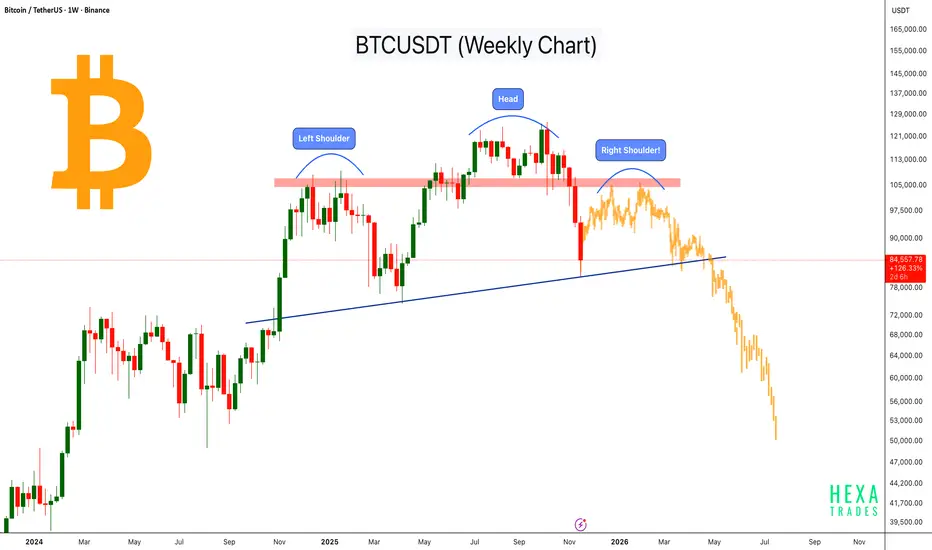
Bitcoin’s Macro H&S Structure Building Up!Bitcoin is developing a potential Head and Shoulders pattern on the weekly timeframe, a classic bearish reversal structure. The price has repeatedly rejected the major resistance zone marked in red, indicating strong selling pressure.
As of now, the left shoulder and head are already formed, and based on the current structure, the right shoulder could form within the next 1–3 months if BTC continues to face resistance near this zone $100k- $107k
Price is currently hovering near the long-term ascending trendline (neckline), which will play a key role in determining whether this pattern completes and confirms.
The yellow candles represent a forecast, illustrating a possible scenario if the right shoulder forms and the neckline breaks.
Key Highlights
- Left shoulder and head are already formed; right shoulder may form in the next 1–3 months.
- Strong rejection from major resistance, similar to classic H&S structures.
- Ascending neckline acting as final support.
- Yellow candles are only a forecast, not actual price data.
- Pattern confirmation requires a decisive break below the neckline.
This is an early-stage macro pattern, and traders should watch how BTC reacts around the resistance zone and the neckline in the coming weeks.
Cheers
Hexa
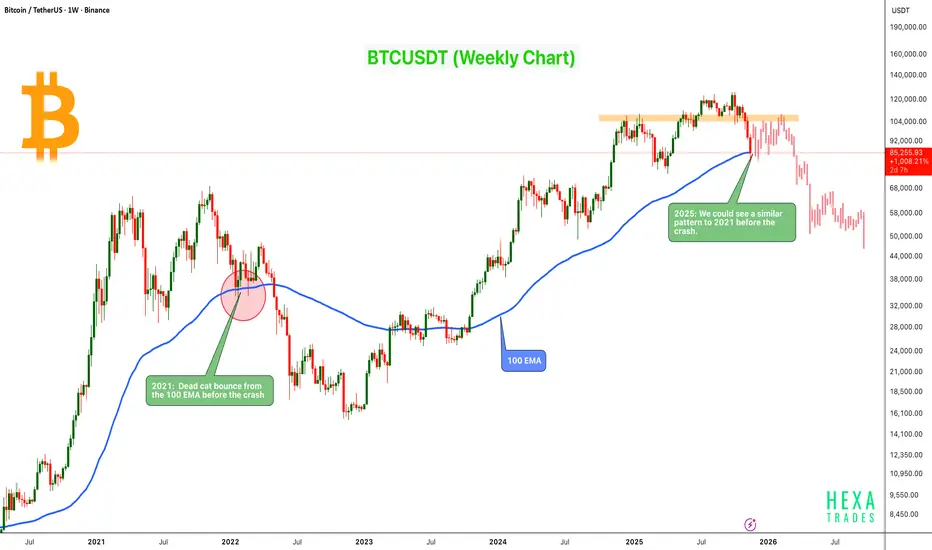
2021 vs 2025: Bitcoin Showing a Similar Macro StructureBitcoin is showing a price structure very similar to the 2021 macro top, where BTC formed a dead-cat bounce from the 100 EMA before beginning a major correction.
On the current cycle, BTC is once again testing the 100 EMA, and the price reaction looks very similar to the 2021 pattern: a brief bounce followed by continued downside pressure.
Key Points:
- 2021 Pattern: BTC bounced from the 100 EMA before the macro crash.
- 2025 Price Action: Showing a similar bounce and reject structure at the same weekly EMA.
- Major Weekly Resistance: Market showing exhaustion and lower-high structure, just like previous cycle tops.
- Potential Dead-Cat Bounce: We could see a bounce toward the $100K–$107K zone before the downtrend continues.
- Possible Repeat Scenario: If BTC fails to hold above the 100 EMA, history suggests a deeper correction may follow.
Cheers
Hexa
ETH : Oversold RSI + Fib Golden Zone = High-Probability ReversalETH is currently trading inside a major historical support zone, an area where price has repeatedly been rejected and bounced in the past. This level has acted as a strong demand zone multiple times, and the price is once again testing it.
On the momentum side, the RSI has dipped below 30 on the daily chart. Historically, every time ETH’s RSI dropped into the oversold region, it marked a strong bottom formation followed by a notable bounce.
Price is also sitting inside the Fibonacci golden zone, adding further confluence that this area could act as a potential reversal point.
Key Points:
- Strong multi-tested support zone
- Price reacting inside the Fib golden pocket
- Daily RSI oversold (<30) - historically reliable bottom signal for ETH
- High probability bounce zone if the support holds
- This is a critical level to watch for bullish reactions or early reversal signals.
Cheers
Hex
Bitcoin RSI Oversold Again - Is Another bounce Coming?Bitcoin chart highlights a repeating pattern on Bitcoin’s daily timeframe: every time the RSI drops into oversold territory (below 30), it has historically marked a major local bottom followed by a strong recovery.
On the price chart above, each green arrow represents a previous swing low. On the RSI panel, the boxed areas show moments when RSI dipped below 30. Every one of these events has been followed by a noticeable rebound in Bitcoin’s price.
We are now seeing the same setup again. RSI has once again fallen into the oversold zone, aligning with another green arrow on the chart. If history repeats, we could see a similar recovery this time too, just as Bitcoin has done consistently over previous cycles.
Key Points
- Historically on the daily chart, whenever RSI dropped below 30, Bitcoin experienced a recovery soon after.
- The current RSI reading is tapping this same level again.
- This confluence suggests a potential bottoming zone and possible trend reversal.
- While not a guarantee, the pattern has been reliable across multiple past cycles.
Cheers
hexa

ETHUSDT: Rebound Setup from Broadening Wedge SupportETH is currently respecting the lower boundary of a broadening wedge pattern, a structure known for sharp reversals once price taps the support zone. The latest reaction shows buyers defending this area, indicating a potential upside move.
Entry: Current support area of the broadening wedge, below $3200
Stop-Loss: $2900
Take-Profit: 10%, 20% , 40%
Cheers
Hexa

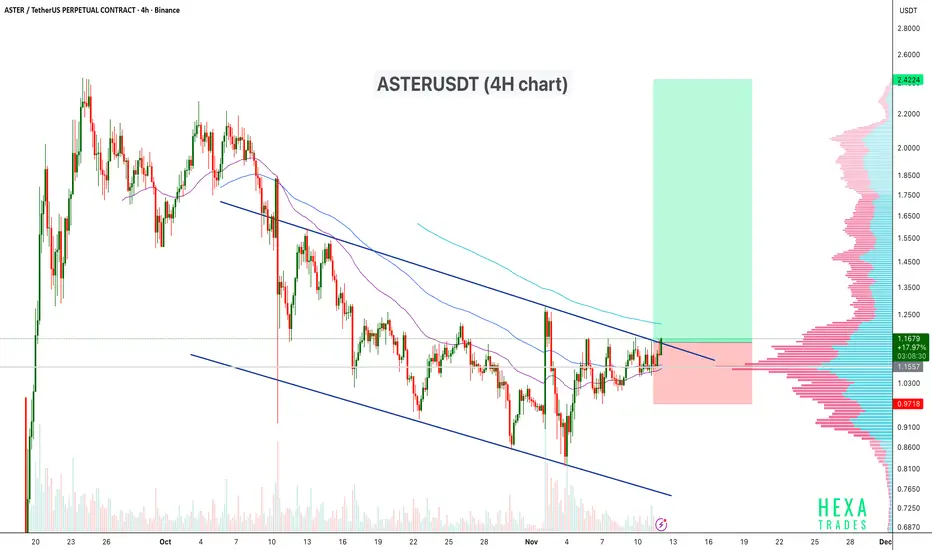
ASTERUSDT Breaking Out of the Descending Channel?ASTERUSDT is trading within a descending channel on the 4H chart, showing consistent lower highs and lower lows over the past few weeks. The price is now testing the upper trendline of the channel, signaling a potential breakout attempt. A confirmed breakout with volume could indicate a shift in trend momentum toward a bullish reversal.
Pattern: Descending Channel
Entry Zone: Near $1.15–$1.18 (breakout confirmation)
Stop-Loss: Below $0.96
If the breakout sustains above the upper trendline and 200 EMA, we may see strong bullish continuation towards the next resistance levels.
Cheers
Hexa
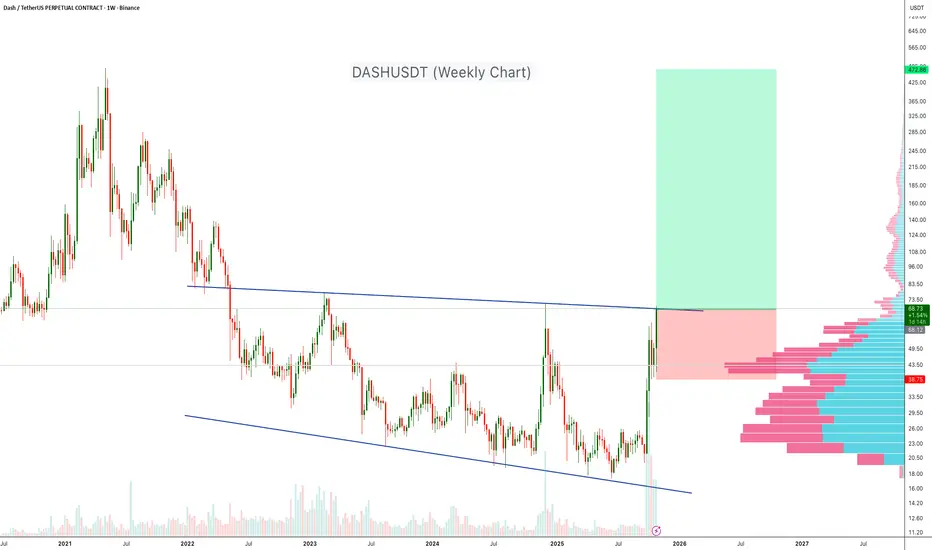
DASHUSDT Start of a Massive Rally?DASH has been trading inside a multi-year descending channel since early 2021. After several rejections from the upper boundary, the price has finally shown a strong breakout with a massive weekly candle, signaling potential trend reversal.
Key Points:
- Price has clearly broken out from the upper trendline of the descending channel.
- Strong buying volume supports the breakout confirmation.
- Historical volume profile shows a major liquidity gap above $70, suggesting room for a fast move once the price holds above the breakout zone.
🔷 Entry Zone: Below $70
🔷 Stop Loss: Below $38
🔷 Target: $400–470 (long-term potential)
Conclusion:
A confirmed breakout from a long-term descending channel could mark the beginning of a major uptrend for DASH. Sustained momentum above $70 may attract more volume and push the pair toward higher resistance zones.
Cheers
Hexa
NASDAQ:DASH BINANCE:DASHUSDT
MANTAUSDT Bullish Channel Breakout!MANTA is showing a potential bullish breakout from a descending channel that has been holding price down throughout October. The recent strong recovery and breakout attempt above the upper trendline indicate early signs of trend reversal and possible momentum shift to the upside.
Key Points:
-Price has broken the upper boundary of the descending channel after multiple rejections.
-Volume increase on breakout confirms buyer activity.
- Horizontal volume profile shows a strong liquidity base near $0.10 – $0.11, which could act as solid support.
- Short-term target zone lies between $0.18 – $0.20, aligning with the next major supply area.
- Ideal invalidation below $0.095.
Buy zone : Above $0.115
Stop loss : $0.095
Cheers
Hexa
OMXHEX:MANTA BINANCE:MANTAUSDT

TAOUSDT: Bullish Breakout From Symmetrical TriangleTAO is showing a strong breakout setup on the 4H timeframe after consolidating within a symmetrical triangle pattern. Price has been forming higher lows while testing descending resistance multiple times - a classic sign of bullish pressure building up.
The breakout candle is now pushing above the trendline with increasing volume and EMAs (50/100/200) acting as dynamic support, indicating potential continuation to the upside.
Cheers
Hexa

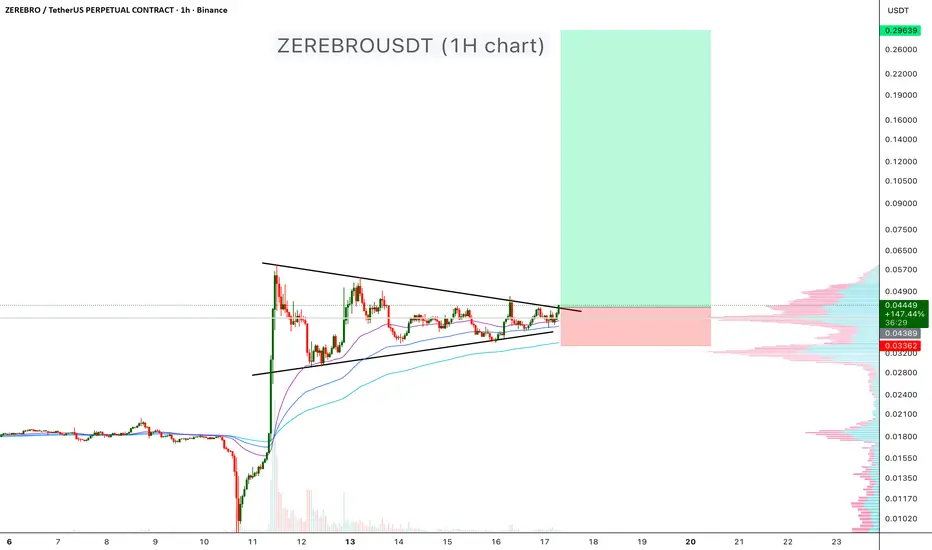
ZEREBROUSDT – Triangle Breakout Loading!ZEREBRO is currently consolidating inside a symmetrical triangle pattern on the 1-hour timeframe after a massive impulsive move to the upside. The price has been forming higher lows while facing consistent resistance from the descending trendline, showing clear compression in volatility — a typical sign of an upcoming breakout.
The structure suggests that bulls are gradually gaining strength, supported by multiple retests of the EMA cluster (50/100/200) acting as dynamic support. Volume has been decreasing during consolidation, which often precedes a strong breakout.
If price breaks and closes above the triangle resistance with increased volume, it could trigger a sharp move toward the $0.10–$0.30 target zone, aligning with the measured move projection of the triangle pattern.
Cheers
Hexa.
Bitcoin Another Bounce Coming?Bitcoin is currently retesting its 50-week Simple Moving Average (SMA) — a historically significant support zone that has acted as a launchpad for multiple bullish continuations throughout previous markets.
Each time BTC has interacted with this moving average since mid-2023, it has managed to rebound strongly, confirming it as a key dynamic support level during this bull phase.
🔶If BTC holds above the 50-week SMA, it may indicate another healthy correction within an ongoing uptrend, potentially setting the stage for the next leg higher.
🔶A clean weekly close below the 50 SMA could suggest a trend weakening and open the door for deeper retracements toward the $90K–$95K region.
Cheers
Hexa

Bitcoin Cup and Handle Pattern!BTCUSDT technical analysis update
BTC is forming a cup and handle pattern on the weekly chart. The price is currently forming the handle, which could take 1-2 months to complete. Once the price breaks the neckline, we can expect a significant bullish move in BTC.
Regards
Hexa

USELESSUSDT Next Leg Up Loading?USELESSUSDT is forming a clean bullish flag pattern on the daily timeframe — a classic continuation setup that often appears after a strong impulse move. The price is now testing the flag’s upper resistance line, suggesting a potential breakout continuation to the upside.
Technical Highlights:
🔷 Pattern: Bullish Flag (Continuation Pattern)
🔷Trend: Strong uptrend followed by controlled consolidation inside the flag
🔷 Moving Average: Price reclaiming the 50-100 EMA supports bullish momentum
🔷 Volume: Increasing on breakout attempts — early sign of strength
- Entry: close above flag resistance (~$0.28 area)
- Stop-Loss: Below recent swing low or lower flag boundary (~$0.20)
- Target Zone: $0.90 – $1.00 (based on flagpole projection)
Bullish – Confirmation above the flag’s resistance could lead to a sharp continuation rally.
Thanks
Hexa
Disclaimer:
This analysis is for educational purposes only and not financial advice. Always perform your own due diligence and manage risk properly.

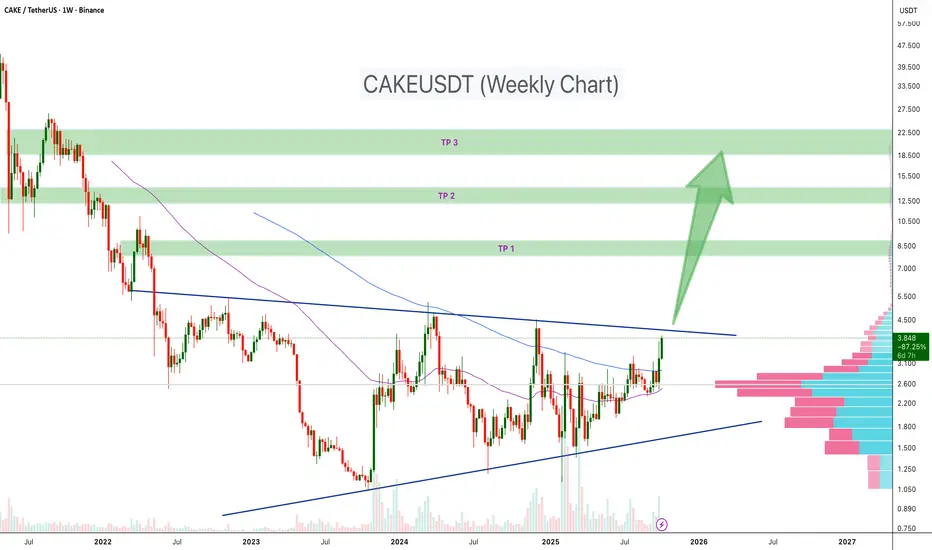
PancakeSwap Ready for a Major Rally!CAKE is showing strong signs of a potential long-term breakout after consolidating inside a symmetrical triangle pattern for nearly two years. The price recently broke above the mid-term resistance trendline, supported by increasing volume and a solid weekly close above the 50 and 100-week moving averages.
Technical Highlights:
🔷 Pattern: Symmetrical triangle formation in the weekly chart
🔷 Trend Confirmation: Price reclaiming above 50 and 100 EMA
🔷 Volume Profile: Strong accumulation between $1.8–$2.5 zone (visible on VPVR)
Target Zone
🟢 TP 1: $8.00 – $9.00
🟢 TP 2: $12.00 – $14.00
🟢 TP 3: $20.00 – $23.00
Bullish – Breakout confirmation on higher timeframes could initiate a strong mid-term rally toward TP2–TP3 levels.
Cheers
Hexa
Disclaimer:
This analysis is for educational purposes only and not financial advice. Always DYOR and manage risk responsibly.
ETH Oversold Again – Is a Bounce Coming?Ethereum (ETHUSDT) on the 4H chart is showing signs of oversold conditions as the RSI once again dips below the 30 level. This setup has historically aligned with local bottoms, where ETH tends to bounce back shortly after reaching such extreme levels of selling pressure. The current price action around $4,170 highlights a critical zone to monitor for potential reversal.
If ETH can hold this level and buying momentum steps in, a relief rally could follow in the short term. However, if weakness persists, further downside retests cannot be ruled out. Traders should closely watch RSI recovery and volume confirmation for signals of a stronger rebound.

LINEAUSDT: Inverse H&S Breakout!LINEAUSDT is showing a strong Inverse Head & Shoulders pattern on the 4H timeframe, signaling a potential bullish reversal after weeks of consolidation. Price has now broken above the neckline, opening the door for a continuation move to the upside.
Key Points:
- Clear Inverse H&S with Left Shoulder – Head – Right Shoulder.
- Neckline breakout confirmed with bullish momentum.
- Volume profile shows heavy support around 0.029 – 0.030 zone.
Trade Setup:
- Entry Zone: Above neckline breakout (~0.033–0.034).
- Target Zone: $0.055
- Stop-Loss: Below 0.0265
Cheers
Hexa

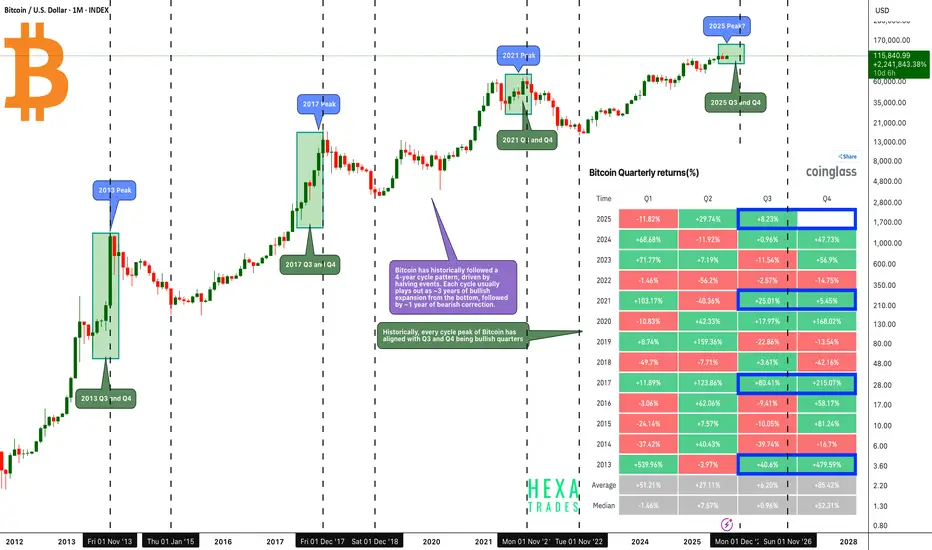
Bitcoin - Final Pump Before the Crash?Bitcoin has historically followed a 4-year cycle pattern, driven by halving events. Each cycle usually plays out as ~3 years of bullish expansion from the bottom, followed by ~1 year of bearish correction.
Historically, every cycle peak of Bitcoin has aligned with Q3 and Q4 being bullish quarters, making the second half of the year the most critical period for cycle tops.
Key Observations from Previous Cycle Peaks:
🔶 2013 Peak:
- Q3: +40.6%
- Q4: +479.59%
Strong acceleration into year-end marked the cycle top.
🔶 2017 Peak:
- Q3: +80.41%
- Q4: +215.07%
A similar explosive move as Bitcoin entered the mania phase.
🔶 2021 Peak:
- Q3: +25.01%
- Q4: +5.45% .
🔶 Current Cycle (2025 Peak?):
- Q3 2025 is already up +8.23% with 15 days remaining until the quarter ends.
- If history repeats, Q4 could be the blow-off phase where Bitcoin accelerates sharply to its peak.
🔶 Potential 2025 Target:
Bitcoin’s Q4 2025 peak could realistically reach the $140K–$160K range before entering the next corrective phase.
Conclusion: If Bitcoin follows its established 4-year cycle structure, we could be entering the final bullish leg of this cycle. History suggests Q3 and Q4 have the highest probability of producing outsized gains, with Q4 especially aligning with cycle peaks.
Cheers
Hexa
BINANCE:BTCUSDT CRYPTOCAP:BTC BITSTAMP:BTCUSD BINANCE:BTCUSDC
Altseason Confirmed?The crypto total market cap excluding BTC and ETH has officially broken out of a multi-year consolidation, completing a textbook Cup & Handle pattern on the weekly chart. This structure has been forming since the 2021 peak, followed by the deep 2022 bear market and a steady recovery through 2023–2025. The breakout above the $1.1T–$1.16T resistance zone is a strong signal of renewed strength in altcoins, with volume confirming bullish momentum.
With this breakout, the market opens the door for a potential rally toward the $2.0T level;, which aligns with previous highs and measured move targets. As BTC and ETH dominance stabilizes, capital rotation into altcoins could accelerate, fueling this next leg higher.
Cheers
Hexa

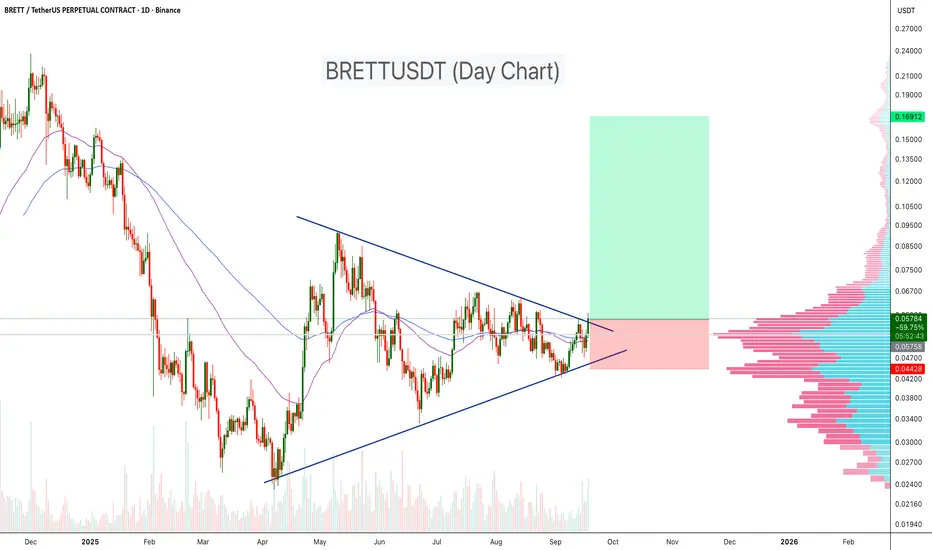
BRETTUSDT – Symmetrical Triangle Breakout!BRETTUSDT has been consolidating within a symmetrical triangle for several months, showing strong compression between ascending support and descending resistance. Recently, price action has started to break above the resistance trendline, signaling a possible bullish continuation. With moving averages turning supportive and volume profile showing a low-resistance zone above, this breakout could trigger a strong move higher.
Key Points:
- Pattern: Symmetrical triangle consolidation since April.
- Support: Strong base around 0.045 USDT (stop-loss zone).
- Resistance Breakout: Price breaking above 0.058 level.
- Volume Profile: Thin liquidity gap above, could accelerate upside.
- Target Zone: 100%-200% move in midterm
- Moving Averages: Price reclaiming 50 & 100 EMA, confirming bullish momentum.
Cheers
Hexa