HFT/USDT — Will Bears Continue, or Will Bulls Take Control?Overview:
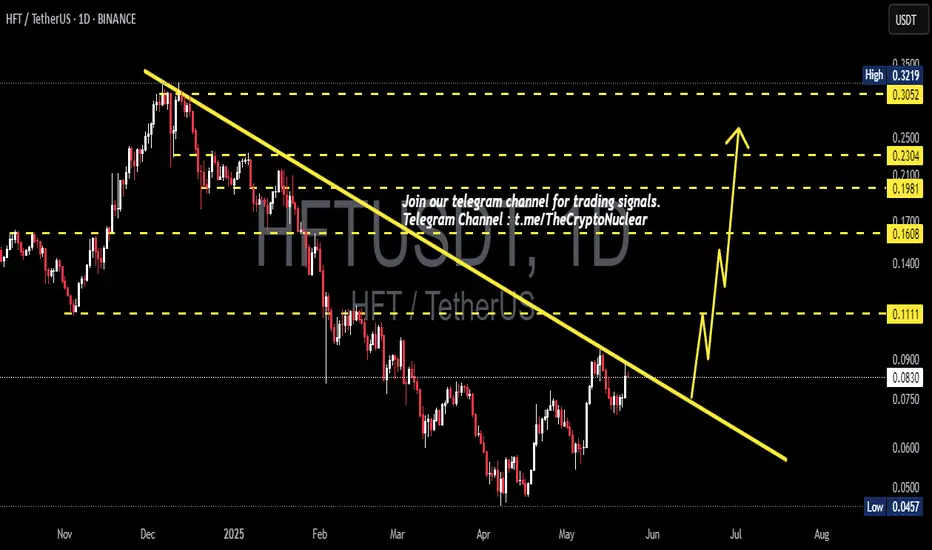
HFT has been trapped in a long-term downtrend since 2022, defined by the descending yellow trendline. Price is now consolidating at a critical zone, holding above strong support around 0.0431 (Low) while testing the descending trendline near 0.0969.
This is a make-or-break moment: will it continue the bearish cycle or start a potential accumulation phase for a major reversal?
---
🔎 Pattern & Market Structure
Descending Trendline → pressing the market down with consistent lower highs since 2022.
Horizontal Support → 0.0431 has been the main floor, repeatedly tested.
Potential Scenarios:
Breakdown confirms a descending triangle, continuation of the downtrend.
Breakout above the trendline may signal a falling wedge breakout, often leading to strong bullish reversal.
---
🟢 Bullish Scenario
1. Breakout Confirmation: Weekly close above the descending trendline (~0.0969).
2. Healthy Retest: Price flips the trendline into support with strong rejection of the downside.
3. Upside Targets:
0.1596 → first key resistance
0.2290 → strong supply zone
0.3093 – 0.3917 → medium-term bullish targets
4. Extra Signals: Strong breakout volume + bullish RSI divergence would strengthen the setup.
---
🔴 Bearish Scenario
1. Rejection at Trendline: Price fails to break above ~0.0969.
2. Breakdown Below 0.0431: Weekly close under this level confirms bearish continuation.
3. Downside Target: Opens the path for new lows, as historical support becomes invalid.
4. Confirmation: Weakening buying volume + momentum indicators (MACD/RSI) pointing down.
---
📌 Conclusion & Strategy
HFT is at a decision zone: either confirm a bullish reversal or extend its long-term bearish cycle.
Bullish Path: A breakout with volume could trigger a swing move toward 0.1596 → 0.2290.
Bearish Path: A breakdown below 0.0431 validates the descending triangle → continuation to new lows.
Risk Management is crucial — this is a high-volatility zone.
---
📢 Trader’s Note
Wait for weekly confirmation candles before committing to a position.
Aggressive traders may speculate longs near support with tight stops under 0.0431.
Conservative traders should wait for a confirmed breakout above the trendline.
Remember: low price ≠ cheap — always confirm with structure and volume.
---
#HFT #HFTUSDT #CryptoAnalysis #Altcoins #CryptoTrading #Breakout #BearishVsBullish #SupportResistance #Trendline
Hftlong

HFTUSDT 1D AnalysisHFT ~ 1D Analysis
#HFT Buy after successfully breaking through this resistance line if you still have confidence in this coin with a short-term target of at least 10%+.
HFTUSDT Long Setup / 2x-3x LeverageBINANCE:HFTUSDT
📈Which side you pick?
Bull or Bear
Low-risk status: 3x-4x Leverage
Mid-risk status: 5x-8x Leverage
(For beginners, I suggest low risk status)
👾Note: The setup is active but expect the uncertain phase as well. also movement lines drawn to predict future price reactions are relative and approximate.
➡️Entry Area:
Yellow zone
⚡️TP:
0.2912
0.3038
0.319
🔴SL:
0.2670
🧐The Alternate scenario:
If the price stabilizes against the direction of the position, below or above the trigger zone, the setup will be canceled.

HFTUSDTHFT ~ 3D
#HFT trying to break out this descending pattern. Wait for this descending pattern to be successfully broken, and you can make purchases gradually. If you have Conviction on this coin.


HFT +500% tradeHow we can see upcoming +500% trade on BINANCE:HFTUSDT
Possible Targets and explanation idea
➡️IAP model In play. We can come back and sweep lower low from Dec 2023
➡️Dec 2023 was a perfect test 0.86 lvl
➡️Under 0.86 lvl now Buy line on Take Profit indicator
➡️Marked main stop losses which will be like a fuel for main target -0.27 zone and -0.618
Hope you enjoyed the content I created, You can support with your likes and comments this idea so more people can watch!
✅Disclaimer: Please be aware of the risks involved in trading. This idea was made for educational purposes only not for financial Investment Purposes.
---
• Look at my ideas about interesting altcoins in the related section down below ↓
• For more ideas please hit "Like" and "Follow"!

#HFT/USDT#HFT
The price is moving in a bearish channel on the 12-hour frame and is sticking to it well
The price rebounded well from the lower channel border at the green support level 0.2900
We have a tendency to stabilize above the Moving Average 100
We are oversold on the RSI indicator and we have a downtrend that is expected to break higher to support the rise
Entry price is 0.2930
The first target is 0.3260
The second goal is 0.3861
The third goal is 0.4510
