HFT/USDT — Will Bears Continue, or Will Bulls Take Control?Overview:
HFT has been trapped in a long-term downtrend since 2022, defined by the descending yellow trendline. Price is now consolidating at a critical zone, holding above strong support around 0.0431 (Low) while testing the descending trendline near 0.0969.
This is a make-or-break moment: will it continue the bearish cycle or start a potential accumulation phase for a major reversal?
---
🔎 Pattern & Market Structure
Descending Trendline → pressing the market down with consistent lower highs since 2022.
Horizontal Support → 0.0431 has been the main floor, repeatedly tested.
Potential Scenarios:
Breakdown confirms a descending triangle, continuation of the downtrend.
Breakout above the trendline may signal a falling wedge breakout, often leading to strong bullish reversal.
---
🟢 Bullish Scenario
1. Breakout Confirmation: Weekly close above the descending trendline (~0.0969).
2. Healthy Retest: Price flips the trendline into support with strong rejection of the downside.
3. Upside Targets:
0.1596 → first key resistance
0.2290 → strong supply zone
0.3093 – 0.3917 → medium-term bullish targets
4. Extra Signals: Strong breakout volume + bullish RSI divergence would strengthen the setup.
---
🔴 Bearish Scenario
1. Rejection at Trendline: Price fails to break above ~0.0969.
2. Breakdown Below 0.0431: Weekly close under this level confirms bearish continuation.
3. Downside Target: Opens the path for new lows, as historical support becomes invalid.
4. Confirmation: Weakening buying volume + momentum indicators (MACD/RSI) pointing down.
---
📌 Conclusion & Strategy
HFT is at a decision zone: either confirm a bullish reversal or extend its long-term bearish cycle.
Bullish Path: A breakout with volume could trigger a swing move toward 0.1596 → 0.2290.
Bearish Path: A breakdown below 0.0431 validates the descending triangle → continuation to new lows.
Risk Management is crucial — this is a high-volatility zone.
---
📢 Trader’s Note
Wait for weekly confirmation candles before committing to a position.
Aggressive traders may speculate longs near support with tight stops under 0.0431.
Conservative traders should wait for a confirmed breakout above the trendline.
Remember: low price ≠ cheap — always confirm with structure and volume.
---
#HFT #HFTUSDT #CryptoAnalysis #Altcoins #CryptoTrading #Breakout #BearishVsBullish #SupportResistance #Trendline
Hftsignals

HFTUSDT 1D AnalysisHFT ~ 1D Analysis
#HFT Buy after successfully breaking through this resistance line if you still have confidence in this coin with a short-term target of at least 10%+.
Downtrends Finding Support for the Next Uptrend: AMAT ExampleNASDAQ:AMAT was over-speculated in 2023 and then had a top formation that trended down starting in July 2024. This is still considered technically to be an intermediate-term trend correction. The selling started at an all-time high.
HFTs are constantly in the mix, selling down. However, the shift of sentiment has started and there are gaps up recently.
It is NOT in a buyback mode but the stock is finding support from the 2021 highs, which is strong support. This should provide the basis for the beginning of a bottom formation.

HFTUSDTHFT ~ 3D
#HFT trying to break out this descending pattern. Wait for this descending pattern to be successfully broken, and you can make purchases gradually. If you have Conviction on this coin.

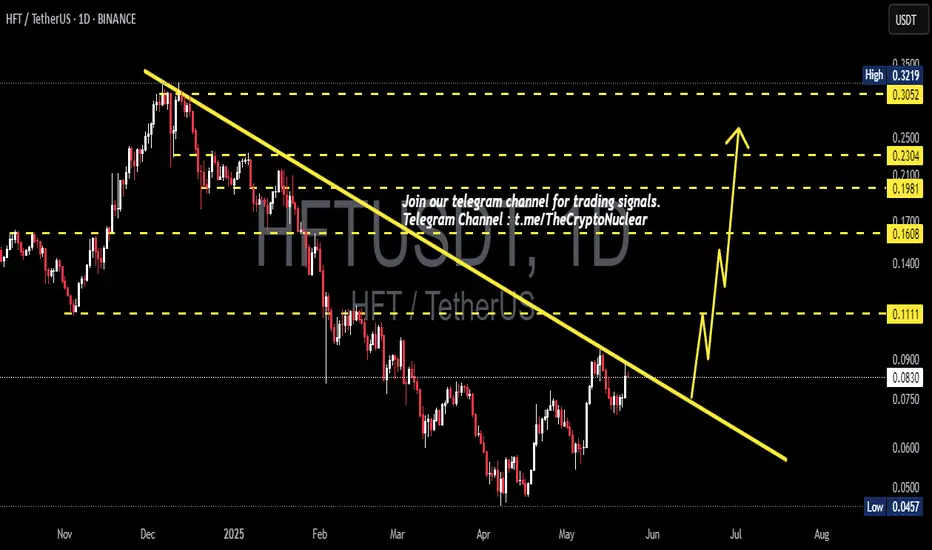
#HFT (SPOT) entry range (0.1200- 0.1590) T.(0.3950) SL(0.1113)BINANCE:HFTUSDT
entry range (0.1200- 0.1590)
Target1 (0.2430)- Target2 (0.3060)- Target3 (0.3950)
3 Extra Targets(optional) in chart, if you like to continue in the trade with making stoploss very high.
SL .1D close below (0.1113)
*** collect the coin slowly in the entry range ***
**** #Manta ,#OMNI, #DYM, #AI, #IO, #XAI , #ACE #NFP #RAD #WLD #ORDI #BLUR #SUI #Voxel #AEVO #VITE #APE #RDNT #FLUX #NMR #VANRY #TRB #HBAR #DGB #XEC #ERN #ALT #IO #ACA #HIVE #ASTR #ARDR #PIXEL #LTO #AERGO #SCRT #ATA #HOOK #FLOW #KSM #HFT ****

