The "Hidden RSI Divergence" and a LIVE TRADEFinding regular divergences is an easy thing especially when you're using the heiken Ashi algo oscillator but finding hidden divergences can be a little bit more complex. So in today's video I'm going to show you how to find hidden divergences and what you should do with them.
Obviously step number one is go to the community scripts on tradingview and search for Heiken Ashi Algo Oscillator
If you Have any trouble finding it just follow this link
What you're watching me do in this video is identifying hidden Divergence has and I am doing a live trade.
I am also discussing the importance of setting your support and resistance levels as well as looking at your charts, doing your analysis on a high time frame and then doing your actual trades on a lower time frame.
In the previous video as I've mentioned before anything happening between the green and red or + 10 + - 10 range of the oscillator anything inside that area is irrelevant you don't care about heiken Ashi values or oscillators values or anything inside that area so when you have your RSI cross for example above the 0 level you also need a hike and as you candle to close above + 10 when you have your RSI value across below the 0 leveled you also need a heiken Ashi candle to close below the -10 level.
One thing to note is the major difference between regular divergences and hidden divergences is this.
When looking for Regular Divergence has you are looking for highs above the +10 of the oscillator or you are looking for Lowe's below the -10 level of the oscillator.
However with hidden Divergences it is different. a hidden Divergence will be the Lowe's above + 10 and the highs below -10. So at this point you are looking for the highway 6 or the low wicks in those areas.
But ultimately you still trade them the same way. Meaning that if your RSI slope is to the down side then you have to be ready for your price to move down. If the slope of your RSI Divergence is to the upside then you have to be ready for price to move up.
I could do my best to tell you in this dialogue how to do this trade however it would be best for you to just watch this video and ask questions below.
Hiddendivergence

Mon 26th September 2022 GBP/AUD Daily Forex Chart Sell SetupGood morning fellow traders. On my Daily Forex charts using the High Probability & Divergence trading methods from my books, I have identified a new trade setup this morning. As usual, you can read my notes on the chart for my thoughts on this setup. The trade being a GBP/AUD Sell. Enjoy the day all. Cheers. Jim

: Fri 23rd September 2022 GBP/NZD Daily Forex Chart Sell SetupGood morning fellow traders. On my Daily Forex charts using the High Probability & Divergence trading methods from my books, I have identified a new trade setup this morning. As usual, you can read my notes on the chart for my thoughts on this setup. The trade being a GBP/NZD Sell. Enjoy the day all. Cheers. Jim

Short AUDCAD Hidden DivergenceThe AUDCAD has recently completed a triple top and has formed hidden divergence on the MACD. This is signaling a continuation of the downtrend. Also the COT Report has the Australian Dollar in a heavily short position and the Canadian Dollar positively long which setup up a nice short for us. Both of these currencies are commodity correlated. Gold is falling( Aussie correlated) and Oil is looking for a rebound but also falling( CAD corelated). And the Market cycle for this pair is bearish for Aug 2 to Sept 28.
Entry 0.8955 | SL 0.9110 | TP1 0,8850 | TP2 0.8750

EURUSD Daily Hidden Negative DivergenceEURUSD shows significant daily hidden negative divergence. This suggests that though the EUR
may have bottomed longterm in short term it likely pulls back

Nas100 4h Hidden Bullish DivergenceIf you thought the trading was terrible wait till you see this chart.
God damn, everything has to either a. not trade at all or b. monitored
every 3 seconds. The 4hr divergences trumps the 1hr. And weekly the daily etc.
Sorry about this whipsaw but it's the nature of the beast.

Negative Hidden Divergence About Bitcoin ( Road to $16.500)Currently, a hidden negative mismatch exists in the correlation between the price and the relative strength index in the 4-hour timeframe.
The fact that the price received a rejection response from the 200 hourly simple moving average affects our situation even more negatively.
A simple ABCD setup and the values of the lower band of the channel we are currently in lead us to the $16,500 price target.

GRT is going to Decrease + Target Provided!GRT is in a Descending Triangle and we can Expect the Price to Fall because Not only The Price is in a Bearish Pattern and That the Price would Decrease as much as the Measured Price movement (AB=CD) ,We also have a Hidden Bearish Divergence (-HD) on MACD as well! This Means that The Bulls are in Real Trouble Right now! The Price should Reach around 0.105$ after Descending!
-GRT is in a Descending Triangle
-Price will Decrease as much as the Measured Price Movement (AB=CD)
-(-HD) On MACD
-0.105$ Is the Right Price!
_ _ _ _ _ _ _ _ _ _ _ _ _ _ _ _ _ _ _ _ _ _ _ _ _ _ _ _ _ _ _ _ _
Thank you for seeing idea .
Have a nice day and Good luck

BTC Weekly HUGE Hidden Bull Divergence?Just found this recently.. I'm a believer of zooming out and looking at the weekly I've noticed a few things. Not only that there is a hidden bullish divergence in play, the RSI is a lot LOWER than 2021 May Dump. What are your plays here?? Long but short term?? Or longing in the next few weeks?
Let me know your thoughts!

OIL Hidden Bullish DivergenceOil looks to continue its bullish run as we can see hidden bullish divergence. Strange how they blame Biden for hidden bullish divergence.
Seems to me like buyers are the reason Oil is going up. Stops to me looks to be below recent low.

Thu 9th Jun 2022 AUD/USD Daily Forex Chart Sell SetupGood morning fellow traders. On my Daily Forex charts using the High Probability & Divergence trading methods from my books, I have identified a new trade setup this morning. As usual, you can read my notes on the chart for my thoughts on this setup. The trade being a AUD/USD Sell. Enjoy the day all. Cheers. Jim

NAS100 Hidden Bullish Divergence Suggests ContinuationIf you have been following my charts for a while, I suggested that the general markets could turn
back up as the monthly had blown off its extremely overbought state since I started posting in
December. Now that they have bounced we can see that the bulls are not done yet and
are looking to cross the 200ma on the 4hr time frame. The hidden bullish divergence suggests
that this is the case and we likely will continue the trend upwards. Are we in a new bull market?
We can not say...there isn't enough evidence at the moment and anyone that says otherwise
does not know what they are saying. We have evidence that the monthly is now oversold and
looking to turn back up--but it could be denied at the 50% line for monthly oscillators.
Maybe the oscillators could cross upwards past the 50% line and create Hidden Bearish Divergence
where the markets make a lower high but the monthly oscillator makes a higher high.
Maybe we make all time new highs. We ca not say. What we can say is that for now the bulls
seem to be in control and are looking to take this higher. Respect the divergences. I have proven
they must be respected. Good luck trading.
Here the set up is simple, WAIT for the 4hr Stochastic RSI to move past the 20% line to confirm a buy.

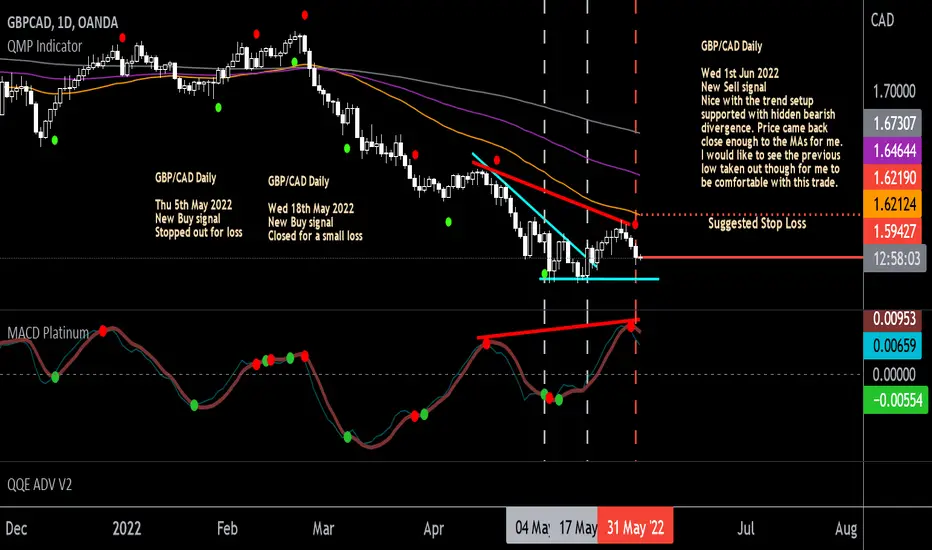
Wed 1st Jun 2022 GBP/CAD Daily Forex Chart Sell SetupGood morning fellow traders. On my Daily Forex charts using the High Probability & Divergence trading methods from my books, I have identified a new trade setup this morning. As usual, you can read my notes on the chart for my thoughts on this setup. The trade being a GBP/CAD Sell. Enjoy the day all. Cheers. Jim
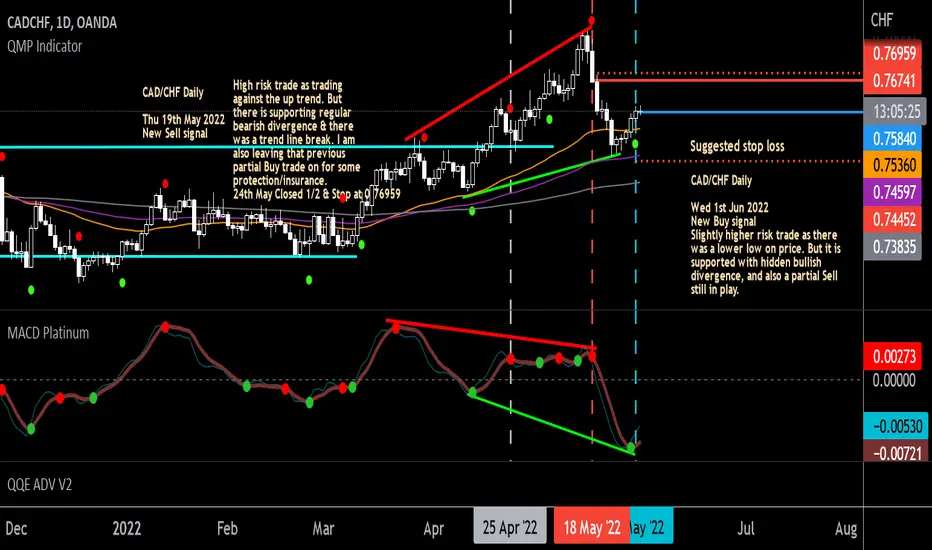
Wed 1st Jun 2022 CAD/CHF Daily Forex Chart Buy SetupGood afternoon fellow traders. On my Daily Forex charts using the High Probability & Divergence trading methods from my books, I have identified a new trade setup this morning. As usual, you can read my notes on the chart for my thoughts on this setup. The trade being a CAD/CHF Buy. Enjoy the day all. Cheers. Jim
Tue 31st May 2022 AUD/CHF Daily Forex Chart Buy SetupGood morning fellow traders. On my Daily Forex charts using the High Probability & Divergence trading methods from my books, I have identified a new trade setup this morning. As usual, you can read my notes on the chart for my thoughts on this setup. The trade being a AUD/CHF Buy. Enjoy the day all. Cheers. Jim

NZDUSD Hidden Positive DivergenceFrom previous posts there is some evidence that the NZD and AUD and the CAD may have bottomed and this
could be a longer lasting bounce. The fact that the NZD and the AUD CAD did not make lower lows and the
pullback was not massive and filled with panic selling suggests to me that there is enough evidence to support this
idea.

EURUSD Hidden Negative Divergence Suggests Further DownAgain similar situation as the AUD or NZD this likely pulls back
to new lows? We can not say at this time. What we can see is
weakness in this move up for the EUR. This is not a time to go
long on the EUR.

Nasdaq Hidden Divergence Suggests Further Down"Just when you thought you had gotten out, they pull you back in"
Humour for a serious market. This suggests that the markets are likely to see further
down. Just when you get hundreds of "ideas to buy". I suggest DON'T. But if you
are waiting to buy wait some more and don't short just watch as others panic.
Cryptos and currencies are showing very similar patterns. You should have
read my divergences tutorial its free, it keeps you safe by anticipating weakness
in this case and strength in other situations.

Tue 17th May 2022 GBP/JPY Daily Forex Chart Buy SetupGood morning fellow traders. On my Daily Forex charts using the High Probability & Divergence trading methods from my books, I have identified a new trade setup this morning. As usual, you can read my notes on the chart for my thoughts on this setup. The trade being a GBP/JPY Buy. Enjoy the day all. Cheers. Jim


Tue 3rd May 2022 NZD/JPY Daily Forex Chart Buy SetupGood morning fellow traders. On my Daily Forex charts using the High Probability & Divergence trading methods from my books, I have identified a new trade setup this morning. As usual, you can read my notes on the chart for my thoughts on this setup. The trade being a NZD/JPY Buy. Enjoy the day all. Cheers. Jim

Tue 3rd May 2022 EUR/GBP Daily Forex Chart Sell SetupGood morning fellow traders. On my Daily Forex charts using the High Probability & Divergence trading methods from my books, I have identified a new trade setup this morning. As usual, you can read my notes on the chart for my thoughts on this setup. The trade being a EUR/GBP Sell. Enjoy the day all. Cheers. Jim

Hidden Bullish Divergence APEStill long, we are holding above support, barely by a thread at the monthly close of Ape's first month of existence. Swing high little monkey.
