ER: The Hidden Tool 95% of Traders Ignore (But Shouldn’t)What if I told you there’s a free, stats-backed tool that shows you where price is likely to stop or reverse — with 68% confidence?
Meet Expected Range (ER) — not a magic bullet, but a massive edge when used right.
✅ Based on CME data & Nobel-winning math
✅ Defines high-probability support/resistance zones
✅ Free from CME website.
I never trade without checking ER anymore.
It turns noise into structure.
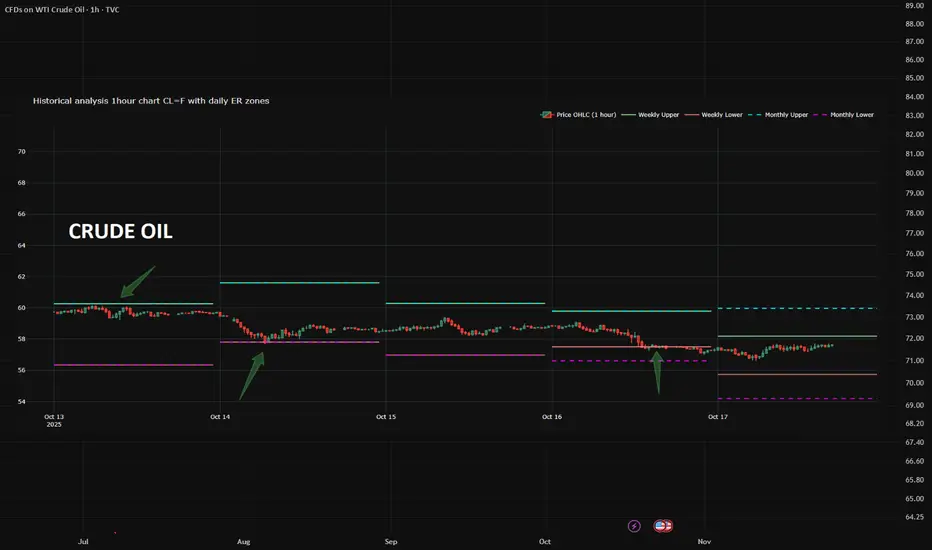
👉 Check the screenshots yourself — see how price reacted at each edge last week.
The only thing you need to do?
→ Grab ER data from the CME website daily
→ Apply a simple conversion formula
→ Plot it on your futures chart
That’s it.
Now you’ve got statistically grounded levels right in front of you.
Depending on your market view, you can:
• Short from the upper ER boundary
• Use it as a trend support entry zone
• Hide stops beyond the range — because price statistically won’t reach them
⚠️ Caveat: ER isn’t a crystal ball.
But in normal markets - ER zones hold ~4 out of 5 times.
Question for you:
Are you using ER? Or still guessing support/resistance?
Transparency first. No hype. Just real results.
Hiddensupport
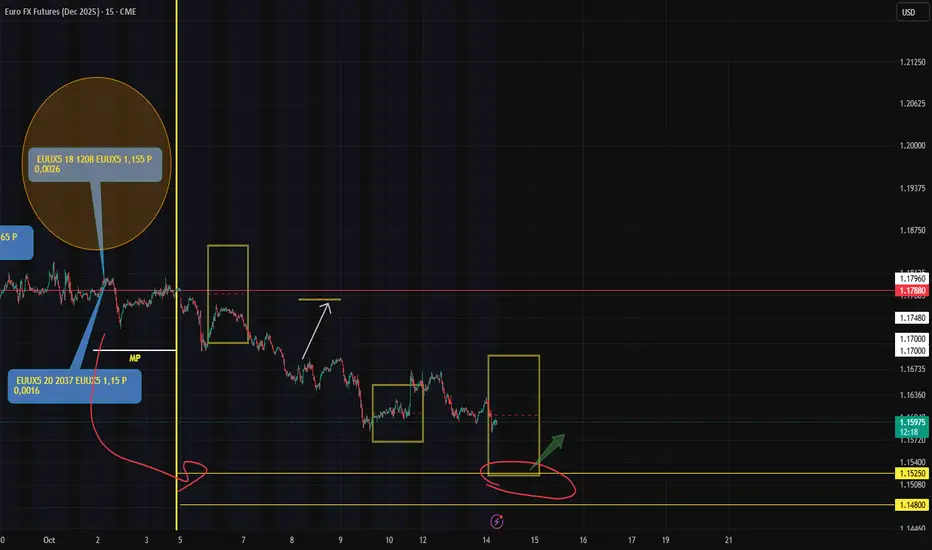
ER + Option Break-Even = Hidden Support Zone in EURA quick look at my slightly crazy trading chart for the Euro futures — here’s what matters today:
🔸 A naked put at 1.55 (circled) has seen outflows of nearly 1,300 contracts, with roughly 3,000 still open — though not all may be "naked" (some could be part of structured positions).
Important context:
This option is still out of the money (obviously), but holders have already made ~2x their initial premium and are now taking profits.
👉 So the right question is:
Why take profits now instead of waiting for further downside?
🔸 Second key point:
Today’s lower ER boundary aligns almost perfectly with the break-even level of this 1.55 put — where some open interest remains.
Now, if these are indeed naked puts (not complex hedged portfolios), then as price approaches this zone, traders will likely start buying futures to build up synthetic portfolio
📌 Result?
Potential bounce or short-term rally from this level.
Not because of bullish sentiment — but speculative logic
Are we Done Yet?Using the hidden support and resistance lines of trading assets we see here BTC has tested the 1.618 to the downside twice now which represents the end of a move some of the time. Usually the 2 fib is the clear end so from this chart we gain no directional clarity other than knowing exactly where we stand. Going to scale down time frames to the 1 hr. to see if any hint of direction. To play this chart it's very simple. If we break the 1.618 it's 99.9% chance going to test the 2. At the 2 volatility will boom and the move will be either a major reversal or the dreaded tank to the 3 (rare). Mind you I have only discovered these lines in the past year and have put thousands of hours into drawing and reading the price action enough to be confident here. every fib matters on the way back up as well till you pass the 1.

Spx500 Retest on the Trend Line for another position.So if you saw my previous Idea we sold off Spx500 and now we're going to get another entry to Short off the Yellow Trend line on the 1Hour time frame. This also conforms well with the RSI Trend Line. You can also find hidden Support on the 4 hour RSI
If any of these trend lines are broken, meaning that candles close above them then I will be closing my positions.

SPX500 Short Idea. It's about time it humbles itself.So there's a few good reasons this is a good short.
1. Using the Rsi you can see it's being pinched against the 70 levels very tightly now. It should break through that trend line holding as support.
2. Price has reached a Resistance level set by the 3 peaks that occurred in October-December
3. Pretty good Inverted Hammer that occured on 2/25/19
4. Spx500 has had a very strong rally since the new year and it's about time it humbles itself.
You can take profits at the daily 200 EMA and take profit 2 would be set at the downward trendline.
