HII - Wave BreakdownContinuing the idea on Huntington Ingalls Industries’ growth, let’s take a closer look at the current wave.
This is a classic five-wave structure, and we are now developing the final wave 5 .
Target range is between 355 and 390 , or potentially higher.
Afterwards, a gradual correction of the entire wave is expected.
---
Please subscribe and leave a comment.
You’ll get new information faster than anyone else.
---
HII

HII - High PotentialFrom early October 2011 to February 2018, Huntington Ingalls Industries was in a growth phase.
This was followed by a prolonged correction lasting from February 2018 to February 2025.
During this corrective phase, the price dropped by more than 50% and overlapped the sub-wave 1 , confirming the completion of the move.
Since February 2025, Huntington Ingalls Industries has been showing an impulsive upward movement.
Based on these factors, it can be assumed that the large waves 1 and 2 have already been completed, and the HII chart is now developing wave 3 .
Summary:
Significant upside potential remains in the long term.
In the next idea, we will take a closer look at the current impulsive move.
---
Please subscribe and leave a comment.
You’ll get new information faster than anyone else.
---

Buy HII in US stock market 20/7/2022You can buy it Target 220.29 stop loss 200
money management is your responsibility
I recommend entering a maximum of 10% of the portfolio.
good luck

HII High-risk Initial LongHII High-risk Initial Long. SL and TP on the chart. 10-20x leverage. Move SL on TP.

HII Huffington - Bullish divergence on weekly and dailyHII Bullish divergence on weekly and daily
Weekly
On the weekly there is a ATR channel divergence, MACD-H and Elder Force Index divergence.
Stochastic RSI is coming from an maximum oversold condition and is curling up.
The previous last 4 candles each show down wicks, every week it closed much higher then the lows that week, a sign that lower prices were rejected and not much sellers were to be found in that area.
Daily
On the daily there is a bullish divergence and a first low. It was not a higher low, but still, after that candle the direction is upwards.
The EMA’s are crossing and Elder Force index shows strength in the up move.
Stochastic RSI is maximum overbought, but by the looks of it the trend has reversed and is strongly up, so it could stay overbought for some time.
There is no divergence on Elder Force index, which is a bit worry some. The down ticks were with much force.
I expect the target on the weekly will be between the +0.5 ATR level and the +1.5 ATR level on the weekly.
The stop loss level is 2 ATR levels away on the daily, and is equal to the bottom of the lows.
Entry: 2/3 @ 149,98
1/3 I will buy on a pullback on the daily.
Stop loss: 137,33
Projected targets:
Target 1: 174,75
Target 2: 184,88
R/R ratio: 1:2
R/R ratio: 1:2,5
Note:
As the trade develops, ATR levels change as well. It could be that I move up my targets, as in my trading style, the targets are dynamic.
I will exit in thirds as well. And move a stop loss when a higher low has been formed.
I will try to update the trades here as well, regarding changed targets and stop losses.

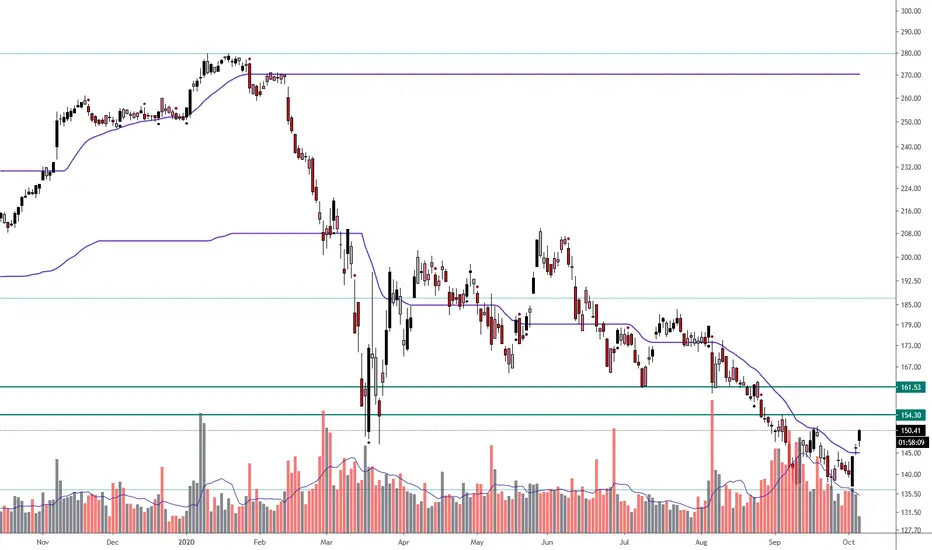
Huntington Ingalls Industries (HII) The time has come for this iron giant to return to strength. The government money is not going anywhere anytime soon, the Navy's #1 shipbuilder wont stay down for long. Green lines are weekly resistance areas I am watching. First target 187' after that its open skies (seas)...
HII Huntington Ingalls Set-UpHII
ENTRY = 178 - 180
1st Target = 382fib @ 197
2nd Target = .5fib @ 213
HODL Target = 229
Good luck, happy trading and stay chill,
2degreez
____________________________________________
This content is for informational and educational purposes only. This is not in any way, shape or form financial or trading advice.
Good luck, happy trading and stay chill,
2degreez

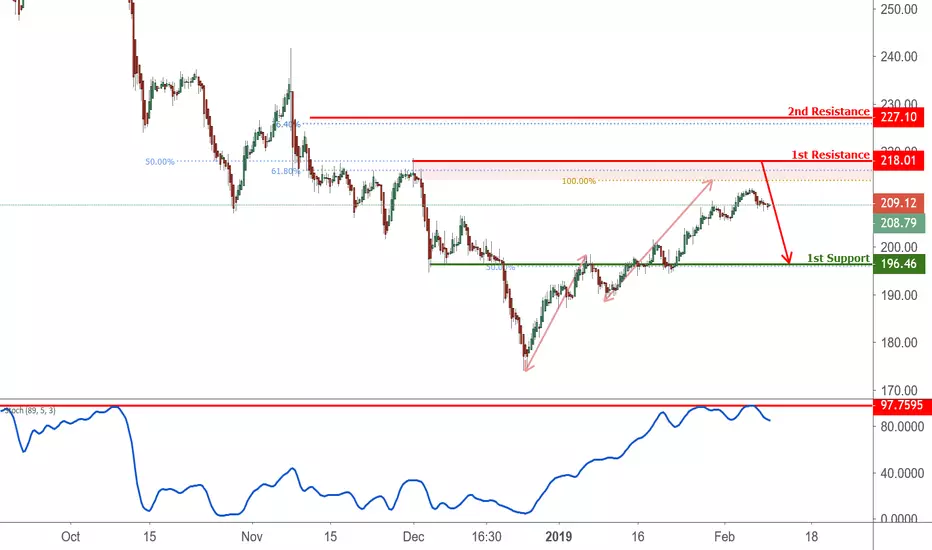
HII approaching resistance, potential drop! HII is approaching our first resistance at 218.01 (horizontal swing high resistance, 100% fibonacci extension, 61.8%, 50% Fibonacci retraceement) where a strong drop might occur below this level pushing price down to our major support at 196.46 (horizontal overlap support, 50% fibonacci retracement).
Stochastic (89,5,3) is also approaching resistance where we might see a corresponding drop in price.
HII approaching resistance, potential drop! HII is approaching our first resistance at 218.12 (horizontal swing high resistance, 50% Fibonacci retracement) where a strong drop might occur pushing price down to our major support at 196.13 (horizontal swing low support, 50% Fibonacci retracement).
Stochastic (89,5,3) is also approaching resistance where we might see a corresponding drop in price.

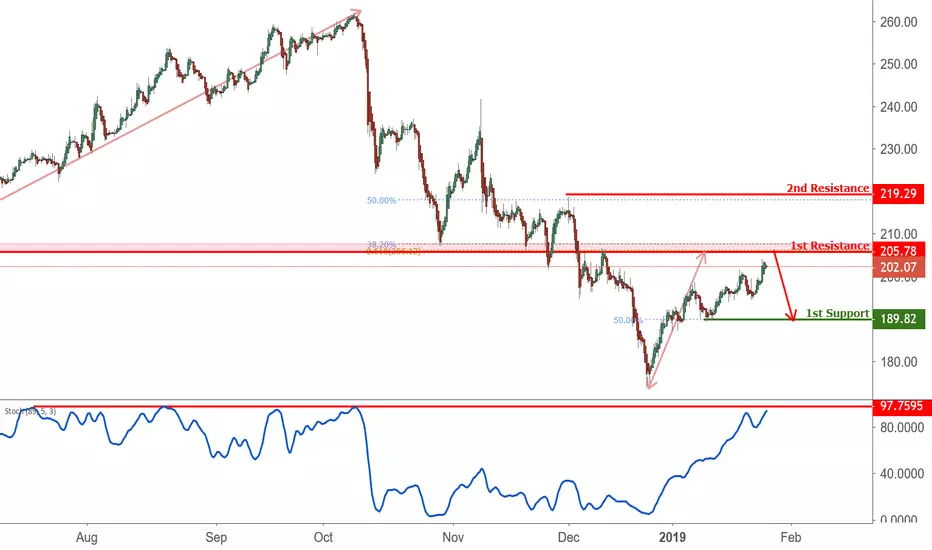
HII Approaching Resistance, Potential Drop! HII is approaching our first resistance at 205.78 (horizontal overlap resistance, 61.8% Fibonacci extension, 38.2% Fibonacci retracement) where a strong drop might occur below this level pushing price down to our major support at 189.82 (horizontal swing low support, 50% Fibonacci retracement).
Stochastic (89,5,3) is approaching resistance where we are seeing a drop below this level.