HKDJPY - 1H - DOUBLE TOP - SHORT ENTRYIn this chart we have observe a Double Top and Bearish Divergence which spotted that it will take a Down rally.
so we place Entry & TPs points accordingly.
HKDJPY

HKD/JPY - Bullish Divergence on RSI HKD/JPY has started a bullish trend after forming RSI divergence on the chart! Expecting price to continue making higher highs and higher lows!

HK33 looking for a limited rally?HS50 - 24h expiry - We look to Sell at 19820 (stop at 20150)
Although the bears are in control, the stalling negative momentum indicates a turnaround is possible.
A higher correction is expected.
The medium term bias remains bearish.
We therefore, prefer to fade into the rally with a tight stop in anticipation of a move back lower.
Further downside is expected although we prefer to sell into rallies close to the 19820 level.
Our profit targets will be 18880 and 18680
Resistance: 19650 / 20850 / 22790
Support: 18680 / 17710 / 16330
Risk Disclaimer
The trade ideas beyond this page are for informational purposes only and do not constitute investment advice or a solicitation to trade. This information is provided by Signal Centre, a third-party unaffiliated with OANDA, and is intended for general circulation only. OANDA does not guarantee the accuracy of this information and assumes no responsibilities for the information provided by the third party. The information does not take into account the specific investment objectives, financial situation, or particular needs of any particular person. You should take into account your specific investment objectives, financial situation, and particular needs before making a commitment to trade, including seeking advice from an independent financial adviser regarding the suitability of the investment, under a separate engagement, as you deem fit.
You accept that you assume all risks in independently viewing the contents and selecting a chosen strategy.
Where the research is distributed in Singapore to a person who is not an Accredited Investor, Expert Investor or an Institutional Investor, Oanda Asia Pacific Pte Ltd (“OAP“) accepts legal responsibility for the contents of the report to such persons only to the extent required by law. Singapore customers should contact OAP at 6579 8289 for matters arising from, or in connection with, the information/research distributed.

HKDJPY $HKDJPY Short ScalpHKDJPY $HKDJPY Short Scalp. 100-500x leverage. TPs on chart. After TP2 crosses, trailing stop loss with step of 0.5ATR, offset 1.5ATR

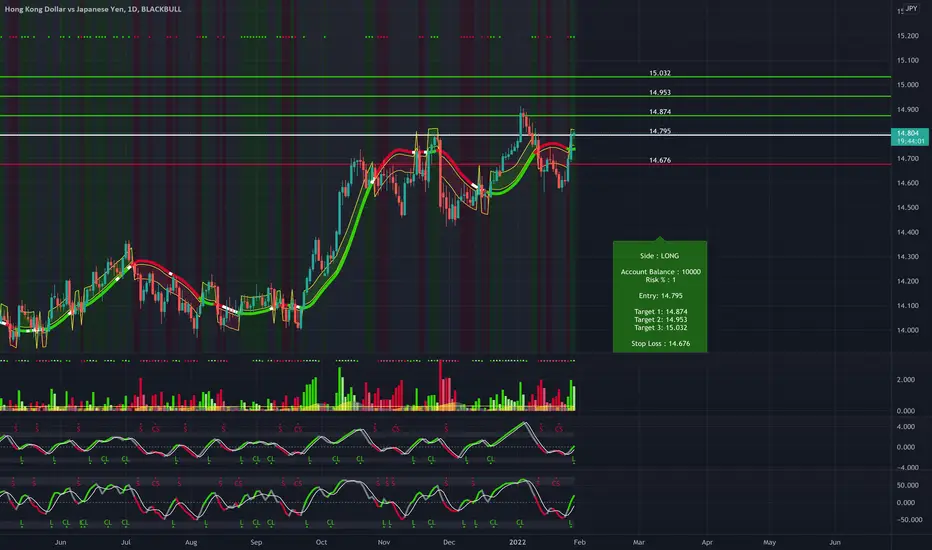
BETA TEST STRAT HKDJPY Long on DailyBeta testing new strat. HKDJPY Long on Daily. Targets and SL on the chart.

Down with HKDJPYYou heard it here first, folks! Zigzag forming now, in C Wave. Fibonacci extension gives me three goals in purple, and invalidation is in red as per usual. Remember, this is not financial advice - your decisions are your own.

HKDJPY technicaly based
📌Short intro:
I am full time trader - analyst * High accuracy of ideas * Technicaly and Fudnamentaly side in analysis * Comment if have any questions or want to send support * Price action - FIBO - Candl pattern * FX - STOCK - CRYPTO * Simple ideas
💡 HKDJPY technicaly based idea, candlels foramtion good bearish, we can see price is bounce from last supp zone (yellow line) expecting to see push down in price till FIBO 0.382 which is in same time and support zone.
📌Have on mind, trading involves risk, check idea on your own tactic, if have questions pls comment!
Thanks on supporting!
All best, good luck!

HKDJPY expecting higher bearish continuation technicaly based
ENTRY: 13.550
TP: 13.400
TP2: 13.200
TP3: 13.000
SL: 13.650
Chart time frame - 1W
Time for reaching TP - 1-2W
Follow, Like, Share or Comment
Thanks on supporting!
All best!

HKDJPY expecting bearish continuation in next period
ENTRY: 13.88000
TP: 13.83000
TP2: 13.78000
TP3: 13.73000
SL: 13.96000
Chart time frame - 1D
Time for reaching TP - 1-3D
Follow, Like, Share or Comment
Thanks on supporting!
All best!

HKDJPY Buy SignalPattern: 1D Channel Up.
Signal: Bullish on the next Higher Low (typically the 1D MA50 supports and the RSI goes within 50.000 - 45.000).
Target: 14.1500 (projected Higher High of the pattern).


HKDJPY Trade the break outPattern: Channel Down on 1D.
Signal: Bearish (1) if 13.7436 breaks. Bullish (2) if it holds or the Lower High trend line breaks upwards.
Target: TP(1) = 13.6000, TP(2) = 14.1000.

HKDJPY Buy SignalPattern: 1D Channel Up.
Signal: Bullish if the Higher Low sequence on 4H holds.
Target: 14.2500 (4H Resistance).

HKD/JPY Bullish !This pair is currently in an micro uptrend and still expecting it to see further upside
What I plan on doin on this trade is ...
Enter: 14.5719
Target: 14.76
Stop Loss: 14.4938

HKDJPY: Target hit. 1W Channel Up intact. Long.TP = 14.41427 hit as the 1W Channel Up (RSI = 56.437, MACD = 0.090, B/BP = 0.2883) rose to a 14.6150 Higher High. The price has since pulled back in order to price a new Lower Low, which should be near 14.200 (Highs/Lows = 0.0000). We will be going long on HKDJPY with TP = 14.600.

1W Channel Up. Long.HKDJPY is rising having made a Higher Low on the long term 1W Channel Up (RSI = 59.227, MACD = 0.035, Highs/Lows = 0.0546, B/BP = 0.1578). We expect to crosse the pivot (blue dotted line) swiftly as the buying pressure on 1D (RSI = 60.972, overbought on 3) accelerates. Consequently we are going long, TP = 14.41427 (previous Higher High) and 14.51650 (potential new Higher High) in extension.

1D Resistance test. Expecting rejection. Short.HKDJPY is currently testing the 14.19330 Resistance on the 1D Rectangle (MACD = 0.029, Highs/Lows = 0.0662, B/BP = 0.1221). Initiating a short, TP = 13.93664.

HKD/JPY 1H Chart: Channel DownThe Hong Kong Dollar has formed a channel down against the Japanese Yen in force since early July.
The rate failed to reach the lower boundary of the channel down during its last wave south, suggesting that the sentiment may soon change in favour of bulls. A confirmation of this move could be provided when the rate moves above the 55-, 100– and 200-hour SMAs near the 13.99 mark.
Gains could be limited by three weekly pivot points. Meanwhile, the upper limit is likely to be the monthly PP at 14.48 in case strong upside risks dominate the market.

HKDJPY target calculationHKDJPY has broken the support last week, see the chart for where is it heading

